Peasedown St. John Airbnb Market Analysis 2025: Short Term Rental Data & Vacation Rental Statistics in England, United Kingdom
Is Airbnb profitable in Peasedown St. John in 2025? Explore comprehensive Airbnb analytics for Peasedown St. John, England, United Kingdom to uncover income potential. This 2025 STR market report for Peasedown St. John, based on AirROI data from April 2024 to March 2025, reveals key trends in the niche market of 17 active listings.
Whether you're considering an Airbnb investment in Peasedown St. John, optimizing your existing vacation rental, or exploring rental arbitrage opportunities, understanding the Peasedown St. John Airbnb data is crucial. Leveraging the low regulation environment is key to maximizing your short term rental income potential. Let's dive into the specifics.
Key Peasedown St. John Airbnb Performance Metrics Overview
Monthly Airbnb Revenue Variations & Income Potential in Peasedown St. John (2025)
Understanding the monthly revenue variations for Airbnb listings in Peasedown St. John is key to maximizing your short term rental income potential. Seasonality significantly impacts earnings. Our analysis, based on data from the past 12 months, shows that the peak revenue month for STRs in Peasedown St. John is typically May, while March often presents the lowest earnings, highlighting opportunities for strategic pricing adjustments during shoulder and low seasons. Explore the typical Airbnb income in Peasedown St. John across different performance tiers:
- Best-in-class properties (Top 10%) achieve $4,412+ monthly, often utilizing dynamic pricing and superior guest experiences.
- Strong performing properties (Top 25%) earn $3,520 or more, indicating effective management and desirable locations/amenities.
- Typical properties (Median) generate around $2,722 per month, representing the average market performance.
- Entry-level properties (Bottom 25%) see earnings around $1,343, often with potential for optimization.
Average Monthly Airbnb Earnings Trend in Peasedown St. John
Peasedown St. John Airbnb Occupancy Rate Trends (2025)
Maximize your bookings by understanding the Peasedown St. John STR occupancy trends. Seasonal demand shifts significantly influence how often properties are booked. Typically, Septembersees the highest demand (peak season occupancy), while May experiences the lowest (low season). Effective strategies, like adjusting minimum stays or offering promotions, can boost occupancy during slower periods. Here's how different property tiers perform in Peasedown St. John:
- Best-in-class properties (Top 10%) achieve 93%+ occupancy, indicating high desirability and potentially optimized availability.
- Strong performing properties (Top 25%) maintain 78% or higher occupancy, suggesting good market fit and guest satisfaction.
- Typical properties (Median) have an occupancy rate around 59%.
- Entry-level properties (Bottom 25%) average 32% occupancy, potentially facing higher vacancy.
Average Monthly Occupancy Rate Trend in Peasedown St. John
Average Daily Rate (ADR) Airbnb Trends in Peasedown St. John (2025)
Effective short term rental pricing strategy in Peasedown St. John involves understanding monthly ADR fluctuations. The Average Daily Rate (ADR) for Airbnb in Peasedown St. John typically peaks in June and dips lowest during February. Leveraging Airbnb dynamic pricing tools or strategies based on this seasonality can significantly boost revenue. Here's a look at the typical nightly rates achieved:
- Best-in-class properties (Top 10%) command rates of $270+ per night, often due to premium features or locations.
- Strong performing properties (Top 25%) achieve nightly rates of $183 or more.
- Typical properties (Median) charge around $128 per night.
- Entry-level properties (Bottom 25%) earn around $93 per night.
Average Daily Rate (ADR) Trend by Month in Peasedown St. John
Get Live Peasedown St. John Market Intelligence 👇

Explore Real-time Analytics
Airbnb Seasonality Analysis & Trends in Peasedown St. John (2025)
Peak Season (May, June, April)
- Revenue averages $3,868 per month
- Occupancy rates average 47.6%
- Daily rates average $204
Shoulder Season
- Revenue averages $2,915 per month
- Occupancy maintains around 65.0%
- Daily rates hold near $202
Low Season (January, February, March)
- Revenue drops to average $2,277 per month
- Occupancy decreases to average 46.9%
- Daily rates adjust to average $194
Seasonality Insights for Peasedown St. John
- The Airbnb seasonality in Peasedown St. John shows highly seasonal trends requiring careful strategy. While the sections above show seasonal averages, it's also insightful to look at the extremes:
- During the high season, the absolute peak month showcases Peasedown St. John's highest earning potential, with monthly revenues capable of climbing to $4,326, occupancy reaching a high of 77.5%, and ADRs peaking at $206.
- Conversely, the slowest single month of the year, typically falling within the low season, marks the market's lowest point. In this month, revenue might dip to $2,052, occupancy could drop to 46.0%, and ADRs may adjust down to $193.
- Understanding both the seasonal averages and these monthly peaks and troughs in revenue, occupancy, and ADR is crucial for maximizing your Airbnb profit potential in Peasedown St. John.
Seasonal Strategies for Maximizing Profit
- Peak Season: Maximize revenue through premium pricing and potentially longer minimum stays. Ensure high availability.
- Low Season: Offer competitive pricing, special promotions (e.g., extended stay discounts), and flexible cancellation policies. Target off-season travelers like remote workers or budget-conscious guests.
- Shoulder Seasons: Implement dynamic pricing that balances peak and low rates. Target weekend travelers or specific events. Offer slightly more flexible terms than peak season.
- Regularly analyze your own performance against these Peasedown St. John seasonality benchmarks and adjust your pricing and availability strategy accordingly.
Best Areas for Airbnb Investment in Peasedown St. John (2025)
Exploring the top neighborhoods for short-term rentals in Peasedown St. John? This section highlights key areas, outlining why they are attractive for hosts and guests, along with notable local attractions. Consider these locations based on your target guest profile and investment strategy.
| Neighborhood / Area | Why Host Here? (Target Guests & Appeal) | Key Attractions & Landmarks |
|---|---|---|
| Peasedown St. John Village Center | The heart of Peasedown St. John with local shops and cafes. It's a welcoming community hub that attracts visitors looking for a quaint English village experience. | Peasedown St. John Community Library, Local Pubs, Peasedown St. John Park, Walking Trails, Nearby Bath Spa |
| Yearl Hill | This area offers picturesque views and is popular for outdoor activities. Ideal for nature lovers and those seeking a retreat from urban life. | Yearl Hill Nature Reserve, Walking Trails, Scenic Views |
| Bath Road | A convenient main road that offers access to local amenities and transport links. Great for those looking to explore nearby Bath while enjoying a more suburban feel. | Local stores, Transport Links to Bath, Cafe culture |
| Norton Radstock Station | Close to the historical and cultural attractions of Radstock, this location is perfect for tourists visiting the surrounding countryside and nearby cities. | Radstock Museum, Nearby cycling routes, Historic sites |
| Pendock Crescent | A quiet residential area known for its family-friendly environment. Attracts visitors looking for a peaceful stay close to local schools and parks. | Family-friendly Parks, Local Playgrounds, Community Events |
| Midford | Situated near the scenic Midford Castle, this area is appealing for guests interested in history and architecture. | Midford Castle, Historic Walking Tours, Countryside Views |
| Farrington Gurney | A charming village located just outside Peasedown, offering a taste of rural life with easy access to larger towns. Attracts visitors looking for tranquility and local charm. | Village Green, Local Markets, Nature Walks |
| Camerton | Located near a historic coal mining village, Camerton offers a unique glimpse into the industrial history of the region with lovely surrounding countryside. | Camerton Roman Villa, Nature Trails, Local Historical Sites |
Understanding Airbnb License Requirements & STR Laws in Peasedown St. John (2025)
While Peasedown St. John, England, United Kingdom currently shows low STR regulations, specific Airbnb license requirements might still exist or change. Always verify the latest short term rental regulations and Airbnb license requirements directly with local government authorities for Peasedown St. John to ensure full compliance before hosting.
(Source: AirROI data, 2025, finding no licensed listings among those analyzed)
Top Performing Airbnb Properties in Peasedown St. John (2025)
Benchmark your potential! Explore examples of top-performing Airbnb properties in Peasedown St. Johnbased on Trailing Twelve Month (TTM) revenue. Analyze their characteristics, revenue, occupancy rate, and ADR to understand what drives success in this market.
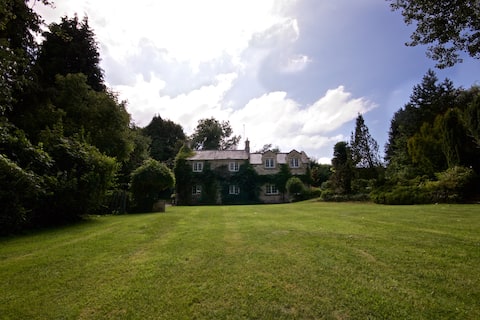
Charming house, near Bath sleeps 8 with hot tub
Entire Place • 4 bedrooms

Elegantly Converted Stables near Bath with Luxury Hot Tub
Entire Place • 1 bedroom
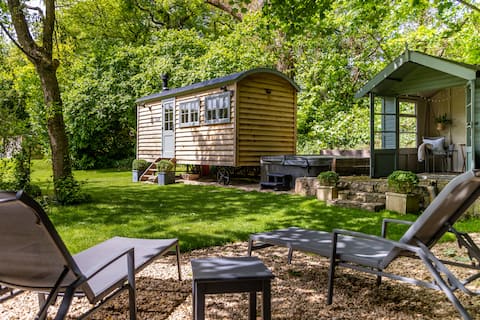
Luxury Shepherds Hut with hot tub near Bath
Entire Place • 1 bedroom
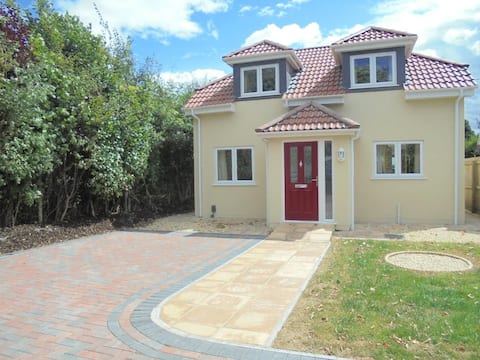
Beautiful modern house perfect for Bath
Entire Place • 3 bedrooms
Cherry’s Cottage
Entire Place • 2 bedrooms
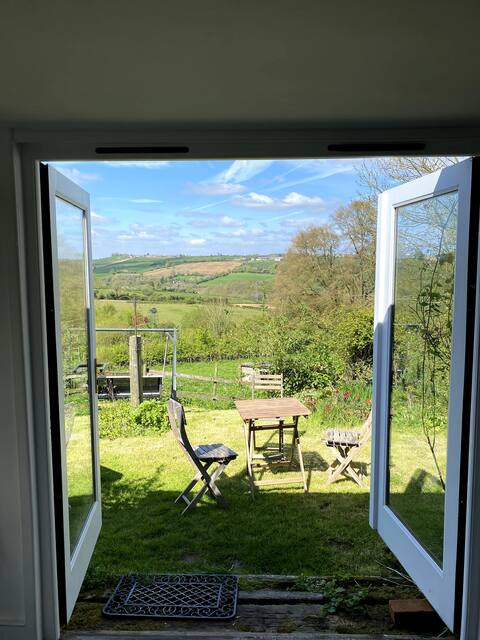
Quiet 3 Bed Property in Somerset, close to Bath
Entire Place • 3 bedrooms
Note: Performance varies based on location, size, amenities, seasonality, and management quality. Data reflects the past 12 months.
Top Performing Airbnb Hosts in Peasedown St. John (2025)
Learn from the best! This table showcases top-performing Airbnb hosts in Peasedown St. John based on the number of properties managed and estimated total revenue over the past year. Analyze their scale and performance metrics.
| Host Name | Properties | Grossing Revenue | Stay Reviews | Avg Rating |
|---|---|---|---|---|
| Nancy | 3 | $171,230 | 748 | 4.98/5.0 |
| Ross | 2 | $47,767 | 417 | 4.79/5.0 |
| Andrew | 1 | $37,792 | 562 | 4.83/5.0 |
| Louise | 1 | $37,012 | 40 | 4.98/5.0 |
| Oliver | 1 | $34,385 | 60 | 4.83/5.0 |
| Helen | 1 | $31,643 | 119 | 4.82/5.0 |
| Catherine | 1 | $30,893 | 415 | 4.94/5.0 |
| Tony And Jane | 1 | $26,315 | 683 | 4.93/5.0 |
| Peter | 1 | $22,643 | 41 | 4.98/5.0 |
| Somerset Rentals | 1 | $22,389 | 4 | 4.50/5.0 |
Analyzing the strategies of top hosts, such as their property selection, pricing, and guest communication, can offer valuable lessons for optimizing your own Airbnb operations in Peasedown St. John.
Dive Deeper: Advanced Peasedown St. John STR Market Data (2025)
Ready to unlock more insights? AirROI provides access to advanced metrics and comprehensive Airbnb data for Peasedown St. John. Explore detailed analytics beyond this report to refine your investment strategy, optimize pricing, and maximize your vacation rental profits.
Explore Advanced MetricsPeasedown St. John Short-Term Rental Market Composition (2025): Property & Room Types
Room Type Distribution
Property Type Distribution
Market Composition Insights for Peasedown St. John
- The Peasedown St. John Airbnb market composition is heavily skewed towards Entire Home/Apt listings, which make up 88.2% of the 17 active rentals. This indicates strong guest preference for privacy and space.
- Looking at the property type distribution in Peasedown St. John, House properties are the most common (70.6%), reflecting the local real estate landscape.
- Houses represent a significant 70.6% portion, catering likely to families or larger groups.
- The presence of 11.8% Hotel/Boutique listings indicates integration with traditional hospitality.
Peasedown St. John Airbnb Room Capacity Analysis (2025): Bedroom Distribution
Distribution of Listings by Number of Bedrooms
Room Capacity Insights for Peasedown St. John
- The dominant room capacity in Peasedown St. John is 1 bedroom listings, making up 41.2% of the market. This suggests a strong demand for properties suitable for couples or solo travelers.
- Together, 1 bedroom and 2 bedrooms properties represent 64.7% of the active Airbnb listings in Peasedown St. John, indicating a high concentration in these sizes.
- A significant 23.5% of listings offer 3+ bedrooms, catering to larger groups and families seeking more space in Peasedown St. John.
Peasedown St. John Vacation Rental Guest Capacity Trends (2025)
Distribution of Listings by Guest Capacity
Guest Capacity Insights for Peasedown St. John
- The most common guest capacity trend in Peasedown St. John vacation rentals is listings accommodating 2 guests (47.1%). This suggests the primary traveler segment is likely couples or solo travelers.
- Properties designed for 2 guests and 4 guests dominate the Peasedown St. John STR market, accounting for 64.7% of listings.
- A significant 47.1% of listings cater specifically to 1-2 guests, highlighting strong demand from couples and solo travelers in Peasedown St. John.
- 17.7% of properties accommodate 6+ guests, serving the market segment for larger families or group travel in Peasedown St. John.
- On average, properties in Peasedown St. John are equipped to host 3.1 guests.
Peasedown St. John Airbnb Booking Patterns (2025): Available vs. Booked Days
Available Days Distribution
Booked Days Distribution
Booking Pattern Insights for Peasedown St. John
- The most common availability pattern in Peasedown St. John falls within the 91-180 days range, representing 35.3% of listings. This suggests many properties have significant open periods on their calendars.
- Approximately 47.0% of listings show high availability (181+ days open annually), indicating potential for increased bookings or specific owner usage patterns.
- For booked days, the 181-270 days range is most frequent in Peasedown St. John (35.3%), reflecting common guest stay durations or potential owner blocking patterns.
- A notable 52.9% of properties secure long booking periods (181+ days booked per year), highlighting successful long-term rental strategies or significant owner usage.
Peasedown St. John Airbnb Minimum Stay Requirements Analysis
Distribution of Listings by Minimum Night Requirement
1 Night
4 listings
23.5% of total
2 Nights
7 listings
41.2% of total
3 Nights
1 listings
5.9% of total
7-29 Nights
1 listings
5.9% of total
30+ Nights
4 listings
23.5% of total
Key Insights
- The most prevalent minimum stay requirement in Peasedown St. John is 2 Nights, adopted by 41.2% of listings. This highlights the market's preference for shorter, flexible bookings.
- A strong majority (64.7%) of the Peasedown St. John Airbnb data shows acceptance of very short stays (1-2 nights), indicating a dynamic, high-turnover market.
- A significant segment (23.5%) caters to monthly stays (30+ nights) in Peasedown St. John, pointing to opportunities in the extended-stay market.
Recommendations
- Align with the market by considering a 2 Nights minimum stay, as 41.2% of Peasedown St. John hosts use this setting.
- If feasible, allowing 1-night stays, especially midweek or during low season, could capture last-minute bookings, as only 23.5% currently do.
- Explore offering discounts for stays of 30+ nights to attract the 23.5% of the market seeking extended stays.
- Adjust minimum nights based on seasonality – potentially shorter during low season and longer during peak demand periods in Peasedown St. John.
Peasedown St. John Airbnb Cancellation Policy Trends Analysis (2025)
Super Strict 60 Days
2 listings
11.8% of total
Flexible
3 listings
17.6% of total
Moderate
6 listings
35.3% of total
Firm
2 listings
11.8% of total
Strict
4 listings
23.5% of total
Cancellation Policy Insights for Peasedown St. John
- The prevailing Airbnb cancellation policy trend in Peasedown St. John is Moderate, used by 35.3% of listings.
- There's a relatively balanced mix between guest-friendly (52.9%) and stricter (35.3%) policies, offering choices for different guest needs.
Recommendations for Hosts
- Consider adopting a Moderate policy to align with the 35.3% market standard in Peasedown St. John.
- Regularly review your cancellation policy against competitors and market demand shifts in Peasedown St. John.
Peasedown St. John STR Booking Lead Time Analysis (2025)
Average Booking Lead Time by Month
Booking Lead Time Insights for Peasedown St. John
- The overall average booking lead time for vacation rentals in Peasedown St. John is 62 days.
- Guests book furthest in advance for stays during July (average 109 days), likely coinciding with peak travel demand or local events.
- The shortest booking windows occur for stays in March (average 38 days), indicating more last-minute travel plans during this time.
- Seasonally, Summer (94 days avg.) sees the longest lead times, while Winter (51 days avg.) has the shortest, reflecting typical travel planning cycles.
Recommendations for Hosts
- Use the overall average lead time (62 days) as a baseline for your pricing and availability strategy in Peasedown St. John.
- For July stays, consider implementing length-of-stay discounts or slightly higher rates for bookings made less than 109 days out to capitalize on advance planning.
- Target marketing efforts for the Summer season well in advance (at least 94 days) to capture early planners.
- Monitor your own booking lead times against these Peasedown St. John averages to identify opportunities for dynamic pricing adjustments.
Popular & Essential Airbnb Amenities in Peasedown St. John (2025)
Amenity Prevalence
Amenity Insights for Peasedown St. John
- Essential amenities in Peasedown St. John that guests expect include: Heating, Smoke alarm, Wifi. Lacking these (any) could significantly impact bookings.
- Popular amenities like TV, Free parking on premises, Hangers are common but not universal. Offering these can provide a competitive edge.
Recommendations for Hosts
- Ensure your listing includes all essential amenities for Peasedown St. John: Heating, Smoke alarm, Wifi.
- Consider adding popular differentiators like TV or Free parking on premises to increase appeal.
- Highlight unique or less common amenities you offer (e.g., hot tub, dedicated workspace, EV charger) in your listing description and photos.
- Regularly check competitor amenities in Peasedown St. John to stay competitive.
Peasedown St. John Airbnb Guest Demographics & Profile Analysis (2025)
Guest Profile Summary for Peasedown St. John
- The typical guest profile for Airbnb in Peasedown St. John consists of primarily domestic travelers (80%), often arriving from nearby England, typically belonging to the Post-2000s (Gen Z/Alpha) group (50%), primarily speaking English or French.
- Domestic travelers account for 80.2% of guests.
- Key international markets include United Kingdom (80.2%) and Australia (5.1%).
- Top languages spoken are English (68.3%) followed by French (7.3%).
- A significant demographic segment is the Post-2000s (Gen Z/Alpha) group, representing 50% of guests.
Recommendations for Hosts
- Target domestic marketing efforts towards travelers from England and London.
- Tailor amenities and listing descriptions to appeal to the dominant Post-2000s (Gen Z/Alpha) demographic (e.g., highlight fast WiFi, smart home features, local guides).
- Highlight unique local experiences or amenities relevant to the primary guest profile.
- Consider seasonal promotions aligned with peak travel times for key origin markets.
Nearby Short-Term Rental Market Comparison
How does the Peasedown St. John Airbnb market stack up against its neighbors? Compare key performance metrics like average monthly revenue, ADR, and occupancy rates in surrounding areas to understand the broader regional STR landscape.
| Market | Active Properties | Monthly Revenue | Daily Rate | Avg. Occupancy |
|---|---|---|---|---|
| Englishcombe | 13 | $8,558 | $573.69 | 49% |
| Chew Magna | 14 | $6,649 | $399.59 | 46% |
| Lambourn | 11 | $6,081 | $669.47 | 28% |
| Long Sutton | 17 | $5,726 | $383.88 | 46% |
| Stoke St. Michael | 10 | $5,277 | $424.04 | 42% |
| Winsham | 10 | $5,154 | $484.22 | 52% |
| Oldland Common | 13 | $5,093 | $355.47 | 43% |
| Crai | 20 | $4,799 | $371.85 | 46% |
| Dinton | 11 | $4,637 | $242.16 | 58% |
| Limpley Stoke | 10 | $4,598 | $523.47 | 52% |