Par Airbnb Market Analysis 2025: Short Term Rental Data & Vacation Rental Statistics in England, United Kingdom
Is Airbnb profitable in Par in 2025? Explore comprehensive Airbnb analytics for Par, England, United Kingdom to uncover income potential. This 2025 STR market report for Par, based on AirROI data from April 2024 to March 2025, reveals key trends in the niche market of 34 active listings.
Whether you're considering an Airbnb investment in Par, optimizing your existing vacation rental, or exploring rental arbitrage opportunities, understanding the Par Airbnb data is crucial. Leveraging the low regulation environment is key to maximizing your short term rental income potential. Let's dive into the specifics.
Key Par Airbnb Performance Metrics Overview
Monthly Airbnb Revenue Variations & Income Potential in Par (2025)
Understanding the monthly revenue variations for Airbnb listings in Par is key to maximizing your short term rental income potential. Seasonality significantly impacts earnings. Our analysis, based on data from the past 12 months, shows that the peak revenue month for STRs in Par is typically August, while January often presents the lowest earnings, highlighting opportunities for strategic pricing adjustments during shoulder and low seasons. Explore the typical Airbnb income in Par across different performance tiers:
- Best-in-class properties (Top 10%) achieve $2,847+ monthly, often utilizing dynamic pricing and superior guest experiences.
- Strong performing properties (Top 25%) earn $1,850 or more, indicating effective management and desirable locations/amenities.
- Typical properties (Median) generate around $1,110 per month, representing the average market performance.
- Entry-level properties (Bottom 25%) see earnings around $658, often with potential for optimization.
Average Monthly Airbnb Earnings Trend in Par
Par Airbnb Occupancy Rate Trends (2025)
Maximize your bookings by understanding the Par STR occupancy trends. Seasonal demand shifts significantly influence how often properties are booked. Typically, Augustsees the highest demand (peak season occupancy), while January experiences the lowest (low season). Effective strategies, like adjusting minimum stays or offering promotions, can boost occupancy during slower periods. Here's how different property tiers perform in Par:
- Best-in-class properties (Top 10%) achieve 60%+ occupancy, indicating high desirability and potentially optimized availability.
- Strong performing properties (Top 25%) maintain 41% or higher occupancy, suggesting good market fit and guest satisfaction.
- Typical properties (Median) have an occupancy rate around 28%.
- Entry-level properties (Bottom 25%) average 16% occupancy, potentially facing higher vacancy.
Average Monthly Occupancy Rate Trend in Par
Average Daily Rate (ADR) Airbnb Trends in Par (2025)
Effective short term rental pricing strategy in Par involves understanding monthly ADR fluctuations. The Average Daily Rate (ADR) for Airbnb in Par typically peaks in August and dips lowest during January. Leveraging Airbnb dynamic pricing tools or strategies based on this seasonality can significantly boost revenue. Here's a look at the typical nightly rates achieved:
- Best-in-class properties (Top 10%) command rates of $182+ per night, often due to premium features or locations.
- Strong performing properties (Top 25%) achieve nightly rates of $146 or more.
- Typical properties (Median) charge around $120 per night.
- Entry-level properties (Bottom 25%) earn around $101 per night.
Average Daily Rate (ADR) Trend by Month in Par
Get Live Par Market Intelligence 👇

Explore Real-time Analytics
Airbnb Seasonality Analysis & Trends in Par (2025)
Peak Season (August, September, July)
- Revenue averages $2,149 per month
- Occupancy rates average 48.1%
- Daily rates average $138
Shoulder Season
- Revenue averages $1,318 per month
- Occupancy maintains around 26.8%
- Daily rates hold near $128
Low Season (January, February, March)
- Revenue drops to average $949 per month
- Occupancy decreases to average 25.1%
- Daily rates adjust to average $120
Seasonality Insights for Par
- The Airbnb seasonality in Par shows highly seasonal trends requiring careful strategy. While the sections above show seasonal averages, it's also insightful to look at the extremes:
- During the high season, the absolute peak month showcases Par's highest earning potential, with monthly revenues capable of climbing to $2,649, occupancy reaching a high of 60.8%, and ADRs peaking at $143.
- Conversely, the slowest single month of the year, typically falling within the low season, marks the market's lowest point. In this month, revenue might dip to $860, occupancy could drop to 19.7%, and ADRs may adjust down to $119.
- Understanding both the seasonal averages and these monthly peaks and troughs in revenue, occupancy, and ADR is crucial for maximizing your Airbnb profit potential in Par.
Seasonal Strategies for Maximizing Profit
- Peak Season: Maximize revenue through premium pricing and potentially longer minimum stays. Ensure high availability.
- Low Season: Offer competitive pricing, special promotions (e.g., extended stay discounts), and flexible cancellation policies. Target off-season travelers like remote workers or budget-conscious guests.
- Shoulder Seasons: Implement dynamic pricing that balances peak and low rates. Target weekend travelers or specific events. Offer slightly more flexible terms than peak season.
- Regularly analyze your own performance against these Par seasonality benchmarks and adjust your pricing and availability strategy accordingly.
Best Areas for Airbnb Investment in Par (2025)
Exploring the top neighborhoods for short-term rentals in Par? This section highlights key areas, outlining why they are attractive for hosts and guests, along with notable local attractions. Consider these locations based on your target guest profile and investment strategy.
| Neighborhood / Area | Why Host Here? (Target Guests & Appeal) | Key Attractions & Landmarks |
|---|---|---|
| Newquay | A popular surfing destination known for its stunning beaches and vibrant nightlife. It attracts both families and young surfers, making it an ideal location for Airbnb hosting. | Fistral Beach, Newquay Zoo, Blue Reef Aquarium, Great Western Beach, Trenance Gardens, Nightlife in Newquay |
| St Austell | Home to the famous Eden Project, this town offers a unique blend of nature and culture, making it appealing to visitors interested in eco-tourism and attractions. | Eden Project, Lost Gardens of Heligan, Charlestown Harbour, St Austell Bay, Porthpean Beach, Bodmin Moor |
| Fowey | A picturesque town known for its stunning riverside views and quaint atmosphere, attracting tourists looking for a scenic getaway. Perfect for romantic retreats and family holidays. | Fowey Estuary, The Ship Inn, St Catherine's Castle, Readymoney Cove, Fowey Museum, National Trust properties |
| Looe | A charming fishing town with beautiful beaches and a friendly community vibe. Attracts families and those looking for a coastal retreat. | East Looe Beach, West Looe Beach, Looe Island, Seaton Beach, Old Guildhall Museum, Looe’s waterfront |
| Penzance | An artistic and historic town with a rich maritime heritage, it draws visitors interested in culture, history, and beautiful coastal landscapes. | St Michael's Mount, Penlee House Gallery, The Minack Theatre, Penzance Promenade, Newlyn Art Gallery, Sennen Cove |
| Bude | Renowned for its surfing and beautiful sandy beaches, this town is an attractive destination for both water sports enthusiasts and families looking for a beach holiday. | Bude Sea Pool, Summerleaze Beach, Sandymouth Bay, Bude Castle, The Bude Canal, Hawkers Cove |
| Truro | As the commercial and cultural center of Cornwall, Truro is perfect for visitors interested in shopping, dining, and exploring the local arts scene. | Truro Cathedral, Royal Cornwall Museum, Hall for Cornwall, Lemon Quay, Boscawen Park, City Hall |
| St Ives | A vibrant town famous for its beautiful beaches and art scene, attracting tourists interested in culture, relaxation, and outdoor activities. | St Ives Harbour, Tate St Ives, Barbara Hepworth Museum, Porthminster Beach, Carbis Bay, The Island |
Understanding Airbnb License Requirements & STR Laws in Par (2025)
While Par, England, United Kingdom currently shows low STR regulations, specific Airbnb license requirements might still exist or change. Always verify the latest short term rental regulations and Airbnb license requirements directly with local government authorities for Par to ensure full compliance before hosting.
(Source: AirROI data, 2025, finding no licensed listings among those analyzed)
Top Performing Airbnb Properties in Par (2025)
Benchmark your potential! Explore examples of top-performing Airbnb properties in Parbased on Trailing Twelve Month (TTM) revenue. Analyze their characteristics, revenue, occupancy rate, and ADR to understand what drives success in this market.
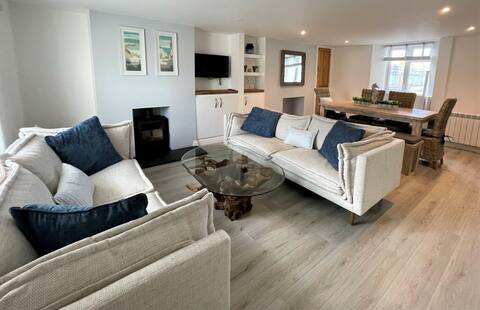
The Little Seahorse - Newly renovated near beach
Entire Place • 3 bedrooms
The Beach Retreat
Entire Place • 2 bedrooms
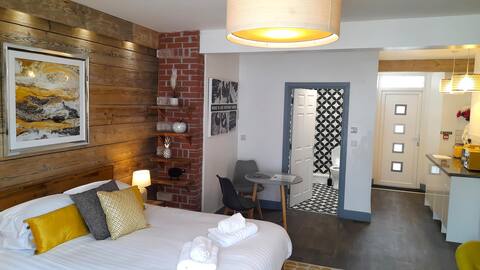
Tickety Boo Studio Apartment
Entire Place • 1 bedroom
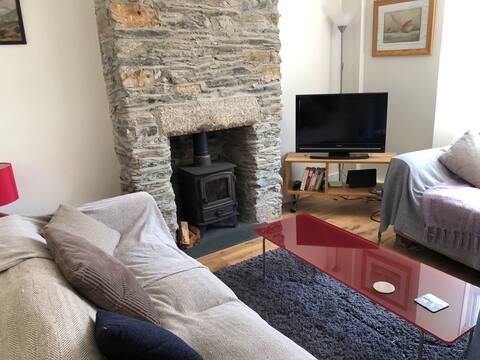
Delightful Cornish 2 bedroom terraced cottage
Entire Place • 2 bedrooms
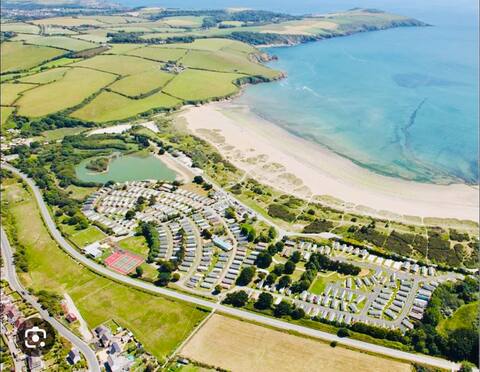
Parbados holiday home Caravan on Par Beach
Entire Place • 2 bedrooms
Sandy Toes Accommodation | Retro Studio En-suite
Entire Place • 1 bedroom
Note: Performance varies based on location, size, amenities, seasonality, and management quality. Data reflects the past 12 months.
Top Performing Airbnb Hosts in Par (2025)
Learn from the best! This table showcases top-performing Airbnb hosts in Par based on the number of properties managed and estimated total revenue over the past year. Analyze their scale and performance metrics.
| Host Name | Properties | Grossing Revenue | Stay Reviews | Avg Rating |
|---|---|---|---|---|
| Antony | 4 | $72,286 | 101 | 4.77/5.0 |
| Snowland | 14 | $63,146 | 261 | 4.37/5.0 |
| Margaret | 1 | $45,549 | 68 | 4.88/5.0 |
| Darren And Hannah | 1 | $35,374 | 13 | 5.00/5.0 |
| John | 1 | $19,735 | 13 | 4.77/5.0 |
| Host #229113229 | 1 | $17,190 | 2 | 0.00/5.0 |
| Susie | 1 | $13,090 | 190 | 4.95/5.0 |
| Lesley | 1 | $12,817 | 19 | 4.95/5.0 |
| Michael | 1 | $12,418 | 17 | 4.94/5.0 |
| Cottages | 2 | $12,098 | 10 | 2.40/5.0 |
Analyzing the strategies of top hosts, such as their property selection, pricing, and guest communication, can offer valuable lessons for optimizing your own Airbnb operations in Par.
Dive Deeper: Advanced Par STR Market Data (2025)
Ready to unlock more insights? AirROI provides access to advanced metrics and comprehensive Airbnb data for Par. Explore detailed analytics beyond this report to refine your investment strategy, optimize pricing, and maximize your vacation rental profits.
Explore Advanced MetricsPar Short-Term Rental Market Composition (2025): Property & Room Types
Room Type Distribution
Property Type Distribution
Market Composition Insights for Par
- The Par Airbnb market composition is heavily skewed towards Entire Home/Apt listings, which make up 85.3% of the 34 active rentals. This indicates strong guest preference for privacy and space.
- Looking at the property type distribution in Par, Outdoor/Unique properties are the most common (44.1%), reflecting the local real estate landscape.
- Houses represent a significant 26.5% portion, catering likely to families or larger groups.
Par Airbnb Room Capacity Analysis (2025): Bedroom Distribution
Distribution of Listings by Number of Bedrooms
Room Capacity Insights for Par
- The dominant room capacity in Par is 2 bedrooms listings, making up 47.1% of the market. This suggests a strong demand for properties suitable for couples or solo travelers.
- Together, 2 bedrooms and 3 bedrooms properties represent 67.7% of the active Airbnb listings in Par, indicating a high concentration in these sizes.
- A significant 20.6% of listings offer 3+ bedrooms, catering to larger groups and families seeking more space in Par.
Par Vacation Rental Guest Capacity Trends (2025)
Distribution of Listings by Guest Capacity
Guest Capacity Insights for Par
- The most common guest capacity trend in Par vacation rentals is listings accommodating 4 guests (38.2%). This suggests the primary traveler segment is likely small families or groups.
- Properties designed for 4 guests and 6 guests dominate the Par STR market, accounting for 70.6% of listings.
- 32.4% of properties accommodate 6+ guests, serving the market segment for larger families or group travel in Par.
- On average, properties in Par are equipped to host 4.0 guests.
Par Airbnb Booking Patterns (2025): Available vs. Booked Days
Available Days Distribution
Booked Days Distribution
Booking Pattern Insights for Par
- The most common availability pattern in Par falls within the 271-366 days range, representing 61.8% of listings. This suggests many properties have significant open periods on their calendars.
- Approximately 91.2% of listings show high availability (181+ days open annually), indicating potential for increased bookings or specific owner usage patterns.
- For booked days, the 31-90 days range is most frequent in Par (35.3%), reflecting common guest stay durations or potential owner blocking patterns.
- A notable 8.8% of properties secure long booking periods (181+ days booked per year), highlighting successful long-term rental strategies or significant owner usage.
Par Airbnb Minimum Stay Requirements Analysis
Distribution of Listings by Minimum Night Requirement
1 Night
8 listings
25.8% of total
2 Nights
4 listings
12.9% of total
3 Nights
5 listings
16.1% of total
4-6 Nights
11 listings
35.5% of total
30+ Nights
3 listings
9.7% of total
Key Insights
- The most prevalent minimum stay requirement in Par is 4-6 Nights, adopted by 35.5% of listings. This highlights the market's preference for longer commitments.
Recommendations
- Align with the market by considering a 4-6 Nights minimum stay, as 35.5% of Par hosts use this setting.
- If feasible, allowing 1-night stays, especially midweek or during low season, could capture last-minute bookings, as only 25.8% currently do.
- Explore offering discounts for stays of 30+ nights to attract the 9.7% of the market seeking extended stays.
- Adjust minimum nights based on seasonality – potentially shorter during low season and longer during peak demand periods in Par.
Par Airbnb Cancellation Policy Trends Analysis (2025)
Super Strict 30 Days
4 listings
13.3% of total
Super Strict 60 Days
1 listings
3.3% of total
Flexible
6 listings
20% of total
Moderate
5 listings
16.7% of total
Firm
4 listings
13.3% of total
Strict
10 listings
33.3% of total
Cancellation Policy Insights for Par
- The prevailing Airbnb cancellation policy trend in Par is Strict, used by 33.3% of listings.
- There's a relatively balanced mix between guest-friendly (36.7%) and stricter (46.6%) policies, offering choices for different guest needs.
Recommendations for Hosts
- Consider adopting a Strict policy to align with the 33.3% market standard in Par.
- With 33.3% using Strict terms, this is a viable option in Par, particularly for high-value properties or during peak demand periods.
- Regularly review your cancellation policy against competitors and market demand shifts in Par.
Par STR Booking Lead Time Analysis (2025)
Average Booking Lead Time by Month
Booking Lead Time Insights for Par
- The overall average booking lead time for vacation rentals in Par is 48 days.
- Guests book furthest in advance for stays during December (average 100 days), likely coinciding with peak travel demand or local events.
- The shortest booking windows occur for stays in January (average 13 days), indicating more last-minute travel plans during this time.
- Seasonally, Summer (62 days avg.) sees the longest lead times, while Spring (36 days avg.) has the shortest, reflecting typical travel planning cycles.
Recommendations for Hosts
- Use the overall average lead time (48 days) as a baseline for your pricing and availability strategy in Par.
- For December stays, consider implementing length-of-stay discounts or slightly higher rates for bookings made less than 100 days out to capitalize on advance planning.
- During January, focus on last-minute booking availability and promotions, as guests book with very short notice (13 days avg.).
- Target marketing efforts for the Summer season well in advance (at least 62 days) to capture early planners.
- Monitor your own booking lead times against these Par averages to identify opportunities for dynamic pricing adjustments.
Popular & Essential Airbnb Amenities in Par (2025)
Amenity Prevalence
Amenity Insights for Par
- Essential amenities in Par that guests expect include: TV, Smoke alarm. Lacking these (any) could significantly impact bookings.
- Popular amenities like Heating, Kitchen, Fire extinguisher are common but not universal. Offering these can provide a competitive edge.
Recommendations for Hosts
- Ensure your listing includes all essential amenities for Par: TV, Smoke alarm.
- Prioritize adding missing essentials: Smoke alarm.
- Consider adding popular differentiators like Heating or Kitchen to increase appeal.
- Highlight unique or less common amenities you offer (e.g., hot tub, dedicated workspace, EV charger) in your listing description and photos.
- Regularly check competitor amenities in Par to stay competitive.
Par Airbnb Guest Demographics & Profile Analysis (2025)
Guest Profile Summary for Par
- The typical guest profile for Airbnb in Par consists of primarily domestic travelers (84%), often arriving from nearby England, typically belonging to the Post-2000s (Gen Z/Alpha) group (50%), primarily speaking English or German.
- Domestic travelers account for 84.3% of guests.
- Key international markets include United Kingdom (84.3%) and Germany (3.7%).
- Top languages spoken are English (63.9%) followed by German (8.3%).
- A significant demographic segment is the Post-2000s (Gen Z/Alpha) group, representing 50% of guests.
Recommendations for Hosts
- Target domestic marketing efforts towards travelers from England and London.
- Tailor amenities and listing descriptions to appeal to the dominant Post-2000s (Gen Z/Alpha) demographic (e.g., highlight fast WiFi, smart home features, local guides).
- Highlight unique local experiences or amenities relevant to the primary guest profile.
- Consider seasonal promotions aligned with peak travel times for key origin markets.
Nearby Short-Term Rental Market Comparison
How does the Par Airbnb market stack up against its neighbors? Compare key performance metrics like average monthly revenue, ADR, and occupancy rates in surrounding areas to understand the broader regional STR landscape.
| Market | Active Properties | Monthly Revenue | Daily Rate | Avg. Occupancy |
|---|---|---|---|---|
| Llanrhidian | 15 | $4,842 | $386.18 | 53% |
| Crai | 20 | $4,799 | $371.85 | 46% |
| Trenance | 19 | $4,795 | $428.63 | 43% |
| Angle | 13 | $4,602 | $384.81 | 42% |
| Ludchurch | 15 | $4,354 | $291.87 | 43% |
| Redberth | 29 | $4,103 | $223.37 | 59% |
| Higher Crackington | 17 | $3,731 | $340.74 | 37% |
| Milverton | 11 | $3,675 | $393.89 | 37% |
| Pennorth | 13 | $3,595 | $417.69 | 37% |
| Gilwern | 22 | $3,505 | $193.56 | 53% |