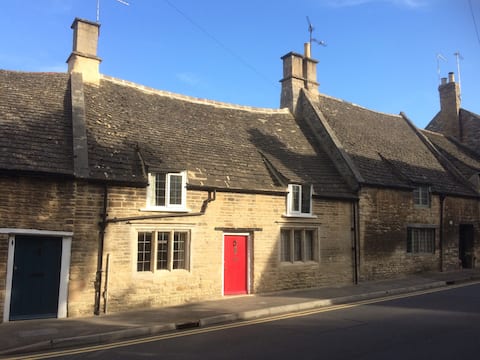
Oundle Airbnb Market Analysis 2025: Short Term Rental Data & Vacation Rental Statistics in England, United Kingdom
Is Airbnb profitable in Oundle in 2025? Explore comprehensive Airbnb analytics for Oundle, England, United Kingdom to uncover income potential. This 2025 STR market report for Oundle, based on AirROI data from August 2024 to July 2025, reveals key trends in the niche market of 18 active listings.
Whether you're considering an Airbnb investment in Oundle, optimizing your existing vacation rental, or exploring rental arbitrage opportunities, understanding the Oundle Airbnb data is crucial. Leveraging the low regulation environment is key to maximizing your short term rental income potential. Let's dive into the specifics.
Key Oundle Airbnb Performance Metrics Overview
Monthly Airbnb Revenue Variations & Income Potential in Oundle (2025)
Understanding the monthly revenue variations for Airbnb listings in Oundle is key to maximizing your short term rental income potential. Seasonality significantly impacts earnings. Our analysis, based on data from the past 12 months, shows that the peak revenue month for STRs in Oundle is typically July, while January often presents the lowest earnings, highlighting opportunities for strategic pricing adjustments during shoulder and low seasons. Explore the typical Airbnb income in Oundle across different performance tiers:
- Best-in-class properties (Top 10%) achieve $4,334+ monthly, often utilizing dynamic pricing and superior guest experiences.
- Strong performing properties (Top 25%) earn $3,018 or more, indicating effective management and desirable locations/amenities.
- Typical properties (Median) generate around $1,809 per month, representing the average market performance.
- Entry-level properties (Bottom 25%) see earnings around $942, often with potential for optimization.
Average Monthly Airbnb Earnings Trend in Oundle
Oundle Airbnb Occupancy Rate Trends (2025)
Maximize your bookings by understanding the Oundle STR occupancy trends. Seasonal demand shifts significantly influence how often properties are booked. Typically, Julysees the highest demand (peak season occupancy), while October experiences the lowest (low season). Effective strategies, like adjusting minimum stays or offering promotions, can boost occupancy during slower periods. Here's how different property tiers perform in Oundle:
- Best-in-class properties (Top 10%) achieve 79%+ occupancy, indicating high desirability and potentially optimized availability.
- Strong performing properties (Top 25%) maintain 66% or higher occupancy, suggesting good market fit and guest satisfaction.
- Typical properties (Median) have an occupancy rate around 43%.
- Entry-level properties (Bottom 25%) average 22% occupancy, potentially facing higher vacancy.
Average Monthly Occupancy Rate Trend in Oundle
Average Daily Rate (ADR) Airbnb Trends in Oundle (2025)
Effective short term rental pricing strategy in Oundle involves understanding monthly ADR fluctuations. The Average Daily Rate (ADR) for Airbnb in Oundle typically peaks in July and dips lowest during October. Leveraging Airbnb dynamic pricing tools or strategies based on this seasonality can significantly boost revenue. Here's a look at the typical nightly rates achieved:
- Best-in-class properties (Top 10%) command rates of $256+ per night, often due to premium features or locations.
- Strong performing properties (Top 25%) achieve nightly rates of $218 or more.
- Typical properties (Median) charge around $135 per night.
- Entry-level properties (Bottom 25%) earn around $98 per night.
Average Daily Rate (ADR) Trend by Month in Oundle
Get Live Oundle Market Intelligence 👇

Explore Real-time Analytics
Airbnb Seasonality Analysis & Trends in Oundle (2025)
Peak Season (July, April, March)
- Revenue averages $2,648 per month
- Occupancy rates average 50.8%
- Daily rates average $162
Shoulder Season
- Revenue averages $2,157 per month
- Occupancy maintains around 43.4%
- Daily rates hold near $159
Low Season (January, February, October)
- Revenue drops to average $1,972 per month
- Occupancy decreases to average 43.5%
- Daily rates adjust to average $155
Seasonality Insights for Oundle
- The Airbnb seasonality in Oundle shows moderate seasonality with distinct peak and low periods. While the sections above show seasonal averages, it's also insightful to look at the extremes:
- During the high season, the absolute peak month showcases Oundle's highest earning potential, with monthly revenues capable of climbing to $3,106, occupancy reaching a high of 55.6%, and ADRs peaking at $176.
- Conversely, the slowest single month of the year, typically falling within the low season, marks the market's lowest point. In this month, revenue might dip to $1,874, occupancy could drop to 35.3%, and ADRs may adjust down to $153.
- Understanding both the seasonal averages and these monthly peaks and troughs in revenue, occupancy, and ADR is crucial for maximizing your Airbnb profit potential in Oundle.
Seasonal Strategies for Maximizing Profit
- Peak Season: Maximize revenue through premium pricing and potentially longer minimum stays. Ensure high availability.
- Low Season: Offer competitive pricing, special promotions (e.g., extended stay discounts), and flexible cancellation policies. Target off-season travelers like remote workers or budget-conscious guests.
- Shoulder Seasons: Implement dynamic pricing that balances peak and low rates. Target weekend travelers or specific events. Offer slightly more flexible terms than peak season.
- Regularly analyze your own performance against these Oundle seasonality benchmarks and adjust your pricing and availability strategy accordingly.
Best Areas for Airbnb Investment in Oundle (2025)
Exploring the top neighborhoods for short-term rentals in Oundle? This section highlights key areas, outlining why they are attractive for hosts and guests, along with notable local attractions. Consider these locations based on your target guest profile and investment strategy.
| Neighborhood / Area | Why Host Here? (Target Guests & Appeal) | Key Attractions & Landmarks |
|---|---|---|
| Oundle Town Centre | The heart of Oundle with charming streets and historical buildings, Oundle Town Centre attracts visitors interested in local culture, restaurants, and boutique shopping. | Oundle Market Place, Oundle Museum, St. Peter's Church, Gretton Brook, Oundle Wharf |
| Fotheringhay | A historic village just a few miles from Oundle, famous for its relation to Richard III and its scenic riverside views. Ideal for history enthusiasts and nature lovers. | Fotheringhay Castle, St. Mary and All Saints Church, River Nene, Fotheringhay Village, historic walking trails |
| Barnwell Country Park | A picturesque park situated just outside Oundle, ideal for families and nature lovers. The park offers beautiful walking paths, lakes, and picnic areas. | Barnwell Country Park lake, woodland walks, playgrounds, birdwatching, fishing spots |
| Thrapston | A nearby town with a vibrant market and good transport links to Oundle. Popular for visitors looking for a larger town experience close to Oundle. | Thrapston Market, St. Nicholas Church, Nene Park, Thrapston Marina, local shops and pubs |
| Marholm | A scenic village near Oundle known for its rural charm and tranquil atmosphere. Great for those seeking a peaceful getaway. | Marholm village green, nature walks, quiet pubs, local farms, historic buildings |
| Wadenhoe | A quaint village with beautiful natural surroundings and a rich history. Attracts visitors interested in hiking and local culture. | St. Michael's Church, River Nene, Wadenhoe Wood, hiking trails, local events |
| Glapthorne | A small village near Oundle, appealing to guests looking for a quiet retreat with access to the countryside and local farms. | Glapthorne Road, countryside walks, small local events, community spirit, nearby farms |
| Oundle Mill | A unique location in a converted mill, offering a distinctive experience for guests. Ideal for romantic getaways or special occasions. | Oundle Mill restaurant, River Nene views, historic mill structure, nature trails, local produce events |
Understanding Airbnb License Requirements & STR Laws in Oundle (2025)
While Oundle, England, United Kingdom currently shows low STR regulations, specific Airbnb license requirements might still exist or change. Always verify the latest short term rental regulations and Airbnb license requirements directly with local government authorities for Oundle to ensure full compliance before hosting.
(Source: AirROI data, 2025, finding no licensed listings among those analyzed)
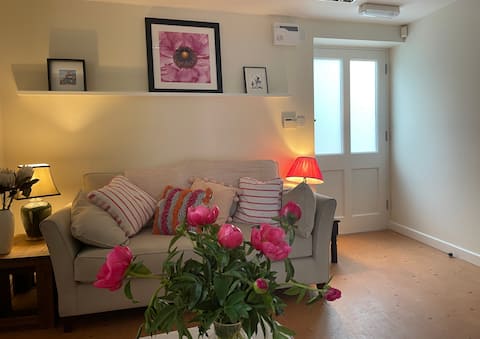
Top Performing Airbnb Properties in Oundle (2025)
Benchmark your potential! Explore examples of top-performing Airbnb properties in Oundlebased on Trailing Twelve Month (TTM) revenue. Analyze their characteristics, revenue, occupancy rate, and ADR to understand what drives success in this market.
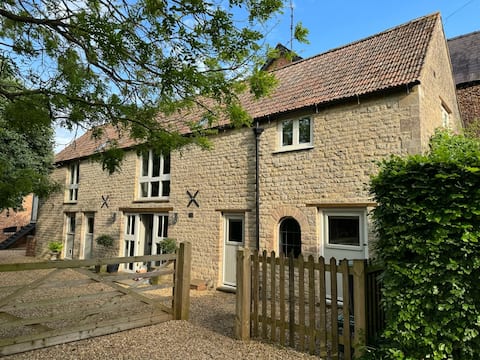
Oak Barn
Entire Place • 3 bedrooms
Manor House, Oundle
Entire Place • 2 bedrooms
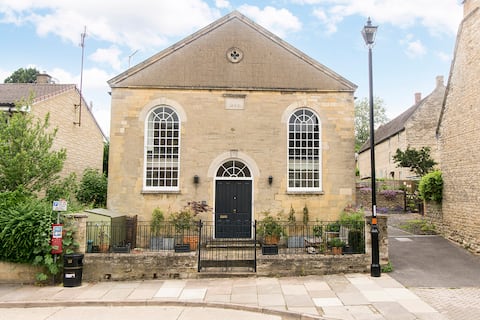
3 bedroom converted chapel in historic Oundle
Entire Place • 3 bedrooms
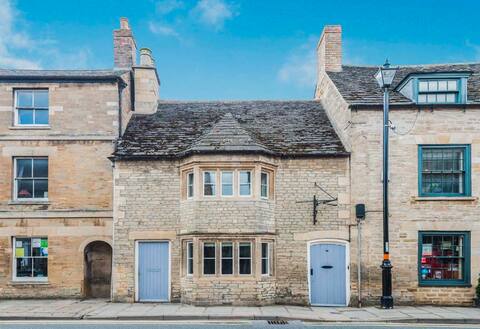
Teddy Cottage
Entire Place • 2 bedrooms
Lovely listed cottage in old centre with garden.
Entire Place • 2 bedrooms
The Locke Inn - at the heart of historic Oundle.
Entire Place • 1 bedroom
Note: Performance varies based on location, size, amenities, seasonality, and management quality. Data reflects the past 12 months.
Top Performing Airbnb Hosts in Oundle (2025)
Learn from the best! This table showcases top-performing Airbnb hosts in Oundle based on the number of properties managed and estimated total revenue over the past year. Analyze their scale and performance metrics.
| Host Name | Properties | Grossing Revenue | Stay Reviews | Avg Rating |
|---|---|---|---|---|
| Corin James Stuart | 3 | $73,473 | 125 | 4.73/5.0 |
| Timothy | 1 | $71,646 | 21 | 5.00/5.0 |
| Emma | 1 | $45,778 | 212 | 4.93/5.0 |
| Kate | 1 | $32,768 | 28 | 4.93/5.0 |
| Penny | 2 | $31,404 | 8 | 5.00/5.0 |
| Katrien | 1 | $25,718 | 197 | 4.87/5.0 |
| Christina | 1 | $20,199 | 128 | 4.86/5.0 |
| Alexandra | 2 | $19,435 | 8 | 5.00/5.0 |
| Gareth | 1 | $18,291 | 22 | 5.00/5.0 |
| Caroline | 1 | $17,196 | 56 | 4.91/5.0 |
Analyzing the strategies of top hosts, such as their property selection, pricing, and guest communication, can offer valuable lessons for optimizing your own Airbnb operations in Oundle.
Dive Deeper: Advanced Oundle STR Market Data (2025)
Ready to unlock more insights? AirROI provides access to advanced metrics and comprehensive Airbnb data for Oundle. Explore detailed analytics beyond this report to refine your investment strategy, optimize pricing, and maximize your vacation rental profits.
Explore Advanced MetricsOundle Short-Term Rental Market Composition (2025): Property & Room Types
Room Type Distribution
Property Type Distribution
Market Composition Insights for Oundle
- The Oundle Airbnb market composition is heavily skewed towards Entire Home/Apt listings, which make up 88.9% of the 18 active rentals. This indicates strong guest preference for privacy and space.
- Looking at the property type distribution in Oundle, House properties are the most common (55.6%), reflecting the local real estate landscape.
- Houses represent a significant 55.6% portion, catering likely to families or larger groups.
- The presence of 5.6% Hotel/Boutique listings indicates integration with traditional hospitality.
Oundle Airbnb Room Capacity Analysis (2025): Bedroom Distribution
Distribution of Listings by Number of Bedrooms
Room Capacity Insights for Oundle
- The dominant room capacity in Oundle is 1 bedroom listings, making up 44.4% of the market. This suggests a strong demand for properties suitable for couples or solo travelers.
- Together, 1 bedroom and 2 bedrooms properties represent 66.6% of the active Airbnb listings in Oundle, indicating a high concentration in these sizes.
Oundle Vacation Rental Guest Capacity Trends (2025)
Distribution of Listings by Guest Capacity
Guest Capacity Insights for Oundle
- The most common guest capacity trend in Oundle vacation rentals is listings accommodating 2 guests (33.3%). This suggests the primary traveler segment is likely couples or solo travelers.
- Properties designed for 2 guests and 4 guests dominate the Oundle STR market, accounting for 61.1% of listings.
- 11.1% of properties accommodate 6+ guests, serving the market segment for larger families or group travel in Oundle.
- On average, properties in Oundle are equipped to host 3.2 guests.
Oundle Airbnb Booking Patterns (2025): Available vs. Booked Days
Available Days Distribution
Booked Days Distribution
Booking Pattern Insights for Oundle
- The most common availability pattern in Oundle falls within the 271-366 days range, representing 38.9% of listings. This suggests many properties have significant open periods on their calendars.
- Approximately 72.2% of listings show high availability (181+ days open annually), indicating potential for increased bookings or specific owner usage patterns.
- For booked days, the 91-180 days range is most frequent in Oundle (33.3%), reflecting common guest stay durations or potential owner blocking patterns.
- A notable 27.8% of properties secure long booking periods (181+ days booked per year), highlighting successful long-term rental strategies or significant owner usage.
Oundle Airbnb Minimum Stay Requirements Analysis
Distribution of Listings by Minimum Night Requirement
1 Night
10 listings
55.6% of total
2 Nights
4 listings
22.2% of total
3 Nights
1 listings
5.6% of total
30+ Nights
3 listings
16.7% of total
Key Insights
- The most prevalent minimum stay requirement in Oundle is 1 Night, adopted by 55.6% of listings. This highlights the market's preference for shorter, flexible bookings.
- A strong majority (77.8%) of the Oundle Airbnb data shows acceptance of very short stays (1-2 nights), indicating a dynamic, high-turnover market.
- A significant segment (16.7%) caters to monthly stays (30+ nights) in Oundle, pointing to opportunities in the extended-stay market.
Recommendations
- Align with the market by considering a 1 Night minimum stay, as 55.6% of Oundle hosts use this setting.
- Explore offering discounts for stays of 30+ nights to attract the 16.7% of the market seeking extended stays.
- Adjust minimum nights based on seasonality – potentially shorter during low season and longer during peak demand periods in Oundle.
Oundle Airbnb Cancellation Policy Trends Analysis (2025)
Flexible
6 listings
35.3% of total
Moderate
6 listings
35.3% of total
Firm
1 listings
5.9% of total
Strict
4 listings
23.5% of total
Cancellation Policy Insights for Oundle
- The prevailing Airbnb cancellation policy trend in Oundle is Flexible, used by 35.3% of listings.
- The market strongly favors guest-friendly terms, with 70.6% of listings offering Flexible or Moderate policies. This suggests guests in Oundle may expect booking flexibility.
Recommendations for Hosts
- Consider adopting a Flexible policy to align with the 35.3% market standard in Oundle.
- Regularly review your cancellation policy against competitors and market demand shifts in Oundle.
Oundle STR Booking Lead Time Analysis (2025)
Average Booking Lead Time by Month
Booking Lead Time Insights for Oundle
- The overall average booking lead time for vacation rentals in Oundle is 62 days.
- Guests book furthest in advance for stays during June (average 118 days), likely coinciding with peak travel demand or local events.
- The shortest booking windows occur for stays in October (average 29 days), indicating more last-minute travel plans during this time.
- Seasonally, Summer (88 days avg.) sees the longest lead times, while Fall (34 days avg.) has the shortest, reflecting typical travel planning cycles.
Recommendations for Hosts
- Use the overall average lead time (62 days) as a baseline for your pricing and availability strategy in Oundle.
- For June stays, consider implementing length-of-stay discounts or slightly higher rates for bookings made less than 118 days out to capitalize on advance planning.
- Target marketing efforts for the Summer season well in advance (at least 88 days) to capture early planners.
- Monitor your own booking lead times against these Oundle averages to identify opportunities for dynamic pricing adjustments.
Popular & Essential Airbnb Amenities in Oundle (2025)
Amenity Prevalence
Amenity Insights for Oundle
- Essential amenities in Oundle that guests expect include: Smoke alarm. Lacking these (this) could significantly impact bookings.
- Popular amenities like Wifi, TV, Carbon monoxide alarm are common but not universal. Offering these can provide a competitive edge.
- Warning: Wifi is not universally provided but is considered essential globally. Ensure reliable Wifi is offered.
Recommendations for Hosts
- Ensure your listing includes all essential amenities for Oundle: Smoke alarm.
- Consider adding popular differentiators like Wifi or TV to increase appeal.
- Highlight unique or less common amenities you offer (e.g., hot tub, dedicated workspace, EV charger) in your listing description and photos.
- Regularly check competitor amenities in Oundle to stay competitive.
Oundle Airbnb Guest Demographics & Profile Analysis (2025)
Guest Profile Summary for Oundle
- The typical guest profile for Airbnb in Oundle consists of primarily domestic travelers (85%), often arriving from nearby England, typically belonging to the Post-2000s (Gen Z/Alpha) group (50%), primarily speaking English or French.
- Domestic travelers account for 84.7% of guests.
- Key international markets include United Kingdom (84.7%) and Australia (4.2%).
- Top languages spoken are English (52.2%) followed by French (14.1%).
- A significant demographic segment is the Post-2000s (Gen Z/Alpha) group, representing 50% of guests.
Recommendations for Hosts
- Target domestic marketing efforts towards travelers from England and London.
- Tailor amenities and listing descriptions to appeal to the dominant Post-2000s (Gen Z/Alpha) demographic (e.g., highlight fast WiFi, smart home features, local guides).
- Highlight unique local experiences or amenities relevant to the primary guest profile.
- Consider seasonal promotions aligned with peak travel times for key origin markets.
Nearby Short-Term Rental Market Comparison
How does the Oundle Airbnb market stack up against its neighbors? Compare key performance metrics like average monthly revenue, ADR, and occupancy rates in surrounding areas to understand the broader regional STR landscape.
| Market | Active Properties | Monthly Revenue | Daily Rate | Avg. Occupancy |
|---|---|---|---|---|
| Dorney | 12 | $7,352 | $676.21 | 40% |
| Lambourn | 11 | $5,988 | $723.34 | 29% |
| City of Westminster | 1,643 | $5,587 | $488.73 | 50% |
| Appleby | 10 | $4,842 | $363.95 | 44% |
| Alderbury | 21 | $4,465 | $345.99 | 42% |
| Stamford Bridge | 12 | $4,414 | $397.56 | 37% |
| Wraysbury | 18 | $4,402 | $410.07 | 47% |
| Dinton | 12 | $4,359 | $243.46 | 57% |
| Kintbury | 11 | $4,349 | $242.43 | 52% |
| Bourne End | 11 | $4,229 | $434.54 | 42% |