Nuneaton and Bedworth Airbnb Market Analysis 2025: Short Term Rental Data & Vacation Rental Statistics in England, United Kingdom
Is Airbnb profitable in Nuneaton and Bedworth in 2025? Explore comprehensive Airbnb analytics for Nuneaton and Bedworth, England, United Kingdom to uncover income potential. This 2025 STR market report for Nuneaton and Bedworth, based on AirROI data from April 2024 to March 2025, reveals key trends in the niche market of 38 active listings.
Whether you're considering an Airbnb investment in Nuneaton and Bedworth, optimizing your existing vacation rental, or exploring rental arbitrage opportunities, understanding the Nuneaton and Bedworth Airbnb data is crucial. Leveraging the low regulation environment is key to maximizing your short term rental income potential. Let's dive into the specifics.
Key Nuneaton and Bedworth Airbnb Performance Metrics Overview
Monthly Airbnb Revenue Variations & Income Potential in Nuneaton and Bedworth (2025)
Understanding the monthly revenue variations for Airbnb listings in Nuneaton and Bedworth is key to maximizing your short term rental income potential. Seasonality significantly impacts earnings. Our analysis, based on data from the past 12 months, shows that the peak revenue month for STRs in Nuneaton and Bedworth is typically June, while January often presents the lowest earnings, highlighting opportunities for strategic pricing adjustments during shoulder and low seasons. Explore the typical Airbnb income in Nuneaton and Bedworth across different performance tiers:
- Best-in-class properties (Top 10%) achieve $3,460+ monthly, often utilizing dynamic pricing and superior guest experiences.
- Strong performing properties (Top 25%) earn $2,402 or more, indicating effective management and desirable locations/amenities.
- Typical properties (Median) generate around $1,166 per month, representing the average market performance.
- Entry-level properties (Bottom 25%) see earnings around $650, often with potential for optimization.
Average Monthly Airbnb Earnings Trend in Nuneaton and Bedworth
Nuneaton and Bedworth Airbnb Occupancy Rate Trends (2025)
Maximize your bookings by understanding the Nuneaton and Bedworth STR occupancy trends. Seasonal demand shifts significantly influence how often properties are booked. Typically, Septembersees the highest demand (peak season occupancy), while May experiences the lowest (low season). Effective strategies, like adjusting minimum stays or offering promotions, can boost occupancy during slower periods. Here's how different property tiers perform in Nuneaton and Bedworth:
- Best-in-class properties (Top 10%) achieve 80%+ occupancy, indicating high desirability and potentially optimized availability.
- Strong performing properties (Top 25%) maintain 61% or higher occupancy, suggesting good market fit and guest satisfaction.
- Typical properties (Median) have an occupancy rate around 44%.
- Entry-level properties (Bottom 25%) average 24% occupancy, potentially facing higher vacancy.
Average Monthly Occupancy Rate Trend in Nuneaton and Bedworth
Average Daily Rate (ADR) Airbnb Trends in Nuneaton and Bedworth (2025)
Effective short term rental pricing strategy in Nuneaton and Bedworth involves understanding monthly ADR fluctuations. The Average Daily Rate (ADR) for Airbnb in Nuneaton and Bedworth typically peaks in November and dips lowest during April. Leveraging Airbnb dynamic pricing tools or strategies based on this seasonality can significantly boost revenue. Here's a look at the typical nightly rates achieved:
- Best-in-class properties (Top 10%) command rates of $184+ per night, often due to premium features or locations.
- Strong performing properties (Top 25%) achieve nightly rates of $135 or more.
- Typical properties (Median) charge around $69 per night.
- Entry-level properties (Bottom 25%) earn around $46 per night.
Average Daily Rate (ADR) Trend by Month in Nuneaton and Bedworth
Get Live Nuneaton and Bedworth Market Intelligence 👇

Explore Real-time Analytics
Airbnb Seasonality Analysis & Trends in Nuneaton and Bedworth (2025)
Peak Season (June, May, August)
- Revenue averages $2,357 per month
- Occupancy rates average 43.2%
- Daily rates average $103
Shoulder Season
- Revenue averages $1,734 per month
- Occupancy maintains around 48.6%
- Daily rates hold near $112
Low Season (January, February, March)
- Revenue drops to average $1,161 per month
- Occupancy decreases to average 37.6%
- Daily rates adjust to average $110
Seasonality Insights for Nuneaton and Bedworth
- The Airbnb seasonality in Nuneaton and Bedworth shows highly seasonal trends requiring careful strategy. While the sections above show seasonal averages, it's also insightful to look at the extremes:
- During the high season, the absolute peak month showcases Nuneaton and Bedworth's highest earning potential, with monthly revenues capable of climbing to $2,845, occupancy reaching a high of 55.9%, and ADRs peaking at $131.
- Conversely, the slowest single month of the year, typically falling within the low season, marks the market's lowest point. In this month, revenue might dip to $991, occupancy could drop to 26.8%, and ADRs may adjust down to $102.
- Understanding both the seasonal averages and these monthly peaks and troughs in revenue, occupancy, and ADR is crucial for maximizing your Airbnb profit potential in Nuneaton and Bedworth.
Seasonal Strategies for Maximizing Profit
- Peak Season: Maximize revenue through premium pricing and potentially longer minimum stays. Ensure high availability.
- Low Season: Offer competitive pricing, special promotions (e.g., extended stay discounts), and flexible cancellation policies. Target off-season travelers like remote workers or budget-conscious guests.
- Shoulder Seasons: Implement dynamic pricing that balances peak and low rates. Target weekend travelers or specific events. Offer slightly more flexible terms than peak season.
- Regularly analyze your own performance against these Nuneaton and Bedworth seasonality benchmarks and adjust your pricing and availability strategy accordingly.
Best Areas for Airbnb Investment in Nuneaton and Bedworth (2025)
Exploring the top neighborhoods for short-term rentals in Nuneaton and Bedworth? This section highlights key areas, outlining why they are attractive for hosts and guests, along with notable local attractions. Consider these locations based on your target guest profile and investment strategy.
| Neighborhood / Area | Why Host Here? (Target Guests & Appeal) | Key Attractions & Landmarks |
|---|---|---|
| Nuneaton Town Centre | The bustling heart of Nuneaton offering a mix of shopping, dining, and entertainment options. A key location for travelers visiting the area for work or leisure, with easy transport links to other regions. | Nuneaton Museum and Art Gallery, Abbey Fields, The Ropewalk Shopping Centre, Nuneaton and Bedworth Museum, Queen's Road, Bedworth Civic Hall |
| Bedworth | A charming market town with a rich history, Bedworth offers a range of local amenities and is close to nature reserves, making it appealing to families and leisure travelers. | Miners Welfare Park, Bedworth Civic Hall, The Pretty Pigs, Bedworth Heritage Centre, Graze and Co, The Bermuda Park |
| Atherstone | A quaint town with historic architecture and local shops, Atherstone is attracting visitors looking for a peaceful retreat while still being in proximity to larger towns. | Atherstone Heritage Centre, St. Mary's Church, The Atherstone Arcade, Sence Valley Forest Park, The Plough Inn, Hartshill Hayes Country Park |
| Hartshill | A vibrant suburb known for its community feel and accessibility to local attractions. Appeals to those seeking a homey experience close to larger urban areas. | Hartshill Hayes Country Park, Hartshill Sports Centre, local cafes and shops, Church of St. John the Divine, Hartshill Golf Club |
| Attleborough | A residential area that provides a more relaxed atmosphere, suitable for travelers who prefer a quieter stay with access to park areas and local dining options. | Whitestone Recreation Ground, Attleborough Park, local eateries and pubs, St. George's Church, The New Bewerley |
| Bulkington | A small village with a strong community spirit, Bulkington provides visitors with a quaint English experience while being a short drive from attractions in Nuneaton and Bedworth. | Bulkington Community Centre, local parks, St. James' Church, The George and Dragon, Bulkington Village Centre |
| Bermuda Park | A newer commercial and residential development that is becoming popular among business travelers due to its modern amenities and proximity to the business district. | Bermuda Park Cinema, Bermuda Park Retail, restaurants and cafes, Bermuda Community Centre, local parks |
| Weddington | A residential area known for its neighborhood feel and local amenities, Weddington appeals to families and those looking for quiet residential stays with easy access to Nuneaton. | Weddington Park, Nuneaton Golf Club, local shops and schools, St. Paul’s Church, Nuneaton Town Centre |
Understanding Airbnb License Requirements & STR Laws in Nuneaton and Bedworth (2025)
While Nuneaton and Bedworth, England, United Kingdom currently shows low STR regulations, specific Airbnb license requirements might still exist or change. Always verify the latest short term rental regulations and Airbnb license requirements directly with local government authorities for Nuneaton and Bedworth to ensure full compliance before hosting.
(Source: AirROI data, 2025, finding no licensed listings among those analyzed)
Top Performing Airbnb Properties in Nuneaton and Bedworth (2025)
Benchmark your potential! Explore examples of top-performing Airbnb properties in Nuneaton and Bedworthbased on Trailing Twelve Month (TTM) revenue. Analyze their characteristics, revenue, occupancy rate, and ADR to understand what drives success in this market.
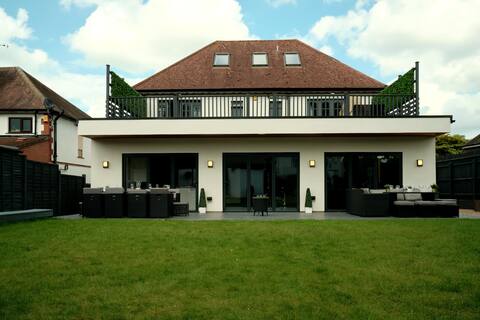
Spacious 6 bedroom home with outdoor dining area
Entire Place • 6 bedrooms

Modern 3BR House For Contractors/Professionals
Entire Place • 3 bedrooms
Avril Warwickshire Home Stay
Entire Place • 3 bedrooms

NEC, BHX Airport, M6, CBS Arena, Bedworth, CV120LY
Entire Place • 3 bedrooms
Newly refurbished 3 bedroom flat
Entire Place • 3 bedrooms

"The Shires" Entire refurbished 3 bed townhouse !
Entire Place • 3 bedrooms
Note: Performance varies based on location, size, amenities, seasonality, and management quality. Data reflects the past 12 months.
Top Performing Airbnb Hosts in Nuneaton and Bedworth (2025)
Learn from the best! This table showcases top-performing Airbnb hosts in Nuneaton and Bedworth based on the number of properties managed and estimated total revenue over the past year. Analyze their scale and performance metrics.
| Host Name | Properties | Grossing Revenue | Stay Reviews | Avg Rating |
|---|---|---|---|---|
| Lines | 1 | $73,721 | 52 | 4.63/5.0 |
| Linesh | 2 | $58,896 | 46 | 4.34/5.0 |
| Musthaq | 1 | $56,072 | 3 | 4.67/5.0 |
| Lois | 2 | $42,143 | 28 | 4.05/5.0 |
| Tongayi | 1 | $36,959 | 12 | 3.67/5.0 |
| James | 1 | $35,650 | 97 | 5.00/5.0 |
| Richard | 1 | $32,085 | 116 | 4.93/5.0 |
| Daniel | 1 | $30,412 | 29 | 4.90/5.0 |
| Chris | 1 | $27,901 | 33 | 4.39/5.0 |
| Mahmoud | 1 | $26,377 | 7 | 4.29/5.0 |
Analyzing the strategies of top hosts, such as their property selection, pricing, and guest communication, can offer valuable lessons for optimizing your own Airbnb operations in Nuneaton and Bedworth.
Dive Deeper: Advanced Nuneaton and Bedworth STR Market Data (2025)
Ready to unlock more insights? AirROI provides access to advanced metrics and comprehensive Airbnb data for Nuneaton and Bedworth. Explore detailed analytics beyond this report to refine your investment strategy, optimize pricing, and maximize your vacation rental profits.
Explore Advanced MetricsNuneaton and Bedworth Short-Term Rental Market Composition (2025): Property & Room Types
Room Type Distribution
Property Type Distribution
Market Composition Insights for Nuneaton and Bedworth
- The Nuneaton and Bedworth Airbnb market composition is heavily skewed towards Entire Home/Apt listings, which make up 60.5% of the 38 active rentals. This indicates strong guest preference for privacy and space.
- However, a notable 39.5% share for Private Rooms suggests opportunities for budget-conscious travelers or hosts renting out spare rooms.
- Looking at the property type distribution in Nuneaton and Bedworth, House properties are the most common (71.1%), reflecting the local real estate landscape.
- Houses represent a significant 71.1% portion, catering likely to families or larger groups.
- Smaller segments like others (combined 2.6%) offer potential for unique stay experiences.
Nuneaton and Bedworth Airbnb Room Capacity Analysis (2025): Bedroom Distribution
Distribution of Listings by Number of Bedrooms
Room Capacity Insights for Nuneaton and Bedworth
- The dominant room capacity in Nuneaton and Bedworth is 3 bedrooms listings, making up 31.6% of the market. This suggests a strong demand for properties suitable for families or small groups.
- Together, 3 bedrooms and 1 bedroom properties represent 50.0% of the active Airbnb listings in Nuneaton and Bedworth, indicating a high concentration in these sizes.
- A significant 39.5% of listings offer 3+ bedrooms, catering to larger groups and families seeking more space in Nuneaton and Bedworth.
Nuneaton and Bedworth Vacation Rental Guest Capacity Trends (2025)
Distribution of Listings by Guest Capacity
Guest Capacity Insights for Nuneaton and Bedworth
- The most common guest capacity trend in Nuneaton and Bedworth vacation rentals is listings accommodating 6 guests (13.2%). This suggests the primary traveler segment is likely larger groups.
- Properties designed for 6 guests and 7 guests dominate the Nuneaton and Bedworth STR market, accounting for 26.4% of listings.
- 31.7% of properties accommodate 6+ guests, serving the market segment for larger families or group travel in Nuneaton and Bedworth.
- On average, properties in Nuneaton and Bedworth are equipped to host 3.0 guests.
Nuneaton and Bedworth Airbnb Booking Patterns (2025): Available vs. Booked Days
Available Days Distribution
Booked Days Distribution
Booking Pattern Insights for Nuneaton and Bedworth
- The most common availability pattern in Nuneaton and Bedworth falls within the 91-180 days range, representing 42.1% of listings. This suggests many properties have significant open periods on their calendars.
- Approximately 52.6% of listings show high availability (181+ days open annually), indicating potential for increased bookings or specific owner usage patterns.
- For booked days, the 181-270 days range is most frequent in Nuneaton and Bedworth (44.7%), reflecting common guest stay durations or potential owner blocking patterns.
- A notable 50.0% of properties secure long booking periods (181+ days booked per year), highlighting successful long-term rental strategies or significant owner usage.
Nuneaton and Bedworth Airbnb Minimum Stay Requirements Analysis
Distribution of Listings by Minimum Night Requirement
1 Night
19 listings
50% of total
2 Nights
13 listings
34.2% of total
3 Nights
2 listings
5.3% of total
4-6 Nights
2 listings
5.3% of total
7-29 Nights
1 listings
2.6% of total
30+ Nights
1 listings
2.6% of total
Key Insights
- The most prevalent minimum stay requirement in Nuneaton and Bedworth is 1 Night, adopted by 50% of listings. This highlights the market's preference for shorter, flexible bookings.
- A strong majority (84.2%) of the Nuneaton and Bedworth Airbnb data shows acceptance of very short stays (1-2 nights), indicating a dynamic, high-turnover market.
- Dedicated monthly rentals (30+ nights) represent a small niche (2.6%), possibly an untapped area for hosts.
Recommendations
- Align with the market by considering a 1 Night minimum stay, as 50% of Nuneaton and Bedworth hosts use this setting.
- Adjust minimum nights based on seasonality – potentially shorter during low season and longer during peak demand periods in Nuneaton and Bedworth.
Nuneaton and Bedworth Airbnb Cancellation Policy Trends Analysis (2025)
Flexible
21 listings
60% of total
Moderate
4 listings
11.4% of total
Firm
2 listings
5.7% of total
Strict
8 listings
22.9% of total
Cancellation Policy Insights for Nuneaton and Bedworth
- The prevailing Airbnb cancellation policy trend in Nuneaton and Bedworth is Flexible, used by 60% of listings.
- The market strongly favors guest-friendly terms, with 71.4% of listings offering Flexible or Moderate policies. This suggests guests in Nuneaton and Bedworth may expect booking flexibility.
Recommendations for Hosts
- Consider adopting a Flexible policy to align with the 60% market standard in Nuneaton and Bedworth.
- Given the high prevalence of Flexible policies (60%), offering this can enhance booking appeal, especially during shoulder seasons.
- Regularly review your cancellation policy against competitors and market demand shifts in Nuneaton and Bedworth.
Nuneaton and Bedworth STR Booking Lead Time Analysis (2025)
Average Booking Lead Time by Month
Booking Lead Time Insights for Nuneaton and Bedworth
- The overall average booking lead time for vacation rentals in Nuneaton and Bedworth is 41 days.
- Guests book furthest in advance for stays during May (average 77 days), likely coinciding with peak travel demand or local events.
- The shortest booking windows occur for stays in December (average 35 days), indicating more last-minute travel plans during this time.
- Seasonally, Spring (55 days avg.) sees the longest lead times, while Winter (40 days avg.) has the shortest, reflecting typical travel planning cycles.
Recommendations for Hosts
- Use the overall average lead time (41 days) as a baseline for your pricing and availability strategy in Nuneaton and Bedworth.
- For May stays, consider implementing length-of-stay discounts or slightly higher rates for bookings made less than 77 days out to capitalize on advance planning.
- Target marketing efforts for the Spring season well in advance (at least 55 days) to capture early planners.
- Monitor your own booking lead times against these Nuneaton and Bedworth averages to identify opportunities for dynamic pricing adjustments.
Popular & Essential Airbnb Amenities in Nuneaton and Bedworth (2025)
Amenity Prevalence
Amenity Insights for Nuneaton and Bedworth
- Essential amenities in Nuneaton and Bedworth that guests expect include: Smoke alarm, TV, Wifi, Heating. Lacking these (any) could significantly impact bookings.
- Popular amenities like Hot water, Carbon monoxide alarm, Kitchen are common but not universal. Offering these can provide a competitive edge.
Recommendations for Hosts
- Ensure your listing includes all essential amenities for Nuneaton and Bedworth: Smoke alarm, TV, Wifi, Heating.
- Prioritize adding missing essentials: TV, Wifi, Heating.
- Consider adding popular differentiators like Hot water or Carbon monoxide alarm to increase appeal.
- Highlight unique or less common amenities you offer (e.g., hot tub, dedicated workspace, EV charger) in your listing description and photos.
- Regularly check competitor amenities in Nuneaton and Bedworth to stay competitive.
Nuneaton and Bedworth Airbnb Guest Demographics & Profile Analysis (2025)
Guest Profile Summary for Nuneaton and Bedworth
- The typical guest profile for Airbnb in Nuneaton and Bedworth consists of primarily domestic travelers (86%), often arriving from nearby England, typically belonging to the Post-2000s (Gen Z/Alpha) group (50%), primarily speaking English or French.
- Domestic travelers account for 86.4% of guests.
- Key international markets include United Kingdom (86.4%) and United States (3.4%).
- Top languages spoken are English (67%) followed by French (6.7%).
- A significant demographic segment is the Post-2000s (Gen Z/Alpha) group, representing 50% of guests.
Recommendations for Hosts
- Target domestic marketing efforts towards travelers from England and London.
- Tailor amenities and listing descriptions to appeal to the dominant Post-2000s (Gen Z/Alpha) demographic (e.g., highlight fast WiFi, smart home features, local guides).
- Highlight unique local experiences or amenities relevant to the primary guest profile.
- Consider seasonal promotions aligned with peak travel times for key origin markets.
Nearby Short-Term Rental Market Comparison
How does the Nuneaton and Bedworth Airbnb market stack up against its neighbors? Compare key performance metrics like average monthly revenue, ADR, and occupancy rates in surrounding areas to understand the broader regional STR landscape.
| Market | Active Properties | Monthly Revenue | Daily Rate | Avg. Occupancy |
|---|---|---|---|---|
| Englishcombe | 13 | $8,558 | $573.69 | 49% |
| Dorney | 12 | $8,335 | $622.48 | 45% |
| Chew Magna | 14 | $6,649 | $399.59 | 46% |
| Lambourn | 11 | $6,081 | $669.47 | 28% |
| City of Westminster | 1,327 | $6,043 | $486.66 | 52% |
| Long Sutton | 17 | $5,726 | $383.88 | 46% |
| Stoke St. Michael | 10 | $5,277 | $424.04 | 42% |
| Oldland Common | 13 | $5,093 | $355.47 | 43% |
| Wraysbury | 14 | $4,719 | $396.18 | 46% |
| Stamford Bridge | 11 | $4,669 | $410.14 | 38% |