Northwood Airbnb Market Analysis 2025: Short Term Rental Data & Vacation Rental Statistics in England, United Kingdom
Is Airbnb profitable in Northwood in 2025? Explore comprehensive Airbnb analytics for Northwood, England, United Kingdom to uncover income potential. This 2025 STR market report for Northwood, based on AirROI data from April 2024 to March 2025, reveals key trends in the niche market of 23 active listings.
Whether you're considering an Airbnb investment in Northwood, optimizing your existing vacation rental, or exploring rental arbitrage opportunities, understanding the Northwood Airbnb data is crucial. Leveraging the low regulation environment is key to maximizing your short term rental income potential. Let's dive into the specifics.
Key Northwood Airbnb Performance Metrics Overview
Monthly Airbnb Revenue Variations & Income Potential in Northwood (2025)
Understanding the monthly revenue variations for Airbnb listings in Northwood is key to maximizing your short term rental income potential. Seasonality significantly impacts earnings. Our analysis, based on data from the past 12 months, shows that the peak revenue month for STRs in Northwood is typically August, while February often presents the lowest earnings, highlighting opportunities for strategic pricing adjustments during shoulder and low seasons. Explore the typical Airbnb income in Northwood across different performance tiers:
- Best-in-class properties (Top 10%) achieve $4,780+ monthly, often utilizing dynamic pricing and superior guest experiences.
- Strong performing properties (Top 25%) earn $2,432 or more, indicating effective management and desirable locations/amenities.
- Typical properties (Median) generate around $1,297 per month, representing the average market performance.
- Entry-level properties (Bottom 25%) see earnings around $702, often with potential for optimization.
Average Monthly Airbnb Earnings Trend in Northwood
Northwood Airbnb Occupancy Rate Trends (2025)
Maximize your bookings by understanding the Northwood STR occupancy trends. Seasonal demand shifts significantly influence how often properties are booked. Typically, Julysees the highest demand (peak season occupancy), while February experiences the lowest (low season). Effective strategies, like adjusting minimum stays or offering promotions, can boost occupancy during slower periods. Here's how different property tiers perform in Northwood:
- Best-in-class properties (Top 10%) achieve 71%+ occupancy, indicating high desirability and potentially optimized availability.
- Strong performing properties (Top 25%) maintain 44% or higher occupancy, suggesting good market fit and guest satisfaction.
- Typical properties (Median) have an occupancy rate around 24%.
- Entry-level properties (Bottom 25%) average 11% occupancy, potentially facing higher vacancy.
Average Monthly Occupancy Rate Trend in Northwood
Average Daily Rate (ADR) Airbnb Trends in Northwood (2025)
Effective short term rental pricing strategy in Northwood involves understanding monthly ADR fluctuations. The Average Daily Rate (ADR) for Airbnb in Northwood typically peaks in July and dips lowest during March. Leveraging Airbnb dynamic pricing tools or strategies based on this seasonality can significantly boost revenue. Here's a look at the typical nightly rates achieved:
- Best-in-class properties (Top 10%) command rates of $390+ per night, often due to premium features or locations.
- Strong performing properties (Top 25%) achieve nightly rates of $284 or more.
- Typical properties (Median) charge around $204 per night.
- Entry-level properties (Bottom 25%) earn around $164 per night.
Average Daily Rate (ADR) Trend by Month in Northwood
Get Live Northwood Market Intelligence 👇

Explore Real-time Analytics
Airbnb Seasonality Analysis & Trends in Northwood (2025)
Peak Season (August, July, June)
- Revenue averages $3,107 per month
- Occupancy rates average 45.4%
- Daily rates average $278
Shoulder Season
- Revenue averages $2,086 per month
- Occupancy maintains around 28.3%
- Daily rates hold near $247
Low Season (January, February, March)
- Revenue drops to average $915 per month
- Occupancy decreases to average 23.4%
- Daily rates adjust to average $205
Seasonality Insights for Northwood
- The Airbnb seasonality in Northwood shows highly seasonal trends requiring careful strategy. While the sections above show seasonal averages, it's also insightful to look at the extremes:
- During the high season, the absolute peak month showcases Northwood's highest earning potential, with monthly revenues capable of climbing to $3,364, occupancy reaching a high of 51.5%, and ADRs peaking at $282.
- Conversely, the slowest single month of the year, typically falling within the low season, marks the market's lowest point. In this month, revenue might dip to $703, occupancy could drop to 16.6%, and ADRs may adjust down to $203.
- Understanding both the seasonal averages and these monthly peaks and troughs in revenue, occupancy, and ADR is crucial for maximizing your Airbnb profit potential in Northwood.
Seasonal Strategies for Maximizing Profit
- Peak Season: Maximize revenue through premium pricing and potentially longer minimum stays. Ensure high availability.
- Low Season: Offer competitive pricing, special promotions (e.g., extended stay discounts), and flexible cancellation policies. Target off-season travelers like remote workers or budget-conscious guests.
- Shoulder Seasons: Implement dynamic pricing that balances peak and low rates. Target weekend travelers or specific events. Offer slightly more flexible terms than peak season.
- Regularly analyze your own performance against these Northwood seasonality benchmarks and adjust your pricing and availability strategy accordingly.
Best Areas for Airbnb Investment in Northwood (2025)
Exploring the top neighborhoods for short-term rentals in Northwood? This section highlights key areas, outlining why they are attractive for hosts and guests, along with notable local attractions. Consider these locations based on your target guest profile and investment strategy.
| Neighborhood / Area | Why Host Here? (Target Guests & Appeal) | Key Attractions & Landmarks |
|---|---|---|
| Northwood Hills | Known for its beautiful suburban environment and access to Northwood Hills tube station, making it a convenient location for visitors commuting to Central London. Ideal for families and business travelers seeking tranquility away from the city's hustle. | Northwood Hills Park, Northwood Golf Club, The Old Mill, Harrow-on-the-Hill, Ruislip Woods National Nature Reserve |
| Rickmansworth | Charming small town with a picturesque canal and quaint shops, favored by tourists looking for a peaceful retreat with local character. Home to beautiful parks and nature walks, perfect for outdoor enthusiasts. | Aquadrome, Rickmansworth Waterways Trust, Horsey Mere, Crown Farm, The Swillett Nature Reserve |
| Eastcote | A family-friendly suburb with a variety of local amenities, parks, and schools. Close to the Metropolitan line and offers easy access to London, making it suitable for both leisure and business stays. | Eastcote House Gardens, Cranleigh Gardens, The Case is Altered Pub, Eastcote Village |
| Pinner | Historic market town known for its charming high street and traditional culture. Attracts visitors looking for a slice of English history, complete with beautiful architecture and local markets. | Pinner Memorial Park, Pinner Village Gardens, Pinner Hill Golf Club, The Manor House, St. John's Church |
| Harefield | A lovely village surrounded by stunning countryside and several scenic walking trails. Ideal for guests looking to escape urban life while being only a short drive from major cities. | Harefield Common, Harefield Place, Riverside Park, Grand Union Canal |
| Ruislip | A vibrant town with a rich history, parks, and good transport links to London. Suitable for guests who desire urban amenities along with green spaces and recreational activities. | Ruislip Lido, Ruislip Woods, Manor Farm, High Street shops and restaurants |
| Northwood | An affluent area with beautiful homes and good schools, making it appealing to families. Close to amenities and parks, perfect for travelers seeking comfort and convenience. | Northwood Cemetery, Parks and green spaces, Local cafes and restaurants, Nearby golf courses |
| Watford | A lively town center with shopping, dining, and entertainment options, attractive to travelers looking for urban experiences along with easy access to London attractions. | Watford Colosseum, Cassiobury Park, Intu Watford Shopping Centre, Watford Museum |
Understanding Airbnb License Requirements & STR Laws in Northwood (2025)
While Northwood, England, United Kingdom currently shows low STR regulations, specific Airbnb license requirements might still exist or change. Always verify the latest short term rental regulations and Airbnb license requirements directly with local government authorities for Northwood to ensure full compliance before hosting.
(Source: AirROI data, 2025, finding no licensed listings among those analyzed)
Top Performing Airbnb Properties in Northwood (2025)
Benchmark your potential! Explore examples of top-performing Airbnb properties in Northwoodbased on Trailing Twelve Month (TTM) revenue. Analyze their characteristics, revenue, occupancy rate, and ADR to understand what drives success in this market.
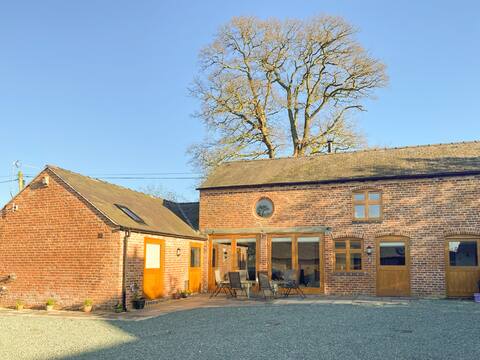
the Byre - uk41767
Entire Place • 3 bedrooms
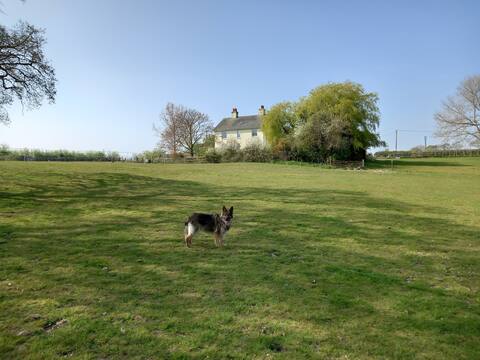
Spacious Farmhouse for family holidays. Cowes
Entire Place • 4 bedrooms
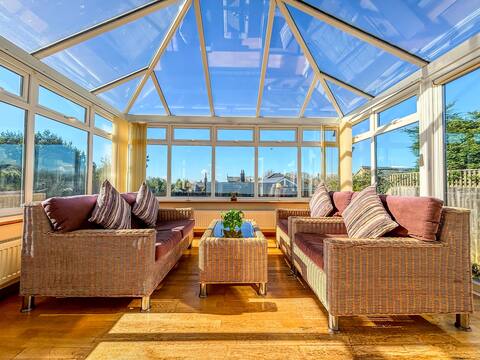
K&T's Wight Escape
Entire Place • 3 bedrooms
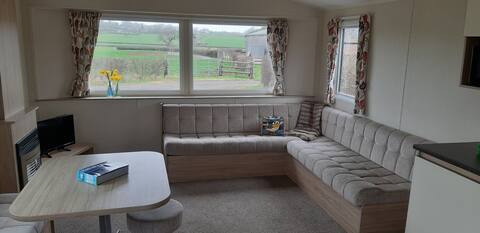
Mistral Static Caravan, Skinners Farm, Cowes
Entire Place • 3 bedrooms
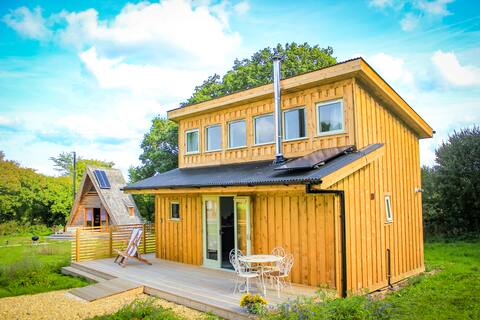
Tiny Home SAOIRSE - a not so teeny tiny home!
Entire Place • 1 bedroom
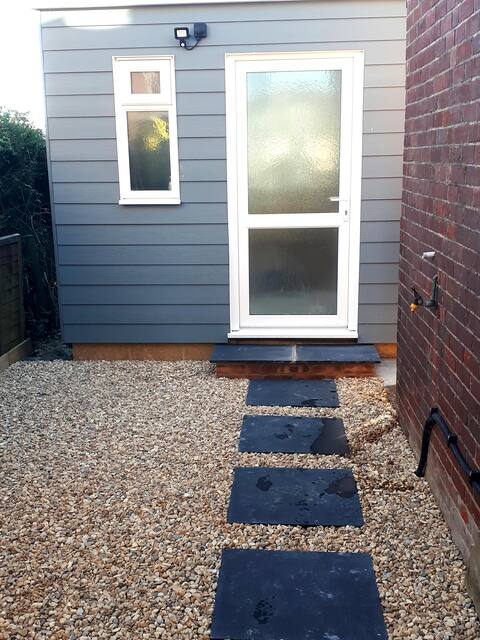
Modern Purpose Built Detached Private Annex
Entire Place • 1 bedroom
Note: Performance varies based on location, size, amenities, seasonality, and management quality. Data reflects the past 12 months.
Top Performing Airbnb Hosts in Northwood (2025)
Learn from the best! This table showcases top-performing Airbnb hosts in Northwood based on the number of properties managed and estimated total revenue over the past year. Analyze their scale and performance metrics.
| Host Name | Properties | Grossing Revenue | Stay Reviews | Avg Rating |
|---|---|---|---|---|
| Cottages | 1 | $85,916 | 29 | 4.76/5.0 |
| Helen | 5 | $71,816 | 364 | 4.88/5.0 |
| Clare | 2 | $49,848 | 94 | 4.86/5.0 |
| Sophie | 1 | $46,954 | 26 | 5.00/5.0 |
| Tony | 1 | $39,327 | 17 | 4.94/5.0 |
| Carol | 4 | $28,852 | 173 | 4.96/5.0 |
| Ian | 1 | $18,399 | 190 | 4.98/5.0 |
| David | 1 | $13,976 | 8 | 5.00/5.0 |
| Gavin | 1 | $13,805 | 13 | 4.69/5.0 |
| Host #426904766 | 1 | $11,717 | 73 | 4.84/5.0 |
Analyzing the strategies of top hosts, such as their property selection, pricing, and guest communication, can offer valuable lessons for optimizing your own Airbnb operations in Northwood.
Dive Deeper: Advanced Northwood STR Market Data (2025)
Ready to unlock more insights? AirROI provides access to advanced metrics and comprehensive Airbnb data for Northwood. Explore detailed analytics beyond this report to refine your investment strategy, optimize pricing, and maximize your vacation rental profits.
Explore Advanced MetricsNorthwood Short-Term Rental Market Composition (2025): Property & Room Types
Room Type Distribution
Property Type Distribution
Market Composition Insights for Northwood
- The Northwood Airbnb market composition is heavily skewed towards Entire Home/Apt listings, which make up 95.7% of the 23 active rentals. This indicates strong guest preference for privacy and space.
- Looking at the property type distribution in Northwood, House properties are the most common (60.9%), reflecting the local real estate landscape.
- Houses represent a significant 60.9% portion, catering likely to families or larger groups.
- Smaller segments like hotel/boutique, apartment/condo (combined 8.6%) offer potential for unique stay experiences.
Northwood Airbnb Room Capacity Analysis (2025): Bedroom Distribution
Distribution of Listings by Number of Bedrooms
Room Capacity Insights for Northwood
- The dominant room capacity in Northwood is 1 bedroom listings, making up 39.1% of the market. This suggests a strong demand for properties suitable for couples or solo travelers.
- Together, 1 bedroom and 3 bedrooms properties represent 65.2% of the active Airbnb listings in Northwood, indicating a high concentration in these sizes.
- A significant 30.4% of listings offer 3+ bedrooms, catering to larger groups and families seeking more space in Northwood.
Northwood Vacation Rental Guest Capacity Trends (2025)
Distribution of Listings by Guest Capacity
Guest Capacity Insights for Northwood
- The most common guest capacity trend in Northwood vacation rentals is listings accommodating 2 guests (30.4%). This suggests the primary traveler segment is likely couples or solo travelers.
- Properties designed for 2 guests and 4 guests dominate the Northwood STR market, accounting for 60.8% of listings.
- 26.1% of properties accommodate 6+ guests, serving the market segment for larger families or group travel in Northwood.
- On average, properties in Northwood are equipped to host 3.9 guests.
Northwood Airbnb Booking Patterns (2025): Available vs. Booked Days
Available Days Distribution
Booked Days Distribution
Booking Pattern Insights for Northwood
- The most common availability pattern in Northwood falls within the 271-366 days range, representing 60.9% of listings. This suggests many properties have significant open periods on their calendars.
- Approximately 91.3% of listings show high availability (181+ days open annually), indicating potential for increased bookings or specific owner usage patterns.
- For booked days, the 1-30 days range is most frequent in Northwood (30.4%), reflecting common guest stay durations or potential owner blocking patterns.
- A notable 8.6% of properties secure long booking periods (181+ days booked per year), highlighting successful long-term rental strategies or significant owner usage.
Northwood Airbnb Minimum Stay Requirements Analysis
Distribution of Listings by Minimum Night Requirement
1 Night
4 listings
20% of total
2 Nights
12 listings
60% of total
3 Nights
3 listings
15% of total
30+ Nights
1 listings
5% of total
Key Insights
- The most prevalent minimum stay requirement in Northwood is 2 Nights, adopted by 60% of listings. This highlights the market's preference for shorter, flexible bookings.
- A strong majority (80.0%) of the Northwood Airbnb data shows acceptance of very short stays (1-2 nights), indicating a dynamic, high-turnover market.
Recommendations
- Align with the market by considering a 2 Nights minimum stay, as 60% of Northwood hosts use this setting.
- If feasible, allowing 1-night stays, especially midweek or during low season, could capture last-minute bookings, as only 20% currently do.
- Adjust minimum nights based on seasonality – potentially shorter during low season and longer during peak demand periods in Northwood.
Northwood Airbnb Cancellation Policy Trends Analysis (2025)
Super Strict 60 Days
1 listings
5% of total
Flexible
3 listings
15% of total
Moderate
3 listings
15% of total
Firm
7 listings
35% of total
Strict
6 listings
30% of total
Cancellation Policy Insights for Northwood
- The prevailing Airbnb cancellation policy trend in Northwood is Firm, used by 35% of listings.
- A majority (65.0%) of hosts in Northwood utilize Firm or Strict policies, indicating a market where hosts prioritize booking security.
Recommendations for Hosts
- Consider adopting a Firm policy to align with the 35% market standard in Northwood.
- Regularly review your cancellation policy against competitors and market demand shifts in Northwood.
Northwood STR Booking Lead Time Analysis (2025)
Average Booking Lead Time by Month
Booking Lead Time Insights for Northwood
- The overall average booking lead time for vacation rentals in Northwood is 70 days.
- Guests book furthest in advance for stays during March (average 182 days), likely coinciding with peak travel demand or local events.
- The shortest booking windows occur for stays in December (average 33 days), indicating more last-minute travel plans during this time.
- Seasonally, Spring (132 days avg.) sees the longest lead times, while Winter (38 days avg.) has the shortest, reflecting typical travel planning cycles.
Recommendations for Hosts
- Use the overall average lead time (70 days) as a baseline for your pricing and availability strategy in Northwood.
- For March stays, consider implementing length-of-stay discounts or slightly higher rates for bookings made less than 182 days out to capitalize on advance planning.
- Target marketing efforts for the Spring season well in advance (at least 132 days) to capture early planners.
- Monitor your own booking lead times against these Northwood averages to identify opportunities for dynamic pricing adjustments.
Popular & Essential Airbnb Amenities in Northwood (2025)
Amenity Prevalence
Amenity Insights for Northwood
- Essential amenities in Northwood that guests expect include: Heating, Kitchen, Smoke alarm, Backyard, Cooking basics, Free parking on premises. Lacking these (any) could significantly impact bookings.
- Popular amenities like Refrigerator, Essentials, Carbon monoxide alarm are common but not universal. Offering these can provide a competitive edge.
Recommendations for Hosts
- Ensure your listing includes all essential amenities for Northwood: Heating, Kitchen, Smoke alarm, Backyard, Cooking basics, Free parking on premises.
- Prioritize adding missing essentials: Backyard, Cooking basics, Free parking on premises.
- Consider adding popular differentiators like Refrigerator or Essentials to increase appeal.
- Highlight unique or less common amenities you offer (e.g., hot tub, dedicated workspace, EV charger) in your listing description and photos.
- Regularly check competitor amenities in Northwood to stay competitive.
Northwood Airbnb Guest Demographics & Profile Analysis (2025)
Guest Profile Summary for Northwood
- The typical guest profile for Airbnb in Northwood consists of primarily domestic travelers (91%), often arriving from nearby England, typically belonging to the Post-2000s (Gen Z/Alpha) group (50%), primarily speaking English or French.
- Domestic travelers account for 90.8% of guests.
- Key international markets include United Kingdom (90.8%) and Australia (3.3%).
- Top languages spoken are English (66.1%) followed by French (5.4%).
- A significant demographic segment is the Post-2000s (Gen Z/Alpha) group, representing 50% of guests.
Recommendations for Hosts
- Target domestic marketing efforts towards travelers from England and London.
- Tailor amenities and listing descriptions to appeal to the dominant Post-2000s (Gen Z/Alpha) demographic (e.g., highlight fast WiFi, smart home features, local guides).
- Highlight unique local experiences or amenities relevant to the primary guest profile.
- Consider seasonal promotions aligned with peak travel times for key origin markets.
Nearby Short-Term Rental Market Comparison
How does the Northwood Airbnb market stack up against its neighbors? Compare key performance metrics like average monthly revenue, ADR, and occupancy rates in surrounding areas to understand the broader regional STR landscape.
| Market | Active Properties | Monthly Revenue | Daily Rate | Avg. Occupancy |
|---|---|---|---|---|
| Englishcombe | 13 | $8,558 | $573.69 | 49% |
| Dorney | 12 | $8,335 | $622.48 | 45% |
| Chew Magna | 14 | $6,649 | $399.59 | 46% |
| Lambourn | 11 | $6,081 | $669.47 | 28% |
| City of Westminster | 1,327 | $6,043 | $486.66 | 52% |
| Long Sutton | 17 | $5,726 | $383.88 | 46% |
| Stoke St. Michael | 10 | $5,277 | $424.04 | 42% |
| Winsham | 10 | $5,154 | $484.22 | 52% |
| Oldland Common | 13 | $5,093 | $355.47 | 43% |
| Wraysbury | 14 | $4,719 | $396.18 | 46% |