North Petherton Airbnb Market Analysis 2025: Short Term Rental Data & Vacation Rental Statistics in England, United Kingdom
Is Airbnb profitable in North Petherton in 2025? Explore comprehensive Airbnb analytics for North Petherton, England, United Kingdom to uncover income potential. This 2025 STR market report for North Petherton, based on AirROI data from April 2024 to March 2025, reveals key trends in the niche market of 25 active listings.
Whether you're considering an Airbnb investment in North Petherton, optimizing your existing vacation rental, or exploring rental arbitrage opportunities, understanding the North Petherton Airbnb data is crucial. Leveraging the low regulation environment is key to maximizing your short term rental income potential. Let's dive into the specifics.
Key North Petherton Airbnb Performance Metrics Overview
Monthly Airbnb Revenue Variations & Income Potential in North Petherton (2025)
Understanding the monthly revenue variations for Airbnb listings in North Petherton is key to maximizing your short term rental income potential. Seasonality significantly impacts earnings. Our analysis, based on data from the past 12 months, shows that the peak revenue month for STRs in North Petherton is typically August, while November often presents the lowest earnings, highlighting opportunities for strategic pricing adjustments during shoulder and low seasons. Explore the typical Airbnb income in North Petherton across different performance tiers:
- Best-in-class properties (Top 10%) achieve $6,014+ monthly, often utilizing dynamic pricing and superior guest experiences.
- Strong performing properties (Top 25%) earn $2,926 or more, indicating effective management and desirable locations/amenities.
- Typical properties (Median) generate around $1,665 per month, representing the average market performance.
- Entry-level properties (Bottom 25%) see earnings around $894, often with potential for optimization.
Average Monthly Airbnb Earnings Trend in North Petherton
North Petherton Airbnb Occupancy Rate Trends (2025)
Maximize your bookings by understanding the North Petherton STR occupancy trends. Seasonal demand shifts significantly influence how often properties are booked. Typically, Augustsees the highest demand (peak season occupancy), while November experiences the lowest (low season). Effective strategies, like adjusting minimum stays or offering promotions, can boost occupancy during slower periods. Here's how different property tiers perform in North Petherton:
- Best-in-class properties (Top 10%) achieve 78%+ occupancy, indicating high desirability and potentially optimized availability.
- Strong performing properties (Top 25%) maintain 64% or higher occupancy, suggesting good market fit and guest satisfaction.
- Typical properties (Median) have an occupancy rate around 46%.
- Entry-level properties (Bottom 25%) average 25% occupancy, potentially facing higher vacancy.
Average Monthly Occupancy Rate Trend in North Petherton
Average Daily Rate (ADR) Airbnb Trends in North Petherton (2025)
Effective short term rental pricing strategy in North Petherton involves understanding monthly ADR fluctuations. The Average Daily Rate (ADR) for Airbnb in North Petherton typically peaks in November and dips lowest during January. Leveraging Airbnb dynamic pricing tools or strategies based on this seasonality can significantly boost revenue. Here's a look at the typical nightly rates achieved:
- Best-in-class properties (Top 10%) command rates of $279+ per night, often due to premium features or locations.
- Strong performing properties (Top 25%) achieve nightly rates of $197 or more.
- Typical properties (Median) charge around $132 per night.
- Entry-level properties (Bottom 25%) earn around $88 per night.
Average Daily Rate (ADR) Trend by Month in North Petherton
Get Live North Petherton Market Intelligence 👇

Explore Real-time Analytics
Airbnb Seasonality Analysis & Trends in North Petherton (2025)
Peak Season (August, July, September)
- Revenue averages $4,578 per month
- Occupancy rates average 62.1%
- Daily rates average $180
Shoulder Season
- Revenue averages $3,286 per month
- Occupancy maintains around 46.1%
- Daily rates hold near $172
Low Season (March, June, November)
- Revenue drops to average $2,508 per month
- Occupancy decreases to average 33.7%
- Daily rates adjust to average $181
Seasonality Insights for North Petherton
- The Airbnb seasonality in North Petherton shows highly seasonal trends requiring careful strategy. While the sections above show seasonal averages, it's also insightful to look at the extremes:
- During the high season, the absolute peak month showcases North Petherton's highest earning potential, with monthly revenues capable of climbing to $5,158, occupancy reaching a high of 68.6%, and ADRs peaking at $188.
- Conversely, the slowest single month of the year, typically falling within the low season, marks the market's lowest point. In this month, revenue might dip to $2,450, occupancy could drop to 30.4%, and ADRs may adjust down to $169.
- Understanding both the seasonal averages and these monthly peaks and troughs in revenue, occupancy, and ADR is crucial for maximizing your Airbnb profit potential in North Petherton.
Seasonal Strategies for Maximizing Profit
- Peak Season: Maximize revenue through premium pricing and potentially longer minimum stays. Ensure high availability.
- Low Season: Offer competitive pricing, special promotions (e.g., extended stay discounts), and flexible cancellation policies. Target off-season travelers like remote workers or budget-conscious guests.
- Shoulder Seasons: Implement dynamic pricing that balances peak and low rates. Target weekend travelers or specific events. Offer slightly more flexible terms than peak season.
- Regularly analyze your own performance against these North Petherton seasonality benchmarks and adjust your pricing and availability strategy accordingly.
Best Areas for Airbnb Investment in North Petherton (2025)
Exploring the top neighborhoods for short-term rentals in North Petherton? This section highlights key areas, outlining why they are attractive for hosts and guests, along with notable local attractions. Consider these locations based on your target guest profile and investment strategy.
| Neighborhood / Area | Why Host Here? (Target Guests & Appeal) | Key Attractions & Landmarks |
|---|---|---|
| North Petherton Town Centre | The heart of North Petherton, offering a variety of shops, cafes, and community events. It's a great location for visitors wanting to experience local life and culture. | The Village Hall, Local pubs and restaurants, Community events and fairs, Historic architecture |
| River Parrett Trail | This scenic riverside location is popular with nature lovers and walkers. It provides tranquil views and opportunities for outdoor activities, attracting those looking to escape city life. | The River Parrett, Walking trails, Bird watching spots, Picnic areas |
| Blackdown Hills Area of Outstanding Natural Beauty | Just a short drive away, this area is known for its stunning landscapes and outdoor recreation. It's perfect for visitors seeking hiking, biking, and exploring nature. | Hiking trails, Scenic viewpoints, Wildlife spotting, Historical sites such as Hemyock Castle |
| Tiverton | A nearby town with its own set of attractions and history. It offers a more urban experience while still providing easy access to the countryside and rural attractions. | Tiverton Castle, Grand Western Canal, Local markets, Historic buildings |
| Bridgwater | A larger town nearby with a variety of amenities, shopping, and historical sites. It's a good option for travelers looking for more bustling environments and cultural experiences. | Bridgwater Castle, The Blake Museum, Canal walks, Local festivals |
| Quantock Hills | This stunning area is great for outdoor enthusiasts and nature lovers. It provides beautiful sceneries and opportunities for various outdoor activities. | Walking and hiking trails, Scenic landscapes, Wildlife, Historical sites like Coleridge Cottage |
| Westonzoyland | A quaint nearby village with historical significance and local charm. It's attractive for visitors looking for a peaceful countryside stay. | Westonzoyland Pumping Station, Local countryside walks, Quaint village atmosphere |
| Burnham-on-Sea | A nearby seaside resort town that attracts tourists looking for beach experiences. It provides opportunities for family fun and relaxation by the coast. | Burnham-on-Sea Beach, The Lighthouse, Local seafood restaurants, Seafront attractions |
Understanding Airbnb License Requirements & STR Laws in North Petherton (2025)
While North Petherton, England, United Kingdom currently shows low STR regulations, specific Airbnb license requirements might still exist or change. Always verify the latest short term rental regulations and Airbnb license requirements directly with local government authorities for North Petherton to ensure full compliance before hosting.
(Source: AirROI data, 2025, based on 4% licensed listings)
Top Performing Airbnb Properties in North Petherton (2025)
Benchmark your potential! Explore examples of top-performing Airbnb properties in North Pethertonbased on Trailing Twelve Month (TTM) revenue. Analyze their characteristics, revenue, occupancy rate, and ADR to understand what drives success in this market.

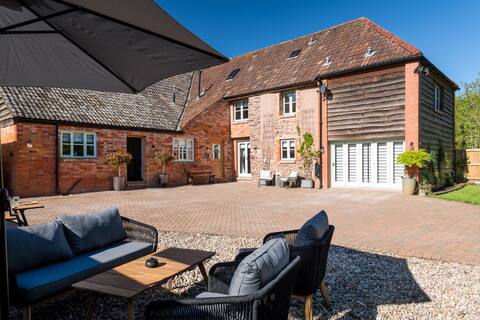
Country House w/ Pool, Hot Tub, Tennis Courts, Gym
Entire Place • 7 bedrooms
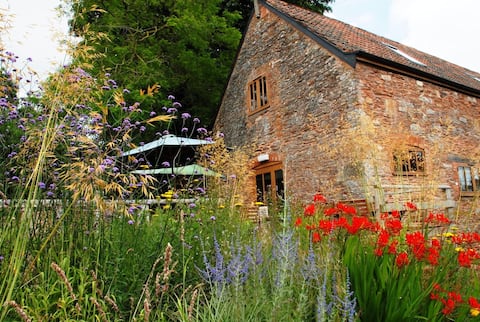
Barn Conversion North Petherton
Entire Place • 4 bedrooms

Luxury Shepherd’s Hut Retreat & Hot Tub - Somerset
Entire Place • 1 bedroom
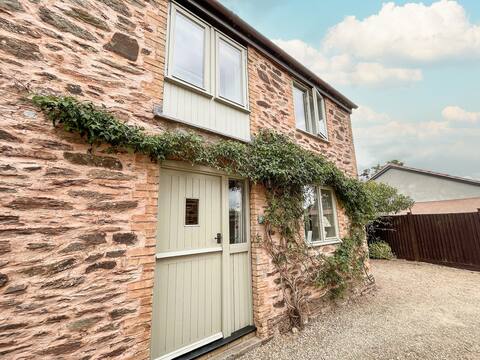
Barn conversion on the Quantock Hills Somerset
Entire Place • 3 bedrooms
Dragonfly Two
Entire Place • 2 bedrooms
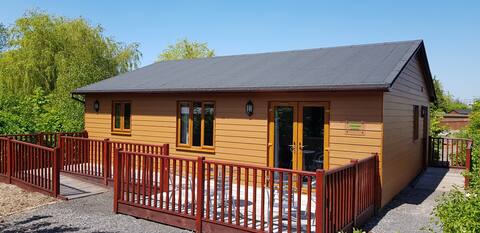
Walnut Lodge, Summerhayes
Entire Place • 2 bedrooms
Note: Performance varies based on location, size, amenities, seasonality, and management quality. Data reflects the past 12 months.
Top Performing Airbnb Hosts in North Petherton (2025)
Learn from the best! This table showcases top-performing Airbnb hosts in North Petherton based on the number of properties managed and estimated total revenue over the past year. Analyze their scale and performance metrics.
| Host Name | Properties | Grossing Revenue | Stay Reviews | Avg Rating |
|---|---|---|---|---|
| William | 1 | $316,189 | 94 | 4.85/5.0 |
| Matthew | 1 | $72,659 | 43 | 5.00/5.0 |
| Christine | 4 | $52,232 | 288 | 4.80/5.0 |
| Cottages | 3 | $49,489 | 15 | 3.27/5.0 |
| Laura | 1 | $46,544 | 163 | 4.99/5.0 |
| Emily | 2 | $31,425 | 71 | 4.93/5.0 |
| Peter | 2 | $29,038 | 46 | 4.93/5.0 |
| Host #306409481 | 1 | $25,321 | 76 | 4.93/5.0 |
| Alison | 1 | $19,959 | 92 | 4.96/5.0 |
| Stu | 1 | $19,103 | 42 | 5.00/5.0 |
Analyzing the strategies of top hosts, such as their property selection, pricing, and guest communication, can offer valuable lessons for optimizing your own Airbnb operations in North Petherton.
Dive Deeper: Advanced North Petherton STR Market Data (2025)
Ready to unlock more insights? AirROI provides access to advanced metrics and comprehensive Airbnb data for North Petherton. Explore detailed analytics beyond this report to refine your investment strategy, optimize pricing, and maximize your vacation rental profits.
Explore Advanced MetricsNorth Petherton Short-Term Rental Market Composition (2025): Property & Room Types
Room Type Distribution
Property Type Distribution
Market Composition Insights for North Petherton
- The North Petherton Airbnb market composition is heavily skewed towards Entire Home/Apt listings, which make up 92% of the 25 active rentals. This indicates strong guest preference for privacy and space.
- Looking at the property type distribution in North Petherton, House properties are the most common (56%), reflecting the local real estate landscape.
- Houses represent a significant 56% portion, catering likely to families or larger groups.
North Petherton Airbnb Room Capacity Analysis (2025): Bedroom Distribution
Distribution of Listings by Number of Bedrooms
Room Capacity Insights for North Petherton
- The dominant room capacity in North Petherton is 1 bedroom listings, making up 44% of the market. This suggests a strong demand for properties suitable for couples or solo travelers.
- Together, 1 bedroom and 2 bedrooms properties represent 76.0% of the active Airbnb listings in North Petherton, indicating a high concentration in these sizes.
North Petherton Vacation Rental Guest Capacity Trends (2025)
Distribution of Listings by Guest Capacity
Guest Capacity Insights for North Petherton
- The most common guest capacity trend in North Petherton vacation rentals is listings accommodating 2 guests (32%). This suggests the primary traveler segment is likely couples or solo travelers.
- Properties designed for 2 guests and 4 guests dominate the North Petherton STR market, accounting for 64.0% of listings.
- 20.0% of properties accommodate 6+ guests, serving the market segment for larger families or group travel in North Petherton.
- On average, properties in North Petherton are equipped to host 3.6 guests.
North Petherton Airbnb Booking Patterns (2025): Available vs. Booked Days
Available Days Distribution
Booked Days Distribution
Booking Pattern Insights for North Petherton
- The most common availability pattern in North Petherton falls within the 271-366 days range, representing 44% of listings. This suggests many properties have significant open periods on their calendars.
- Approximately 72.0% of listings show high availability (181+ days open annually), indicating potential for increased bookings or specific owner usage patterns.
- For booked days, the 31-90 days range is most frequent in North Petherton (32%), reflecting common guest stay durations or potential owner blocking patterns.
- A notable 28.0% of properties secure long booking periods (181+ days booked per year), highlighting successful long-term rental strategies or significant owner usage.
North Petherton Airbnb Minimum Stay Requirements Analysis
Distribution of Listings by Minimum Night Requirement
1 Night
5 listings
20.8% of total
2 Nights
8 listings
33.3% of total
3 Nights
9 listings
37.5% of total
4-6 Nights
2 listings
8.3% of total
Key Insights
- The most prevalent minimum stay requirement in North Petherton is 3 Nights, adopted by 37.5% of listings. This highlights the market's preference for longer commitments.
Recommendations
- Align with the market by considering a 3 Nights minimum stay, as 37.5% of North Petherton hosts use this setting.
- If feasible, allowing 1-night stays, especially midweek or during low season, could capture last-minute bookings, as only 20.8% currently do.
- Adjust minimum nights based on seasonality – potentially shorter during low season and longer during peak demand periods in North Petherton.
North Petherton Airbnb Cancellation Policy Trends Analysis (2025)
Super Strict 60 Days
3 listings
12.5% of total
Flexible
10 listings
41.7% of total
Moderate
6 listings
25% of total
Firm
3 listings
12.5% of total
Strict
2 listings
8.3% of total
Cancellation Policy Insights for North Petherton
- The prevailing Airbnb cancellation policy trend in North Petherton is Flexible, used by 41.7% of listings.
- There's a relatively balanced mix between guest-friendly (66.7%) and stricter (20.8%) policies, offering choices for different guest needs.
- Strict cancellation policies are quite rare (8.3%), potentially making listings with this policy less competitive unless justified by high demand or property type.
Recommendations for Hosts
- Consider adopting a Flexible policy to align with the 41.7% market standard in North Petherton.
- Using a Strict policy might deter some guests, as only 8.3% of listings use it. Evaluate if potential revenue protection outweighs possible lower booking rates.
- Regularly review your cancellation policy against competitors and market demand shifts in North Petherton.
North Petherton STR Booking Lead Time Analysis (2025)
Average Booking Lead Time by Month
Booking Lead Time Insights for North Petherton
- The overall average booking lead time for vacation rentals in North Petherton is 54 days.
- Guests book furthest in advance for stays during June (average 90 days), likely coinciding with peak travel demand or local events.
- The shortest booking windows occur for stays in January (average 39 days), indicating more last-minute travel plans during this time.
- Seasonally, Summer (78 days avg.) sees the longest lead times, while Winter (41 days avg.) has the shortest, reflecting typical travel planning cycles.
Recommendations for Hosts
- Use the overall average lead time (54 days) as a baseline for your pricing and availability strategy in North Petherton.
- For June stays, consider implementing length-of-stay discounts or slightly higher rates for bookings made less than 90 days out to capitalize on advance planning.
- Target marketing efforts for the Summer season well in advance (at least 78 days) to capture early planners.
- Monitor your own booking lead times against these North Petherton averages to identify opportunities for dynamic pricing adjustments.
Popular & Essential Airbnb Amenities in North Petherton (2025)
Amenity Prevalence
Amenity Insights for North Petherton
- Essential amenities in North Petherton that guests expect include: Smoke alarm, Kitchen. Lacking these (any) could significantly impact bookings.
- Popular amenities like Heating, Bed linens, Free parking on premises are common but not universal. Offering these can provide a competitive edge.
- Warning: Wifi is not universally provided but is considered essential globally. Ensure reliable Wifi is offered.
Recommendations for Hosts
- Ensure your listing includes all essential amenities for North Petherton: Smoke alarm, Kitchen.
- Prioritize adding missing essentials: Smoke alarm, Kitchen.
- Consider adding popular differentiators like Heating or Bed linens to increase appeal.
- Highlight unique or less common amenities you offer (e.g., hot tub, dedicated workspace, EV charger) in your listing description and photos.
- Regularly check competitor amenities in North Petherton to stay competitive.
North Petherton Airbnb Guest Demographics & Profile Analysis (2025)
Guest Profile Summary for North Petherton
- The typical guest profile for Airbnb in North Petherton consists of primarily domestic travelers (93%), often arriving from nearby England, typically belonging to the Post-2000s (Gen Z/Alpha) group (50%), primarily speaking English or Polish.
- Domestic travelers account for 92.9% of guests.
- Key international markets include United Kingdom (92.9%) and United States (2.7%).
- Top languages spoken are English (77%) followed by Polish (4.6%).
- A significant demographic segment is the Post-2000s (Gen Z/Alpha) group, representing 50% of guests.
Recommendations for Hosts
- Target domestic marketing efforts towards travelers from England and London.
- Tailor amenities and listing descriptions to appeal to the dominant Post-2000s (Gen Z/Alpha) demographic (e.g., highlight fast WiFi, smart home features, local guides).
- Highlight unique local experiences or amenities relevant to the primary guest profile.
- Consider seasonal promotions aligned with peak travel times for key origin markets.
Nearby Short-Term Rental Market Comparison
How does the North Petherton Airbnb market stack up against its neighbors? Compare key performance metrics like average monthly revenue, ADR, and occupancy rates in surrounding areas to understand the broader regional STR landscape.
| Market | Active Properties | Monthly Revenue | Daily Rate | Avg. Occupancy |
|---|---|---|---|---|
| Englishcombe | 13 | $8,558 | $573.69 | 49% |
| Chew Magna | 14 | $6,649 | $399.59 | 46% |
| Long Sutton | 17 | $5,726 | $383.88 | 46% |
| Stoke St. Michael | 10 | $5,277 | $424.04 | 42% |
| Winsham | 10 | $5,154 | $484.22 | 52% |
| Oldland Common | 13 | $5,093 | $355.47 | 43% |
| Llanrhidian | 15 | $4,842 | $386.18 | 53% |
| Crai | 20 | $4,799 | $371.85 | 46% |
| Limpley Stoke | 10 | $4,598 | $523.47 | 52% |
| Abbeycwmhir | 10 | $4,502 | $259.18 | 49% |