Ningwood Airbnb Market Analysis 2025: Short Term Rental Data & Vacation Rental Statistics in England, United Kingdom
Is Airbnb profitable in Ningwood in 2025? Explore comprehensive Airbnb analytics for Ningwood, England, United Kingdom to uncover income potential. This 2025 STR market report for Ningwood, based on AirROI data from April 2024 to March 2025, reveals key trends in the niche market of 18 active listings.
Whether you're considering an Airbnb investment in Ningwood, optimizing your existing vacation rental, or exploring rental arbitrage opportunities, understanding the Ningwood Airbnb data is crucial. Leveraging the low regulation environment is key to maximizing your short term rental income potential. Let's dive into the specifics.
Key Ningwood Airbnb Performance Metrics Overview
Monthly Airbnb Revenue Variations & Income Potential in Ningwood (2025)
Understanding the monthly revenue variations for Airbnb listings in Ningwood is key to maximizing your short term rental income potential. Seasonality significantly impacts earnings. Our analysis, based on data from the past 12 months, shows that the peak revenue month for STRs in Ningwood is typically August, while February often presents the lowest earnings, highlighting opportunities for strategic pricing adjustments during shoulder and low seasons. Explore the typical Airbnb income in Ningwood across different performance tiers:
- Best-in-class properties (Top 10%) achieve $4,145+ monthly, often utilizing dynamic pricing and superior guest experiences.
- Strong performing properties (Top 25%) earn $2,624 or more, indicating effective management and desirable locations/amenities.
- Typical properties (Median) generate around $1,200 per month, representing the average market performance.
- Entry-level properties (Bottom 25%) see earnings around $313, often with potential for optimization.
Average Monthly Airbnb Earnings Trend in Ningwood
Ningwood Airbnb Occupancy Rate Trends (2025)
Maximize your bookings by understanding the Ningwood STR occupancy trends. Seasonal demand shifts significantly influence how often properties are booked. Typically, Augustsees the highest demand (peak season occupancy), while June experiences the lowest (low season). Effective strategies, like adjusting minimum stays or offering promotions, can boost occupancy during slower periods. Here's how different property tiers perform in Ningwood:
- Best-in-class properties (Top 10%) achieve 65%+ occupancy, indicating high desirability and potentially optimized availability.
- Strong performing properties (Top 25%) maintain 42% or higher occupancy, suggesting good market fit and guest satisfaction.
- Typical properties (Median) have an occupancy rate around 27%.
- Entry-level properties (Bottom 25%) average 10% occupancy, potentially facing higher vacancy.
Average Monthly Occupancy Rate Trend in Ningwood
Average Daily Rate (ADR) Airbnb Trends in Ningwood (2025)
Effective short term rental pricing strategy in Ningwood involves understanding monthly ADR fluctuations. The Average Daily Rate (ADR) for Airbnb in Ningwood typically peaks in May and dips lowest during January. Leveraging Airbnb dynamic pricing tools or strategies based on this seasonality can significantly boost revenue. Here's a look at the typical nightly rates achieved:
- Best-in-class properties (Top 10%) command rates of $483+ per night, often due to premium features or locations.
- Strong performing properties (Top 25%) achieve nightly rates of $172 or more.
- Typical properties (Median) charge around $114 per night.
- Entry-level properties (Bottom 25%) earn around $81 per night.
Average Daily Rate (ADR) Trend by Month in Ningwood
Get Live Ningwood Market Intelligence 👇

Explore Real-time Analytics
Airbnb Seasonality Analysis & Trends in Ningwood (2025)
Peak Season (August, July, April)
- Revenue averages $2,911 per month
- Occupancy rates average 43.6%
- Daily rates average $217
Shoulder Season
- Revenue averages $1,583 per month
- Occupancy maintains around 26.9%
- Daily rates hold near $178
Low Season (February, November, December)
- Revenue drops to average $884 per month
- Occupancy decreases to average 22.9%
- Daily rates adjust to average $113
Seasonality Insights for Ningwood
- The Airbnb seasonality in Ningwood shows highly seasonal trends requiring careful strategy. While the sections above show seasonal averages, it's also insightful to look at the extremes:
- During the high season, the absolute peak month showcases Ningwood's highest earning potential, with monthly revenues capable of climbing to $3,321, occupancy reaching a high of 49.0%, and ADRs peaking at $218.
- Conversely, the slowest single month of the year, typically falling within the low season, marks the market's lowest point. In this month, revenue might dip to $760, occupancy could drop to 19.6%, and ADRs may adjust down to $111.
- Understanding both the seasonal averages and these monthly peaks and troughs in revenue, occupancy, and ADR is crucial for maximizing your Airbnb profit potential in Ningwood.
Seasonal Strategies for Maximizing Profit
- Peak Season: Maximize revenue through premium pricing and potentially longer minimum stays. Ensure high availability.
- Low Season: Offer competitive pricing, special promotions (e.g., extended stay discounts), and flexible cancellation policies. Target off-season travelers like remote workers or budget-conscious guests.
- Shoulder Seasons: Implement dynamic pricing that balances peak and low rates. Target weekend travelers or specific events. Offer slightly more flexible terms than peak season.
- Regularly analyze your own performance against these Ningwood seasonality benchmarks and adjust your pricing and availability strategy accordingly.
Best Areas for Airbnb Investment in Ningwood (2025)
Exploring the top neighborhoods for short-term rentals in Ningwood? This section highlights key areas, outlining why they are attractive for hosts and guests, along with notable local attractions. Consider these locations based on your target guest profile and investment strategy.
| Neighborhood / Area | Why Host Here? (Target Guests & Appeal) | Key Attractions & Landmarks |
|---|---|---|
| Ningwood Village | A quaint rural village offering a peaceful atmosphere and proximity to the New Forest National Park, perfect for nature lovers and those looking to escape the hustle and bustle. | New Forest National Park, Ningwood Windmill, Local pubs and eateries, Walking and cycling trails, Horse riding in the New Forest |
| Yarmouth | A picturesque coastal town known for its marina and historical significance, attracting visitors to its sandy beaches and scenic boat rides. | Yarmouth Castle, The Needles, Marina and sandy beaches, Local seafood restaurants, Historic buildings |
| Cowes | Famous for its sailing events and regattas, Cowes attracts sailing enthusiasts and beachgoers alike, making it a prime location for tourism. | Cowes Week, Royal Yacht Squadron, Cowes Beach, Seafront promenades, Shops and cafes |
| East Cowes | A charming town located opposite Cowes, offering beautiful waterfront views and easy access to local ferries, suitable for both tourists and commuters. | East Cowes Marina, Egypt Point, Seaview Wildlife Encounter, Local parks, Shops and bars |
| Newport | The main town of the Isle of Wight offering a mix of shopping, nightlife, and historical sites, attracting vacationers seeking convenience and culture. | Carisbrooke Castle, Newport Roman Villa, Shopping in the High Street, The Medina Theatre, Local markets |
| Ryde | A popular seaside resort known for its long sandy beach and Victorian architecture, ideal for family vacations and holidaymakers looking for a classic seaside experience. | Ryde Beach, Ryde Pier, Dinosaur Isle, Local amusement parks, Ice cream shops and cafes |
| Shanklin | A charming town with stunning beaches and coastal scenery, offering a traditional British seaside holiday experience with plenty of attractions. | Shanklin Beach, Shanklin Chine, Local amusement arcades, Historic Old Village, Theaters and entertainment |
| Sandown | Renowned for its beaches and family-friendly attractions, Sandown is perfect for families seeking fun and relaxation during their holiday. | Sandown Beach, Dinosaur Isle, Sandown Pier, Local Zoo, Amusement park |
Understanding Airbnb License Requirements & STR Laws in Ningwood (2025)
While Ningwood, England, United Kingdom currently shows low STR regulations, specific Airbnb license requirements might still exist or change. Always verify the latest short term rental regulations and Airbnb license requirements directly with local government authorities for Ningwood to ensure full compliance before hosting.
(Source: AirROI data, 2025, finding no licensed listings among those analyzed)
Top Performing Airbnb Properties in Ningwood (2025)
Benchmark your potential! Explore examples of top-performing Airbnb properties in Ningwoodbased on Trailing Twelve Month (TTM) revenue. Analyze their characteristics, revenue, occupancy rate, and ADR to understand what drives success in this market.

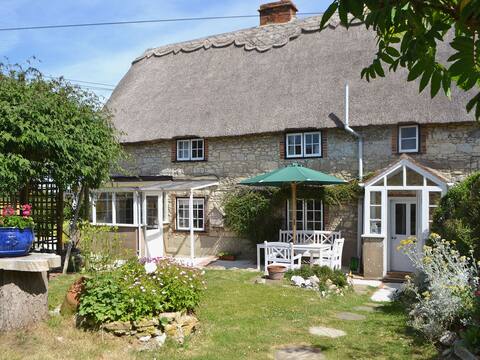
Peaceful and family friendly home
Entire Place • 4 bedrooms

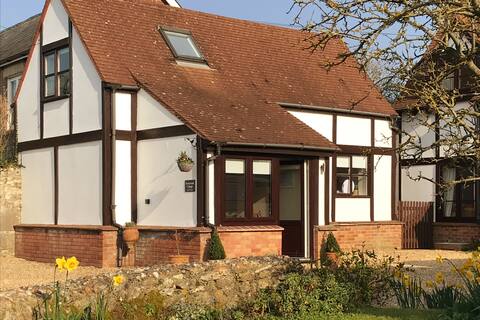
Luxury bungalow for 2 -9 in stunning countryside
Entire Place • 4 bedrooms
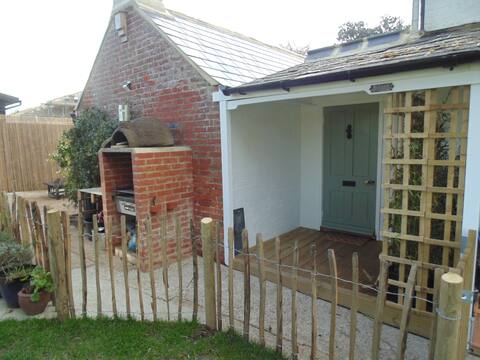
Southview Cottage
Entire Place • 2 bedrooms

Stunning detached annexe near Yarmouth.
Entire Place • 1 bedroom
Rural Cottage with Stunning Views of the Downs
Entire Place • 2 bedrooms
Tiny Cottage for couples in the countryside
Entire Place • 1 bedroom
Note: Performance varies based on location, size, amenities, seasonality, and management quality. Data reflects the past 12 months.
Top Performing Airbnb Hosts in Ningwood (2025)
Learn from the best! This table showcases top-performing Airbnb hosts in Ningwood based on the number of properties managed and estimated total revenue over the past year. Analyze their scale and performance metrics.
| Host Name | Properties | Grossing Revenue | Stay Reviews | Avg Rating |
|---|---|---|---|---|
| Cottages | 2 | $44,259 | 9 | 2.39/5.0 |
| Steve | 2 | $39,199 | 40 | 4.87/5.0 |
| Rory | 1 | $36,098 | 7 | 5.00/5.0 |
| Julie | 1 | $23,050 | 34 | 4.97/5.0 |
| Tony | 1 | $18,620 | 16 | 4.94/5.0 |
| Elizabeth | 3 | $13,562 | 139 | 3.24/5.0 |
| Thomas | 4 | $13,205 | 186 | 4.78/5.0 |
| Louise Gemma | 1 | $11,151 | 48 | 4.96/5.0 |
| Peter | 1 | $7,562 | 11 | 4.82/5.0 |
| Gemma | 2 | $2,669 | 32 | 4.91/5.0 |
Analyzing the strategies of top hosts, such as their property selection, pricing, and guest communication, can offer valuable lessons for optimizing your own Airbnb operations in Ningwood.
Dive Deeper: Advanced Ningwood STR Market Data (2025)
Ready to unlock more insights? AirROI provides access to advanced metrics and comprehensive Airbnb data for Ningwood. Explore detailed analytics beyond this report to refine your investment strategy, optimize pricing, and maximize your vacation rental profits.
Explore Advanced MetricsNingwood Short-Term Rental Market Composition (2025): Property & Room Types
Room Type Distribution
Property Type Distribution
Market Composition Insights for Ningwood
- The Ningwood Airbnb market composition is heavily skewed towards Entire Home/Apt listings, which make up 88.9% of the 18 active rentals. This indicates strong guest preference for privacy and space.
- Looking at the property type distribution in Ningwood, House properties are the most common (38.9%), reflecting the local real estate landscape.
- Houses represent a significant 38.9% portion, catering likely to families or larger groups.
- The presence of 11.1% Hotel/Boutique listings indicates integration with traditional hospitality.
Ningwood Airbnb Room Capacity Analysis (2025): Bedroom Distribution
Distribution of Listings by Number of Bedrooms
Room Capacity Insights for Ningwood
- The dominant room capacity in Ningwood is 1 bedroom listings, making up 61.1% of the market. This suggests a strong demand for properties suitable for couples or solo travelers.
- Together, 1 bedroom and 2 bedrooms properties represent 83.3% of the active Airbnb listings in Ningwood, indicating a high concentration in these sizes.
- With over half the market (61.1%) consisting of studios or 1-bedroom units, Ningwood is particularly well-suited for individuals or couples.
Ningwood Vacation Rental Guest Capacity Trends (2025)
Distribution of Listings by Guest Capacity
Guest Capacity Insights for Ningwood
- The most common guest capacity trend in Ningwood vacation rentals is listings accommodating 2 guests (50%). This suggests the primary traveler segment is likely couples or solo travelers.
- Properties designed for 2 guests and 4 guests dominate the Ningwood STR market, accounting for 66.7% of listings.
- A significant 50.0% of listings cater specifically to 1-2 guests, highlighting strong demand from couples and solo travelers in Ningwood.
- 22.2% of properties accommodate 6+ guests, serving the market segment for larger families or group travel in Ningwood.
- On average, properties in Ningwood are equipped to host 3.8 guests.
Ningwood Airbnb Booking Patterns (2025): Available vs. Booked Days
Available Days Distribution
Booked Days Distribution
Booking Pattern Insights for Ningwood
- The most common availability pattern in Ningwood falls within the 271-366 days range, representing 72.2% of listings. This suggests many properties have significant open periods on their calendars.
- Approximately 94.4% of listings show high availability (181+ days open annually), indicating potential for increased bookings or specific owner usage patterns.
- For booked days, the 1-30 days range is most frequent in Ningwood (38.9%), reflecting common guest stay durations or potential owner blocking patterns.
- A notable 5.6% of properties secure long booking periods (181+ days booked per year), highlighting successful long-term rental strategies or significant owner usage.
Ningwood Airbnb Minimum Stay Requirements Analysis
Distribution of Listings by Minimum Night Requirement
1 Night
4 listings
22.2% of total
2 Nights
10 listings
55.6% of total
3 Nights
4 listings
22.2% of total
Key Insights
- The most prevalent minimum stay requirement in Ningwood is 2 Nights, adopted by 55.6% of listings. This highlights the market's preference for shorter, flexible bookings.
- A strong majority (77.8%) of the Ningwood Airbnb data shows acceptance of very short stays (1-2 nights), indicating a dynamic, high-turnover market.
Recommendations
- Align with the market by considering a 2 Nights minimum stay, as 55.6% of Ningwood hosts use this setting.
- If feasible, allowing 1-night stays, especially midweek or during low season, could capture last-minute bookings, as only 22.2% currently do.
- Adjust minimum nights based on seasonality – potentially shorter during low season and longer during peak demand periods in Ningwood.
Ningwood Airbnb Cancellation Policy Trends Analysis (2025)
Super Strict 60 Days
1 listings
6.3% of total
Flexible
2 listings
12.5% of total
Moderate
3 listings
18.8% of total
Firm
2 listings
12.5% of total
Strict
8 listings
50% of total
Cancellation Policy Insights for Ningwood
- The prevailing Airbnb cancellation policy trend in Ningwood is Strict, used by 50% of listings.
- A majority (62.5%) of hosts in Ningwood utilize Firm or Strict policies, indicating a market where hosts prioritize booking security.
Recommendations for Hosts
- Consider adopting a Strict policy to align with the 50% market standard in Ningwood.
- With 50% using Strict terms, this is a viable option in Ningwood, particularly for high-value properties or during peak demand periods.
- Regularly review your cancellation policy against competitors and market demand shifts in Ningwood.
Ningwood STR Booking Lead Time Analysis (2025)
Average Booking Lead Time by Month
Booking Lead Time Insights for Ningwood
- The overall average booking lead time for vacation rentals in Ningwood is 60 days.
- Guests book furthest in advance for stays during June (average 128 days), likely coinciding with peak travel demand or local events.
- The shortest booking windows occur for stays in February (average 11 days), indicating more last-minute travel plans during this time.
- Seasonally, Summer (91 days avg.) sees the longest lead times, while Winter (34 days avg.) has the shortest, reflecting typical travel planning cycles.
Recommendations for Hosts
- Use the overall average lead time (60 days) as a baseline for your pricing and availability strategy in Ningwood.
- For June stays, consider implementing length-of-stay discounts or slightly higher rates for bookings made less than 128 days out to capitalize on advance planning.
- During February, focus on last-minute booking availability and promotions, as guests book with very short notice (11 days avg.).
- Target marketing efforts for the Summer season well in advance (at least 91 days) to capture early planners.
- Monitor your own booking lead times against these Ningwood averages to identify opportunities for dynamic pricing adjustments.
Popular & Essential Airbnb Amenities in Ningwood (2025)
Amenity Prevalence
Amenity Insights for Ningwood
- Essential amenities in Ningwood that guests expect include: Free parking on premises. Lacking these (this) could significantly impact bookings.
- Popular amenities like Heating, Smoke alarm, Kitchen are common but not universal. Offering these can provide a competitive edge.
Recommendations for Hosts
- Ensure your listing includes all essential amenities for Ningwood: Free parking on premises.
- Consider adding popular differentiators like Heating or Smoke alarm to increase appeal.
- Highlight unique or less common amenities you offer (e.g., hot tub, dedicated workspace, EV charger) in your listing description and photos.
- Regularly check competitor amenities in Ningwood to stay competitive.
Ningwood Airbnb Guest Demographics & Profile Analysis (2025)
Guest Profile Summary for Ningwood
- The typical guest profile for Airbnb in Ningwood consists of primarily domestic travelers (92%), often arriving from nearby England, typically belonging to the Post-2000s (Gen Z/Alpha) group (50%), primarily speaking English or French.
- Domestic travelers account for 92.4% of guests.
- Key international markets include United Kingdom (92.4%) and Netherlands (3%).
- Top languages spoken are English (62.5%) followed by French (9.4%).
- A significant demographic segment is the Post-2000s (Gen Z/Alpha) group, representing 50% of guests.
Recommendations for Hosts
- Target domestic marketing efforts towards travelers from England and London.
- Tailor amenities and listing descriptions to appeal to the dominant Post-2000s (Gen Z/Alpha) demographic (e.g., highlight fast WiFi, smart home features, local guides).
- Highlight unique local experiences or amenities relevant to the primary guest profile.
- Consider seasonal promotions aligned with peak travel times for key origin markets.
Nearby Short-Term Rental Market Comparison
How does the Ningwood Airbnb market stack up against its neighbors? Compare key performance metrics like average monthly revenue, ADR, and occupancy rates in surrounding areas to understand the broader regional STR landscape.
| Market | Active Properties | Monthly Revenue | Daily Rate | Avg. Occupancy |
|---|---|---|---|---|
| Englishcombe | 13 | $8,558 | $573.69 | 49% |
| Dorney | 12 | $8,335 | $622.48 | 45% |
| Chew Magna | 14 | $6,649 | $399.59 | 46% |
| Lambourn | 11 | $6,081 | $669.47 | 28% |
| City of Westminster | 1,327 | $6,043 | $486.66 | 52% |
| Long Sutton | 17 | $5,726 | $383.88 | 46% |
| Stoke St. Michael | 10 | $5,277 | $424.04 | 42% |
| Winsham | 10 | $5,154 | $484.22 | 52% |
| Oldland Common | 13 | $5,093 | $355.47 | 43% |
| Wraysbury | 14 | $4,719 | $396.18 | 46% |