Newby Airbnb Market Analysis 2025: Short Term Rental Data & Vacation Rental Statistics in England, United Kingdom
Is Airbnb profitable in Newby in 2025? Explore comprehensive Airbnb analytics for Newby, England, United Kingdom to uncover income potential. This 2025 STR market report for Newby, based on AirROI data from April 2024 to March 2025, reveals key trends in the niche market of 22 active listings.
Whether you're considering an Airbnb investment in Newby, optimizing your existing vacation rental, or exploring rental arbitrage opportunities, understanding the Newby Airbnb data is crucial. Leveraging the low regulation environment is key to maximizing your short term rental income potential. Let's dive into the specifics.
Key Newby Airbnb Performance Metrics Overview
Monthly Airbnb Revenue Variations & Income Potential in Newby (2025)
Understanding the monthly revenue variations for Airbnb listings in Newby is key to maximizing your short term rental income potential. Seasonality significantly impacts earnings. Our analysis, based on data from the past 12 months, shows that the peak revenue month for STRs in Newby is typically May, while January often presents the lowest earnings, highlighting opportunities for strategic pricing adjustments during shoulder and low seasons. Explore the typical Airbnb income in Newby across different performance tiers:
- Best-in-class properties (Top 10%) achieve $7,173+ monthly, often utilizing dynamic pricing and superior guest experiences.
- Strong performing properties (Top 25%) earn $4,899 or more, indicating effective management and desirable locations/amenities.
- Typical properties (Median) generate around $2,248 per month, representing the average market performance.
- Entry-level properties (Bottom 25%) see earnings around $1,101, often with potential for optimization.
Average Monthly Airbnb Earnings Trend in Newby
Newby Airbnb Occupancy Rate Trends (2025)
Maximize your bookings by understanding the Newby STR occupancy trends. Seasonal demand shifts significantly influence how often properties are booked. Typically, Februarysees the highest demand (peak season occupancy), while October experiences the lowest (low season). Effective strategies, like adjusting minimum stays or offering promotions, can boost occupancy during slower periods. Here's how different property tiers perform in Newby:
- Best-in-class properties (Top 10%) achieve 81%+ occupancy, indicating high desirability and potentially optimized availability.
- Strong performing properties (Top 25%) maintain 59% or higher occupancy, suggesting good market fit and guest satisfaction.
- Typical properties (Median) have an occupancy rate around 32%.
- Entry-level properties (Bottom 25%) average 18% occupancy, potentially facing higher vacancy.
Average Monthly Occupancy Rate Trend in Newby
Average Daily Rate (ADR) Airbnb Trends in Newby (2025)
Effective short term rental pricing strategy in Newby involves understanding monthly ADR fluctuations. The Average Daily Rate (ADR) for Airbnb in Newby typically peaks in August and dips lowest during March. Leveraging Airbnb dynamic pricing tools or strategies based on this seasonality can significantly boost revenue. Here's a look at the typical nightly rates achieved:
- Best-in-class properties (Top 10%) command rates of $445+ per night, often due to premium features or locations.
- Strong performing properties (Top 25%) achieve nightly rates of $276 or more.
- Typical properties (Median) charge around $208 per night.
- Entry-level properties (Bottom 25%) earn around $134 per night.
Average Daily Rate (ADR) Trend by Month in Newby
Get Live Newby Market Intelligence 👇

Explore Real-time Analytics
Airbnb Seasonality Analysis & Trends in Newby (2025)
Peak Season (May, September, August)
- Revenue averages $3,987 per month
- Occupancy rates average 45.7%
- Daily rates average $270
Shoulder Season
- Revenue averages $3,266 per month
- Occupancy maintains around 43.9%
- Daily rates hold near $243
Low Season (January, March, October)
- Revenue drops to average $2,116 per month
- Occupancy decreases to average 32.4%
- Daily rates adjust to average $226
Seasonality Insights for Newby
- The Airbnb seasonality in Newby shows highly seasonal trends requiring careful strategy. While the sections above show seasonal averages, it's also insightful to look at the extremes:
- During the high season, the absolute peak month showcases Newby's highest earning potential, with monthly revenues capable of climbing to $4,230, occupancy reaching a high of 50.3%, and ADRs peaking at $284.
- Conversely, the slowest single month of the year, typically falling within the low season, marks the market's lowest point. In this month, revenue might dip to $1,699, occupancy could drop to 30.1%, and ADRs may adjust down to $209.
- Understanding both the seasonal averages and these monthly peaks and troughs in revenue, occupancy, and ADR is crucial for maximizing your Airbnb profit potential in Newby.
Seasonal Strategies for Maximizing Profit
- Peak Season: Maximize revenue through premium pricing and potentially longer minimum stays. Ensure high availability.
- Low Season: Offer competitive pricing, special promotions (e.g., extended stay discounts), and flexible cancellation policies. Target off-season travelers like remote workers or budget-conscious guests.
- Shoulder Seasons: Implement dynamic pricing that balances peak and low rates. Target weekend travelers or specific events. Offer slightly more flexible terms than peak season.
- Regularly analyze your own performance against these Newby seasonality benchmarks and adjust your pricing and availability strategy accordingly.
Best Areas for Airbnb Investment in Newby (2025)
Exploring the top neighborhoods for short-term rentals in Newby? This section highlights key areas, outlining why they are attractive for hosts and guests, along with notable local attractions. Consider these locations based on your target guest profile and investment strategy.
| Neighborhood / Area | Why Host Here? (Target Guests & Appeal) | Key Attractions & Landmarks |
|---|---|---|
| Newby Village | A charming village near the picturesque North York Moors, popular with tourists seeking a peaceful getaway with access to nature and scenic landscapes. | North York Moors National Park, Rievaulx Abbey, Byland Abbey, Hutton-le-Hole, Castle Howard |
| Pickering | A historic market town that serves as a gateway to the North York Moors, known for its steam railway and characterful streets. Popular among families and history enthusiasts. | Pickering Castle, North Yorkshire Moors Railway, Beck Isle Museum, Dalby Forest, The Mrs Pumphrey Memorial |
| Helmsley | A quaint market town with a scenic backdrop, ideal for tourists looking to explore local history, gardens, and the surrounding moors. | Helmsley Castle, Duncombe Park, Helmsley Walled Garden, Rievaulx Abbey, North York Moors |
| Whitby | A coastal town famous for its Dracula connections and stunning cliffs, offering sandy beaches and a charming harbor, attracting both tourists and history buffs. | Whitby Abbey, Captain Cook Memorial Museum, Whitby Harbour, Sandsend Beach, Whitby Pavilion |
| Scarborough | A bustling seaside resort with beautiful beaches, entertainment options, and historical attractions. Very popular during the summer months. | Scarborough Castle, South Bay Beach, Peasholm Park, Scarborough Spa, North Bay Railway |
| York | A historic city with a rich heritage, known for its medieval architecture and vibrant cultural scene. Attracts a diverse range of tourists. | York Minster, The Shambles, National Railway Museum, York Castle Museum, Clifford's Tower |
| Malton | Known as the food capital of Yorkshire, Malton offers culinary experiences, charming shops, and a vibrant market atmosphere, appealing to food lovers. | Malton Market, Eden Camp Modern History Theme Museum, The Talbot Hotel, Monthly Food Festival, Malton Cookery School |
| Knaresborough | A picturesque market town by the River Nidd, famous for its stunning viaduct and charming streets, ideal for weekend getaways. | Knaresborough Castle, Mother Shipton's Cave, Knaresborough Viaduct, Bebra Gardens, River Nidd |
Understanding Airbnb License Requirements & STR Laws in Newby (2025)
While Newby, England, United Kingdom currently shows low STR regulations, specific Airbnb license requirements might still exist or change. Always verify the latest short term rental regulations and Airbnb license requirements directly with local government authorities for Newby to ensure full compliance before hosting.
(Source: AirROI data, 2025, finding no licensed listings among those analyzed)
Top Performing Airbnb Properties in Newby (2025)
Benchmark your potential! Explore examples of top-performing Airbnb properties in Newbybased on Trailing Twelve Month (TTM) revenue. Analyze their characteristics, revenue, occupancy rate, and ADR to understand what drives success in this market.
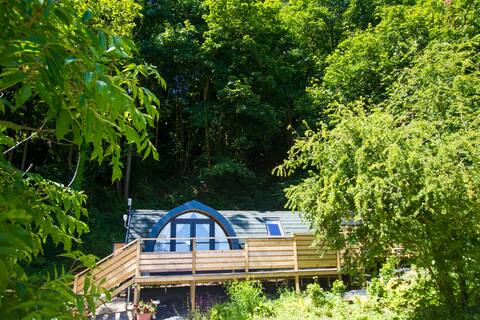
Farm Stay with Hot Tub, Coastal Views and Sea Air
Entire Place • 1 bedroom

High Croft
Entire Place • 4 bedrooms
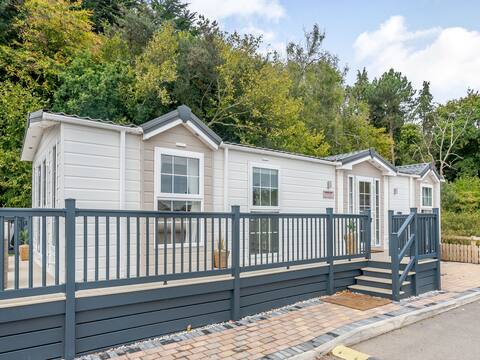
European Lodge - UK40848
Entire Place • 3 bedrooms
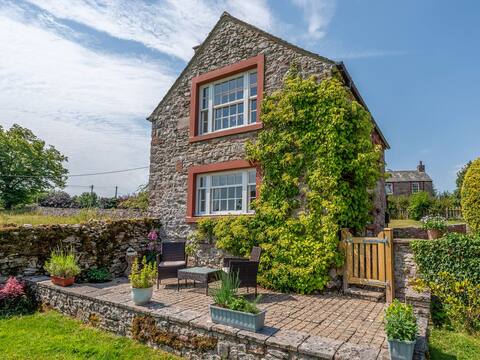
Garden Cottage
Entire Place • 1 bedroom
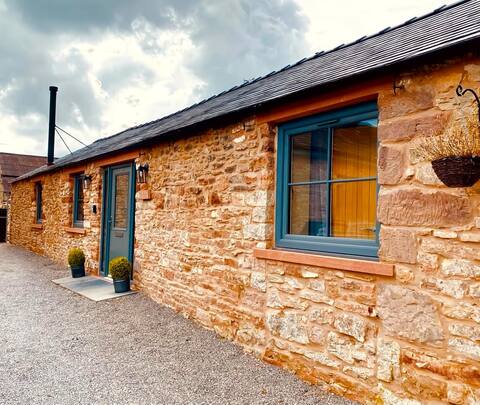
The Byre at Stanton House
Entire Place • 2 bedrooms

red Wood Lodge - uk40849
Entire Place • 2 bedrooms
Note: Performance varies based on location, size, amenities, seasonality, and management quality. Data reflects the past 12 months.
Top Performing Airbnb Hosts in Newby (2025)
Learn from the best! This table showcases top-performing Airbnb hosts in Newby based on the number of properties managed and estimated total revenue over the past year. Analyze their scale and performance metrics.
| Host Name | Properties | Grossing Revenue | Stay Reviews | Avg Rating |
|---|---|---|---|---|
| Cottages | 5 | $130,116 | 28 | 2.85/5.0 |
| Joseph | 1 | $77,935 | 93 | 4.97/5.0 |
| Ingrid Flute'S Yorks Hol Cotta | 1 | $67,916 | 3 | 5.00/5.0 |
| Cottages | 2 | $65,314 | 17 | 2.50/5.0 |
| Lindsay | 1 | $40,221 | 252 | 4.95/5.0 |
| Sarah | 1 | $33,278 | 58 | 4.88/5.0 |
| Host #185997688 | 3 | $24,428 | 1 | 0.00/5.0 |
| Sarah | 1 | $21,113 | 611 | 4.97/5.0 |
| Jon | 1 | $16,095 | 3 | 4.67/5.0 |
| Host #87397994 | 1 | $11,892 | 0 | 0.00/5.0 |
Analyzing the strategies of top hosts, such as their property selection, pricing, and guest communication, can offer valuable lessons for optimizing your own Airbnb operations in Newby.
Dive Deeper: Advanced Newby STR Market Data (2025)
Ready to unlock more insights? AirROI provides access to advanced metrics and comprehensive Airbnb data for Newby. Explore detailed analytics beyond this report to refine your investment strategy, optimize pricing, and maximize your vacation rental profits.
Explore Advanced MetricsNewby Short-Term Rental Market Composition (2025): Property & Room Types
Room Type Distribution
Property Type Distribution
Market Composition Insights for Newby
- The Newby Airbnb market composition is heavily skewed towards Entire Home/Apt listings, which make up 86.4% of the 22 active rentals. This indicates strong guest preference for privacy and space.
- Looking at the property type distribution in Newby, House properties are the most common (86.4%), reflecting the local real estate landscape.
- Houses represent a significant 86.4% portion, catering likely to families or larger groups.
- Smaller segments like apartment/condo, outdoor/unique, others (combined 13.5%) offer potential for unique stay experiences.
Newby Airbnb Room Capacity Analysis (2025): Bedroom Distribution
Distribution of Listings by Number of Bedrooms
Room Capacity Insights for Newby
- The dominant room capacity in Newby is 2 bedrooms listings, making up 36.4% of the market. This suggests a strong demand for properties suitable for couples or solo travelers.
- Together, 2 bedrooms and 1 bedroom properties represent 63.7% of the active Airbnb listings in Newby, indicating a high concentration in these sizes.
- A significant 27.3% of listings offer 3+ bedrooms, catering to larger groups and families seeking more space in Newby.
Newby Vacation Rental Guest Capacity Trends (2025)
Distribution of Listings by Guest Capacity
Guest Capacity Insights for Newby
- The most common guest capacity trend in Newby vacation rentals is listings accommodating 4 guests (31.8%). This suggests the primary traveler segment is likely small families or groups.
- Properties designed for 4 guests and 2 guests dominate the Newby STR market, accounting for 59.1% of listings.
- 27.2% of properties accommodate 6+ guests, serving the market segment for larger families or group travel in Newby.
- On average, properties in Newby are equipped to host 3.8 guests.
Newby Airbnb Booking Patterns (2025): Available vs. Booked Days
Available Days Distribution
Booked Days Distribution
Booking Pattern Insights for Newby
- The most common availability pattern in Newby falls within the 271-366 days range, representing 59.1% of listings. This suggests many properties have significant open periods on their calendars.
- Approximately 77.3% of listings show high availability (181+ days open annually), indicating potential for increased bookings or specific owner usage patterns.
- For booked days, the 31-90 days range is most frequent in Newby (31.8%), reflecting common guest stay durations or potential owner blocking patterns.
- A notable 22.7% of properties secure long booking periods (181+ days booked per year), highlighting successful long-term rental strategies or significant owner usage.
Newby Airbnb Minimum Stay Requirements Analysis
Distribution of Listings by Minimum Night Requirement
1 Night
6 listings
31.6% of total
2 Nights
4 listings
21.1% of total
3 Nights
2 listings
10.5% of total
4-6 Nights
1 listings
5.3% of total
30+ Nights
6 listings
31.6% of total
Key Insights
- The most prevalent minimum stay requirement in Newby is 1 Night, adopted by 31.6% of listings. This highlights the market's preference for shorter, flexible bookings.
- A significant segment (31.6%) caters to monthly stays (30+ nights) in Newby, pointing to opportunities in the extended-stay market.
Recommendations
- Align with the market by considering a 1 Night minimum stay, as 31.6% of Newby hosts use this setting.
- Explore offering discounts for stays of 30+ nights to attract the 31.6% of the market seeking extended stays.
- Adjust minimum nights based on seasonality – potentially shorter during low season and longer during peak demand periods in Newby.
Newby Airbnb Cancellation Policy Trends Analysis (2025)
Super Strict 60 Days
5 listings
35.7% of total
Moderate
3 listings
21.4% of total
Firm
2 listings
14.3% of total
Strict
4 listings
28.6% of total
Cancellation Policy Insights for Newby
- The prevailing Airbnb cancellation policy trend in Newby is Super Strict 60 Days, used by 35.7% of listings.
- There's a relatively balanced mix between guest-friendly (21.4%) and stricter (42.9%) policies, offering choices for different guest needs.
Recommendations for Hosts
- Consider adopting a Super Strict 60 Days policy to align with the 35.7% market standard in Newby.
- Regularly review your cancellation policy against competitors and market demand shifts in Newby.
Newby STR Booking Lead Time Analysis (2025)
Average Booking Lead Time by Month
Booking Lead Time Insights for Newby
- The overall average booking lead time for vacation rentals in Newby is 73 days.
- Guests book furthest in advance for stays during May (average 120 days), likely coinciding with peak travel demand or local events.
- The shortest booking windows occur for stays in February (average 45 days), indicating more last-minute travel plans during this time.
- Seasonally, Summer (93 days avg.) sees the longest lead times, while Fall (58 days avg.) has the shortest, reflecting typical travel planning cycles.
Recommendations for Hosts
- Use the overall average lead time (73 days) as a baseline for your pricing and availability strategy in Newby.
- For May stays, consider implementing length-of-stay discounts or slightly higher rates for bookings made less than 120 days out to capitalize on advance planning.
- Target marketing efforts for the Summer season well in advance (at least 93 days) to capture early planners.
- Monitor your own booking lead times against these Newby averages to identify opportunities for dynamic pricing adjustments.
Popular & Essential Airbnb Amenities in Newby (2025)
Amenity Prevalence
Amenity Insights for Newby
- Essential amenities in Newby that guests expect include: Wifi, Smoke alarm, Heating. Lacking these (any) could significantly impact bookings.
- Popular amenities like Free parking on premises, TV, Bed linens are common but not universal. Offering these can provide a competitive edge.
Recommendations for Hosts
- Ensure your listing includes all essential amenities for Newby: Wifi, Smoke alarm, Heating.
- Consider adding popular differentiators like Free parking on premises or TV to increase appeal.
- Highlight unique or less common amenities you offer (e.g., hot tub, dedicated workspace, EV charger) in your listing description and photos.
- Regularly check competitor amenities in Newby to stay competitive.
Newby Airbnb Guest Demographics & Profile Analysis (2025)
Guest Profile Summary for Newby
- The typical guest profile for Airbnb in Newby consists of primarily domestic travelers (95%), often arriving from nearby England, typically belonging to the Post-2000s (Gen Z/Alpha) group (50%), primarily speaking English or French.
- Domestic travelers account for 94.6% of guests.
- Key international markets include United Kingdom (94.6%) and Australia (1.8%).
- Top languages spoken are English (73.6%) followed by French (5.7%).
- A significant demographic segment is the Post-2000s (Gen Z/Alpha) group, representing 50% of guests.
Recommendations for Hosts
- Target domestic marketing efforts towards travelers from England and Leeds.
- Tailor amenities and listing descriptions to appeal to the dominant Post-2000s (Gen Z/Alpha) demographic (e.g., highlight fast WiFi, smart home features, local guides).
- Highlight unique local experiences or amenities relevant to the primary guest profile.
- Consider seasonal promotions aligned with peak travel times for key origin markets.
Nearby Short-Term Rental Market Comparison
How does the Newby Airbnb market stack up against its neighbors? Compare key performance metrics like average monthly revenue, ADR, and occupancy rates in surrounding areas to understand the broader regional STR landscape.
| Market | Active Properties | Monthly Revenue | Daily Rate | Avg. Occupancy |
|---|---|---|---|---|
| Grinton | 14 | $5,456 | $365.05 | 51% |
| Cartmel Fell | 17 | $4,719 | $331.68 | 52% |
| Stamford Bridge | 11 | $4,669 | $410.14 | 38% |
| Casterton | 11 | $4,578 | $300.82 | 51% |
| Appleby | 10 | $4,577 | $332.39 | 44% |
| Cark | 11 | $4,540 | $885.21 | 31% |
| Hayton | 13 | $4,333 | $239.53 | 60% |
| Watermillock | 16 | $4,281 | $274.03 | 50% |
| Kielder | 12 | $4,215 | $329.21 | 53% |
| Pooley Bridge | 13 | $4,145 | $317.26 | 52% |