Newark and Sherwood Airbnb Market Analysis 2025: Short Term Rental Data & Vacation Rental Statistics in England, United Kingdom
Is Airbnb profitable in Newark and Sherwood in 2025? Explore comprehensive Airbnb analytics for Newark and Sherwood, England, United Kingdom to uncover income potential. This 2025 STR market report for Newark and Sherwood, based on AirROI data from April 2024 to March 2025, reveals key trends in the market of 287 active listings.
Whether you're considering an Airbnb investment in Newark and Sherwood, optimizing your existing vacation rental, or exploring rental arbitrage opportunities, understanding the Newark and Sherwood Airbnb data is crucial. Leveraging the low regulation environment is key to maximizing your short term rental income potential. Let's dive into the specifics.
Key Newark and Sherwood Airbnb Performance Metrics Overview
Monthly Airbnb Revenue Variations & Income Potential in Newark and Sherwood (2025)
Understanding the monthly revenue variations for Airbnb listings in Newark and Sherwood is key to maximizing your short term rental income potential. Seasonality significantly impacts earnings. Our analysis, based on data from the past 12 months, shows that the peak revenue month for STRs in Newark and Sherwood is typically August, while February often presents the lowest earnings, highlighting opportunities for strategic pricing adjustments during shoulder and low seasons. Explore the typical Airbnb income in Newark and Sherwood across different performance tiers:
- Best-in-class properties (Top 10%) achieve $5,279+ monthly, often utilizing dynamic pricing and superior guest experiences.
- Strong performing properties (Top 25%) earn $3,138 or more, indicating effective management and desirable locations/amenities.
- Typical properties (Median) generate around $1,829 per month, representing the average market performance.
- Entry-level properties (Bottom 25%) see earnings around $928, often with potential for optimization.
Average Monthly Airbnb Earnings Trend in Newark and Sherwood
Newark and Sherwood Airbnb Occupancy Rate Trends (2025)
Maximize your bookings by understanding the Newark and Sherwood STR occupancy trends. Seasonal demand shifts significantly influence how often properties are booked. Typically, Augustsees the highest demand (peak season occupancy), while January experiences the lowest (low season). Effective strategies, like adjusting minimum stays or offering promotions, can boost occupancy during slower periods. Here's how different property tiers perform in Newark and Sherwood:
- Best-in-class properties (Top 10%) achieve 81%+ occupancy, indicating high desirability and potentially optimized availability.
- Strong performing properties (Top 25%) maintain 61% or higher occupancy, suggesting good market fit and guest satisfaction.
- Typical properties (Median) have an occupancy rate around 39%.
- Entry-level properties (Bottom 25%) average 21% occupancy, potentially facing higher vacancy.
Average Monthly Occupancy Rate Trend in Newark and Sherwood
Average Daily Rate (ADR) Airbnb Trends in Newark and Sherwood (2025)
Effective short term rental pricing strategy in Newark and Sherwood involves understanding monthly ADR fluctuations. The Average Daily Rate (ADR) for Airbnb in Newark and Sherwood typically peaks in August and dips lowest during March. Leveraging Airbnb dynamic pricing tools or strategies based on this seasonality can significantly boost revenue. Here's a look at the typical nightly rates achieved:
- Best-in-class properties (Top 10%) command rates of $327+ per night, often due to premium features or locations.
- Strong performing properties (Top 25%) achieve nightly rates of $213 or more.
- Typical properties (Median) charge around $131 per night.
- Entry-level properties (Bottom 25%) earn around $101 per night.
Average Daily Rate (ADR) Trend by Month in Newark and Sherwood
Get Live Newark and Sherwood Market Intelligence 👇

Explore Real-time Analytics
Airbnb Seasonality Analysis & Trends in Newark and Sherwood (2025)
Peak Season (August, May, April)
- Revenue averages $2,927 per month
- Occupancy rates average 44.8%
- Daily rates average $186
Shoulder Season
- Revenue averages $2,559 per month
- Occupancy maintains around 43.8%
- Daily rates hold near $185
Low Season (January, February, March)
- Revenue drops to average $2,074 per month
- Occupancy decreases to average 36.8%
- Daily rates adjust to average $176
Seasonality Insights for Newark and Sherwood
- The Airbnb seasonality in Newark and Sherwood shows moderate seasonality with distinct peak and low periods. While the sections above show seasonal averages, it's also insightful to look at the extremes:
- During the high season, the absolute peak month showcases Newark and Sherwood's highest earning potential, with monthly revenues capable of climbing to $3,024, occupancy reaching a high of 52.9%, and ADRs peaking at $190.
- Conversely, the slowest single month of the year, typically falling within the low season, marks the market's lowest point. In this month, revenue might dip to $2,052, occupancy could drop to 34.7%, and ADRs may adjust down to $175.
- Understanding both the seasonal averages and these monthly peaks and troughs in revenue, occupancy, and ADR is crucial for maximizing your Airbnb profit potential in Newark and Sherwood.
Seasonal Strategies for Maximizing Profit
- Peak Season: Maximize revenue through premium pricing and potentially longer minimum stays. Ensure high availability.
- Low Season: Offer competitive pricing, special promotions (e.g., extended stay discounts), and flexible cancellation policies. Target off-season travelers like remote workers or budget-conscious guests.
- Shoulder Seasons: Implement dynamic pricing that balances peak and low rates. Target weekend travelers or specific events. Offer slightly more flexible terms than peak season.
- Regularly analyze your own performance against these Newark and Sherwood seasonality benchmarks and adjust your pricing and availability strategy accordingly.
Best Areas for Airbnb Investment in Newark and Sherwood (2025)
Exploring the top neighborhoods for short-term rentals in Newark and Sherwood? This section highlights key areas, outlining why they are attractive for hosts and guests, along with notable local attractions. Consider these locations based on your target guest profile and investment strategy.
| Neighborhood / Area | Why Host Here? (Target Guests & Appeal) | Key Attractions & Landmarks |
|---|---|---|
| Newark Town Centre | The vibrant heart of Newark, offering a mix of culture, dining, and shopping. Ideal for tourists visiting historical sites and enjoying local events. | Newark Castle, National Civil War Centre, St. Mary Magdalene Church, Brayford Pool, Newark Flea Market |
| Southwell | A picturesque market town known for its beautiful Minster and historic architecture. Popular with visitors seeking a quaint, English experience. | Southwell Minster, The Bramley Apple, Southwell Workhouse, Southwell Golf Club, Kirklington Hall |
| Balderton | A suburban area close to Newark, appealing for families and those seeking a quieter environment while being a short distance from the town center. | Balderton Lake, Local parks and recreational areas, Community events and activities |
| Fiskerton | A charming village near Newark that attracts visitors looking for a peaceful retreat while still being close to urban amenities. | Fiskerton Nature Reserve, Village green, Riverside walks |
| Caunton | A small village offering a rural escape with lovely landscapes, appealing to guests looking for a countryside getaway. | Caunton Church, Countryside walks, Local farms and markets |
| Winthorpe | Located near the River Trent, Winthorpe is popular for its scenic views and outdoor activities. Suitable for guests wanting to explore nature. | Winthorpe Beach, River Trent walks, Local wildlife |
| Collingham | A tranquil village with good transport connections to Newark. Attracts visitors wanting to explore both rural and urban attractions. | Collingham Green, Historic village features, Biking paths |
| North Muskham | Offering a peaceful village atmosphere that attracts those looking for a quiet stay near Newark, with beautiful rural surroundings. | Historic St. Wilfrid's Church, River access for walks, Local countryside trails |
Understanding Airbnb License Requirements & STR Laws in Newark and Sherwood (2025)
While Newark and Sherwood, England, United Kingdom currently shows low STR regulations, specific Airbnb license requirements might still exist or change. Always verify the latest short term rental regulations and Airbnb license requirements directly with local government authorities for Newark and Sherwood to ensure full compliance before hosting.
(Source: AirROI data, 2025, based on 0% licensed listings)
Top Performing Airbnb Properties in Newark and Sherwood (2025)
Benchmark your potential! Explore examples of top-performing Airbnb properties in Newark and Sherwoodbased on Trailing Twelve Month (TTM) revenue. Analyze their characteristics, revenue, occupancy rate, and ADR to understand what drives success in this market.
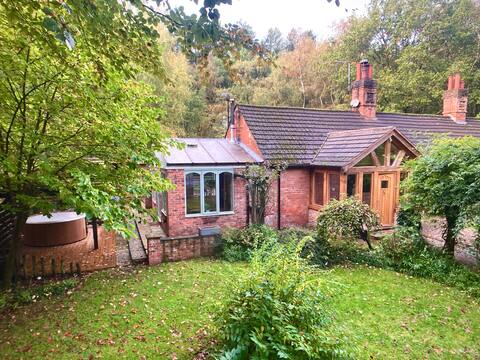
In the ❤️ of Sherwood Forest, cosy cottage for 12
Entire Place • 6 bedrooms
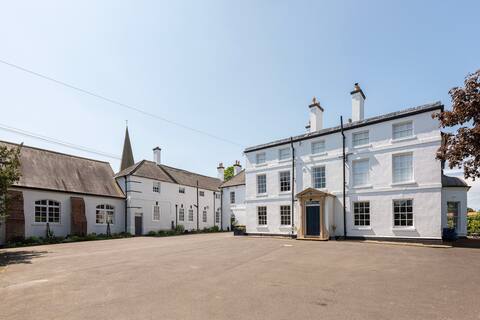
South Wing of Edwinstowe Hall
Entire Place • 5 bedrooms
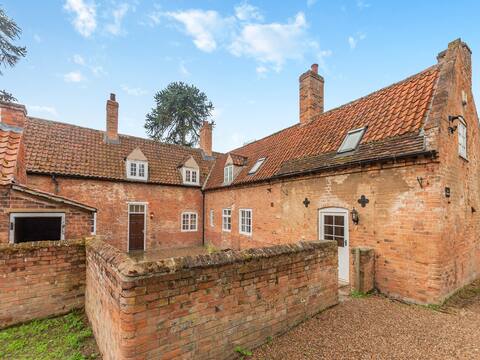
The Farmhouse - UK45171
Entire Place • 4 bedrooms

Beautiful Rambling Cottage for 14
Entire Place • 7 bedrooms

Idyllic Farmhouse in the Countryside
Entire Place • 6 bedrooms

The Penthouse at The Old Cinema
Entire Place • 4 bedrooms
Note: Performance varies based on location, size, amenities, seasonality, and management quality. Data reflects the past 12 months.
Top Performing Airbnb Hosts in Newark and Sherwood (2025)
Learn from the best! This table showcases top-performing Airbnb hosts in Newark and Sherwood based on the number of properties managed and estimated total revenue over the past year. Analyze their scale and performance metrics.
| Host Name | Properties | Grossing Revenue | Stay Reviews | Avg Rating |
|---|---|---|---|---|
| Cottages | 15 | $631,207 | 119 | 3.90/5.0 |
| James | 2 | $294,084 | 404 | 4.92/5.0 |
| Laura | 9 | $250,366 | 382 | 4.96/5.0 |
| Brittany | 4 | $219,887 | 459 | 4.97/5.0 |
| Hoseasons | 12 | $210,364 | 22 | 2.48/5.0 |
| Thoresby Estate | 2 | $142,459 | 118 | 4.92/5.0 |
| Rachael | 1 | $141,365 | 63 | 4.98/5.0 |
| Siobhan | 3 | $129,634 | 31 | 4.37/5.0 |
| Amanda | 3 | $120,191 | 110 | 4.90/5.0 |
| Sally | 1 | $117,013 | 32 | 4.97/5.0 |
Analyzing the strategies of top hosts, such as their property selection, pricing, and guest communication, can offer valuable lessons for optimizing your own Airbnb operations in Newark and Sherwood.
Dive Deeper: Advanced Newark and Sherwood STR Market Data (2025)
Ready to unlock more insights? AirROI provides access to advanced metrics and comprehensive Airbnb data for Newark and Sherwood. Explore detailed analytics beyond this report to refine your investment strategy, optimize pricing, and maximize your vacation rental profits.
Explore Advanced MetricsNewark and Sherwood Short-Term Rental Market Composition (2025): Property & Room Types
Room Type Distribution
Property Type Distribution
Market Composition Insights for Newark and Sherwood
- The Newark and Sherwood Airbnb market composition is heavily skewed towards Entire Home/Apt listings, which make up 83.6% of the 287 active rentals. This indicates strong guest preference for privacy and space.
- Looking at the property type distribution in Newark and Sherwood, House properties are the most common (54%), reflecting the local real estate landscape.
- Houses represent a significant 54% portion, catering likely to families or larger groups.
- The presence of 8.4% Hotel/Boutique listings indicates integration with traditional hospitality.
- Smaller segments like others (combined 4.5%) offer potential for unique stay experiences.
Newark and Sherwood Airbnb Room Capacity Analysis (2025): Bedroom Distribution
Distribution of Listings by Number of Bedrooms
Room Capacity Insights for Newark and Sherwood
- The dominant room capacity in Newark and Sherwood is 1 bedroom listings, making up 38.3% of the market. This suggests a strong demand for properties suitable for couples or solo travelers.
- Together, 1 bedroom and 2 bedrooms properties represent 68.6% of the active Airbnb listings in Newark and Sherwood, indicating a high concentration in these sizes.
- A significant 20.9% of listings offer 3+ bedrooms, catering to larger groups and families seeking more space in Newark and Sherwood.
Newark and Sherwood Vacation Rental Guest Capacity Trends (2025)
Distribution of Listings by Guest Capacity
Guest Capacity Insights for Newark and Sherwood
- The most common guest capacity trend in Newark and Sherwood vacation rentals is listings accommodating 2 guests (30.3%). This suggests the primary traveler segment is likely couples or solo travelers.
- Properties designed for 2 guests and 4 guests dominate the Newark and Sherwood STR market, accounting for 56.8% of listings.
- 19.8% of properties accommodate 6+ guests, serving the market segment for larger families or group travel in Newark and Sherwood.
- On average, properties in Newark and Sherwood are equipped to host 3.6 guests.
Newark and Sherwood Airbnb Booking Patterns (2025): Available vs. Booked Days
Available Days Distribution
Booked Days Distribution
Booking Pattern Insights for Newark and Sherwood
- The most common availability pattern in Newark and Sherwood falls within the 181-270 days range, representing 35.9% of listings. This suggests many properties have significant open periods on their calendars.
- Approximately 69.3% of listings show high availability (181+ days open annually), indicating potential for increased bookings or specific owner usage patterns.
- For booked days, the 91-180 days range is most frequent in Newark and Sherwood (35.2%), reflecting common guest stay durations or potential owner blocking patterns.
- A notable 32.0% of properties secure long booking periods (181+ days booked per year), highlighting successful long-term rental strategies or significant owner usage.
Newark and Sherwood Airbnb Minimum Stay Requirements Analysis
Distribution of Listings by Minimum Night Requirement
1 Night
108 listings
39.4% of total
2 Nights
93 listings
33.9% of total
3 Nights
19 listings
6.9% of total
7-29 Nights
10 listings
3.6% of total
30+ Nights
44 listings
16.1% of total
Key Insights
- The most prevalent minimum stay requirement in Newark and Sherwood is 1 Night, adopted by 39.4% of listings. This highlights the market's preference for shorter, flexible bookings.
- A strong majority (73.3%) of the Newark and Sherwood Airbnb data shows acceptance of very short stays (1-2 nights), indicating a dynamic, high-turnover market.
- A significant segment (16.1%) caters to monthly stays (30+ nights) in Newark and Sherwood, pointing to opportunities in the extended-stay market.
Recommendations
- Align with the market by considering a 1 Night minimum stay, as 39.4% of Newark and Sherwood hosts use this setting.
- Explore offering discounts for stays of 30+ nights to attract the 16.1% of the market seeking extended stays.
- Adjust minimum nights based on seasonality – potentially shorter during low season and longer during peak demand periods in Newark and Sherwood.
Newark and Sherwood Airbnb Cancellation Policy Trends Analysis (2025)
Non-refundable
3 listings
1.2% of total
Super Strict 30 Days
1 listings
0.4% of total
Super Strict 60 Days
21 listings
8.1% of total
Refundable
5 listings
1.9% of total
Flexible
70 listings
27% of total
Moderate
84 listings
32.4% of total
Firm
34 listings
13.1% of total
Strict
41 listings
15.8% of total
Cancellation Policy Insights for Newark and Sherwood
- The prevailing Airbnb cancellation policy trend in Newark and Sherwood is Moderate, used by 32.4% of listings.
- There's a relatively balanced mix between guest-friendly (59.4%) and stricter (28.9%) policies, offering choices for different guest needs.
Recommendations for Hosts
- Consider adopting a Moderate policy to align with the 32.4% market standard in Newark and Sherwood.
- Regularly review your cancellation policy against competitors and market demand shifts in Newark and Sherwood.
Newark and Sherwood STR Booking Lead Time Analysis (2025)
Average Booking Lead Time by Month
Booking Lead Time Insights for Newark and Sherwood
- The overall average booking lead time for vacation rentals in Newark and Sherwood is 55 days.
- Guests book furthest in advance for stays during June (average 89 days), likely coinciding with peak travel demand or local events.
- The shortest booking windows occur for stays in February (average 38 days), indicating more last-minute travel plans during this time.
- Seasonally, Summer (85 days avg.) sees the longest lead times, while Winter (50 days avg.) has the shortest, reflecting typical travel planning cycles.
Recommendations for Hosts
- Use the overall average lead time (55 days) as a baseline for your pricing and availability strategy in Newark and Sherwood.
- For June stays, consider implementing length-of-stay discounts or slightly higher rates for bookings made less than 89 days out to capitalize on advance planning.
- Target marketing efforts for the Summer season well in advance (at least 85 days) to capture early planners.
- Monitor your own booking lead times against these Newark and Sherwood averages to identify opportunities for dynamic pricing adjustments.
Popular & Essential Airbnb Amenities in Newark and Sherwood (2025)
Amenity Prevalence
Amenity Insights for Newark and Sherwood
- Essential amenities in Newark and Sherwood that guests expect include: Smoke alarm, Heating. Lacking these (any) could significantly impact bookings.
- Popular amenities like Wifi, TV, Hot water are common but not universal. Offering these can provide a competitive edge.
- Warning: Wifi is not universally provided but is considered essential globally. Ensure reliable Wifi is offered.
Recommendations for Hosts
- Ensure your listing includes all essential amenities for Newark and Sherwood: Smoke alarm, Heating.
- Prioritize adding missing essentials: Smoke alarm, Heating.
- Consider adding popular differentiators like Wifi or TV to increase appeal.
- Highlight unique or less common amenities you offer (e.g., hot tub, dedicated workspace, EV charger) in your listing description and photos.
- Regularly check competitor amenities in Newark and Sherwood to stay competitive.
Newark and Sherwood Airbnb Guest Demographics & Profile Analysis (2025)
Guest Profile Summary for Newark and Sherwood
- The typical guest profile for Airbnb in Newark and Sherwood consists of primarily domestic travelers (91%), often arriving from nearby England, typically belonging to the Post-2000s (Gen Z/Alpha) group (50%), primarily speaking English or French.
- Domestic travelers account for 90.8% of guests.
- Key international markets include United Kingdom (90.8%) and United States (2.8%).
- Top languages spoken are English (74.4%) followed by French (6.4%).
- A significant demographic segment is the Post-2000s (Gen Z/Alpha) group, representing 50% of guests.
Recommendations for Hosts
- Target domestic marketing efforts towards travelers from England and London.
- Tailor amenities and listing descriptions to appeal to the dominant Post-2000s (Gen Z/Alpha) demographic (e.g., highlight fast WiFi, smart home features, local guides).
- Highlight unique local experiences or amenities relevant to the primary guest profile.
- Consider seasonal promotions aligned with peak travel times for key origin markets.
Nearby Short-Term Rental Market Comparison
How does the Newark and Sherwood Airbnb market stack up against its neighbors? Compare key performance metrics like average monthly revenue, ADR, and occupancy rates in surrounding areas to understand the broader regional STR landscape.
| Market | Active Properties | Monthly Revenue | Daily Rate | Avg. Occupancy |
|---|---|---|---|---|
| Grinton | 14 | $5,456 | $365.05 | 51% |
| Stamford Bridge | 11 | $4,669 | $410.14 | 38% |
| Appleby | 10 | $4,577 | $332.39 | 44% |
| Flore | 10 | $4,534 | $347.03 | 40% |
| Hayton | 13 | $4,333 | $239.53 | 60% |
| Bishop Monkton | 11 | $3,999 | $272.00 | 48% |
| Escrick | 10 | $3,849 | $322.07 | 44% |
| Southburn | 18 | $3,837 | $225.12 | 49% |
| Ravensworth | 10 | $3,717 | $203.76 | 57% |
| Blubberhouses | 11 | $3,457 | $361.37 | 41% |