Nettlestone Airbnb Market Analysis 2025: Short Term Rental Data & Vacation Rental Statistics in England, United Kingdom
Is Airbnb profitable in Nettlestone in 2025? Explore comprehensive Airbnb analytics for Nettlestone, England, United Kingdom to uncover income potential. This 2025 STR market report for Nettlestone, based on AirROI data from April 2024 to March 2025, reveals key trends in the niche market of 26 active listings.
Whether you're considering an Airbnb investment in Nettlestone, optimizing your existing vacation rental, or exploring rental arbitrage opportunities, understanding the Nettlestone Airbnb data is crucial. Leveraging the low regulation environment is key to maximizing your short term rental income potential. Let's dive into the specifics.
Key Nettlestone Airbnb Performance Metrics Overview
Monthly Airbnb Revenue Variations & Income Potential in Nettlestone (2025)
Understanding the monthly revenue variations for Airbnb listings in Nettlestone is key to maximizing your short term rental income potential. Seasonality significantly impacts earnings. Our analysis, based on data from the past 12 months, shows that the peak revenue month for STRs in Nettlestone is typically August, while February often presents the lowest earnings, highlighting opportunities for strategic pricing adjustments during shoulder and low seasons. Explore the typical Airbnb income in Nettlestone across different performance tiers:
- Best-in-class properties (Top 10%) achieve $12,497+ monthly, often utilizing dynamic pricing and superior guest experiences.
- Strong performing properties (Top 25%) earn $6,714 or more, indicating effective management and desirable locations/amenities.
- Typical properties (Median) generate around $3,525 per month, representing the average market performance.
- Entry-level properties (Bottom 25%) see earnings around $1,975, often with potential for optimization.
Average Monthly Airbnb Earnings Trend in Nettlestone
Nettlestone Airbnb Occupancy Rate Trends (2025)
Maximize your bookings by understanding the Nettlestone STR occupancy trends. Seasonal demand shifts significantly influence how often properties are booked. Typically, Augustsees the highest demand (peak season occupancy), while January experiences the lowest (low season). Effective strategies, like adjusting minimum stays or offering promotions, can boost occupancy during slower periods. Here's how different property tiers perform in Nettlestone:
- Best-in-class properties (Top 10%) achieve 81%+ occupancy, indicating high desirability and potentially optimized availability.
- Strong performing properties (Top 25%) maintain 56% or higher occupancy, suggesting good market fit and guest satisfaction.
- Typical properties (Median) have an occupancy rate around 30%.
- Entry-level properties (Bottom 25%) average 17% occupancy, potentially facing higher vacancy.
Average Monthly Occupancy Rate Trend in Nettlestone
Average Daily Rate (ADR) Airbnb Trends in Nettlestone (2025)
Effective short term rental pricing strategy in Nettlestone involves understanding monthly ADR fluctuations. The Average Daily Rate (ADR) for Airbnb in Nettlestone typically peaks in August and dips lowest during February. Leveraging Airbnb dynamic pricing tools or strategies based on this seasonality can significantly boost revenue. Here's a look at the typical nightly rates achieved:
- Best-in-class properties (Top 10%) command rates of $633+ per night, often due to premium features or locations.
- Strong performing properties (Top 25%) achieve nightly rates of $467 or more.
- Typical properties (Median) charge around $302 per night.
- Entry-level properties (Bottom 25%) earn around $208 per night.
Average Daily Rate (ADR) Trend by Month in Nettlestone
Get Live Nettlestone Market Intelligence 👇

Explore Real-time Analytics
Airbnb Seasonality Analysis & Trends in Nettlestone (2025)
Peak Season (August, June, July)
- Revenue averages $9,035 per month
- Occupancy rates average 57.1%
- Daily rates average $413
Shoulder Season
- Revenue averages $5,534 per month
- Occupancy maintains around 35.4%
- Daily rates hold near $384
Low Season (January, February, March)
- Revenue drops to average $2,995 per month
- Occupancy decreases to average 23.4%
- Daily rates adjust to average $365
Seasonality Insights for Nettlestone
- The Airbnb seasonality in Nettlestone shows highly seasonal trends requiring careful strategy. While the sections above show seasonal averages, it's also insightful to look at the extremes:
- During the high season, the absolute peak month showcases Nettlestone's highest earning potential, with monthly revenues capable of climbing to $10,568, occupancy reaching a high of 73.3%, and ADRs peaking at $420.
- Conversely, the slowest single month of the year, typically falling within the low season, marks the market's lowest point. In this month, revenue might dip to $2,199, occupancy could drop to 19.7%, and ADRs may adjust down to $360.
- Understanding both the seasonal averages and these monthly peaks and troughs in revenue, occupancy, and ADR is crucial for maximizing your Airbnb profit potential in Nettlestone.
Seasonal Strategies for Maximizing Profit
- Peak Season: Maximize revenue through premium pricing and potentially longer minimum stays. Ensure high availability.
- Low Season: Offer competitive pricing, special promotions (e.g., extended stay discounts), and flexible cancellation policies. Target off-season travelers like remote workers or budget-conscious guests.
- Shoulder Seasons: Implement dynamic pricing that balances peak and low rates. Target weekend travelers or specific events. Offer slightly more flexible terms than peak season.
- Regularly analyze your own performance against these Nettlestone seasonality benchmarks and adjust your pricing and availability strategy accordingly.
Best Areas for Airbnb Investment in Nettlestone (2025)
Exploring the top neighborhoods for short-term rentals in Nettlestone? This section highlights key areas, outlining why they are attractive for hosts and guests, along with notable local attractions. Consider these locations based on your target guest profile and investment strategy.
| Neighborhood / Area | Why Host Here? (Target Guests & Appeal) | Key Attractions & Landmarks |
|---|---|---|
| Seaview | Charming coastal village with scenic views, electric atmosphere during summer months. Ideal for families and guests seeking relaxation by the sea. | Seaview Beach, The Old Village, Seaview Wildlife Encounter, The Boat House Cafe, Seaview Sailing Club |
| Ryde | Lively seaside town known for its beautiful beaches and ferry connections to the mainland. Popular among tourists for its shopping and dining options. | Ryde Beach, Ryde Pier, Ryde Esplanade, Isle of Wight Steam Railway, Appley Park |
| Bembridge | Quaint village with a strong maritime heritage and stunning coastal scenery. Attracts couples and nature lovers looking for a peaceful retreat. | Bembridge Beach, The Lifeboat Station, Forked Lightning Cycle Trails, Bembridge Windmill |
| Sandown | Popular resort town with long sandy beaches and family-friendly attractions. Great for hosting guests looking for fun and leisure activities. | Sandown Beach, Dinosaur Isle, Amazon World Zoo Park, Sandown Pier, Heritage Centre |
| Cowes | Famous for yachting and sailing events, this bustling town appeals to water sports enthusiasts and those attending the Cowes Week. | Cowes Yacht Haven, Egypt Point, Northwood Park, Cowes Maritime Museum |
| Shanklin | A picturesque town known for its thatched cottages and beach, perfect for holidaymakers seeking a quintessential beach vacation. | Shanklin Beach, Shanklin Chine, The Old Village, Rylstone Gardens |
| Newport | The main town on the island with shopping, dining, and cultural attractions. A central hub for visitors looking to explore the Isle of Wight. | Carisbrooke Castle, Newport Roman Villa, The Isle of Wight Museum, Quay Arts |
| Freshwater | Home to stunning coastal cliffs and the famous Needles, this area attracts nature lovers and hikers looking for outdoor adventures. | Freshwater Bay, The Needles, Alum Bay, Dimbola Museum and Galleries |
Understanding Airbnb License Requirements & STR Laws in Nettlestone (2025)
While Nettlestone, England, United Kingdom currently shows low STR regulations, specific Airbnb license requirements might still exist or change. Always verify the latest short term rental regulations and Airbnb license requirements directly with local government authorities for Nettlestone to ensure full compliance before hosting.
(Source: AirROI data, 2025, finding no licensed listings among those analyzed)
Top Performing Airbnb Properties in Nettlestone (2025)
Benchmark your potential! Explore examples of top-performing Airbnb properties in Nettlestonebased on Trailing Twelve Month (TTM) revenue. Analyze their characteristics, revenue, occupancy rate, and ADR to understand what drives success in this market.

Fabulous family seaside house
Entire Place • 5 bedrooms
Fairy Hill Cottage-Seaview near Beach
Entire Place • 3 bedrooms

Stunning 5 Bedroom House
Entire Place • 5 bedrooms

Stunning converted Coach House with rural location
Entire Place • 5 bedrooms
Gull House, Seaview
Entire Place • 4 bedrooms
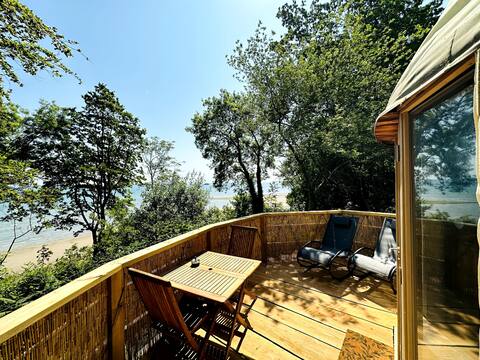
Caribbean Corner, Priory Bay, Isle of Wight
Entire Place • 1 bedroom
Note: Performance varies based on location, size, amenities, seasonality, and management quality. Data reflects the past 12 months.
Top Performing Airbnb Hosts in Nettlestone (2025)
Learn from the best! This table showcases top-performing Airbnb hosts in Nettlestone based on the number of properties managed and estimated total revenue over the past year. Analyze their scale and performance metrics.
| Host Name | Properties | Grossing Revenue | Stay Reviews | Avg Rating |
|---|---|---|---|---|
| The Island Holiday Company | 2 | $226,913 | 11 | 4.88/5.0 |
| Sophie | 1 | $195,994 | 8 | 5.00/5.0 |
| Pandora | 1 | $132,581 | 29 | 4.90/5.0 |
| Daisy | 3 | $111,643 | 28 | 4.81/5.0 |
| Andrew | 2 | $103,982 | 20 | 4.80/5.0 |
| Andrew | 2 | $89,490 | 212 | 4.83/5.0 |
| Melinda | 1 | $57,970 | 52 | 4.98/5.0 |
| Jacqueline | 1 | $42,405 | 49 | 4.96/5.0 |
| Karrie | 1 | $38,842 | 4 | 5.00/5.0 |
| Catherine | 1 | $36,808 | 46 | 4.78/5.0 |
Analyzing the strategies of top hosts, such as their property selection, pricing, and guest communication, can offer valuable lessons for optimizing your own Airbnb operations in Nettlestone.
Dive Deeper: Advanced Nettlestone STR Market Data (2025)
Ready to unlock more insights? AirROI provides access to advanced metrics and comprehensive Airbnb data for Nettlestone. Explore detailed analytics beyond this report to refine your investment strategy, optimize pricing, and maximize your vacation rental profits.
Explore Advanced MetricsNettlestone Short-Term Rental Market Composition (2025): Property & Room Types
Room Type Distribution
Property Type Distribution
Market Composition Insights for Nettlestone
- The Nettlestone Airbnb market composition is heavily skewed towards Entire Home/Apt listings, which make up 100% of the 26 active rentals. This indicates strong guest preference for privacy and space.
- Looking at the property type distribution in Nettlestone, House properties are the most common (76.9%), reflecting the local real estate landscape.
- Houses represent a significant 76.9% portion, catering likely to families or larger groups.
Nettlestone Airbnb Room Capacity Analysis (2025): Bedroom Distribution
Distribution of Listings by Number of Bedrooms
Room Capacity Insights for Nettlestone
- The dominant room capacity in Nettlestone is 5+ bedrooms listings, making up 26.9% of the market. This suggests a strong demand for properties suitable for families or small groups.
- Together, 5+ bedrooms and 2 bedrooms properties represent 46.1% of the active Airbnb listings in Nettlestone, indicating a high concentration in these sizes.
- A significant 65.3% of listings offer 3+ bedrooms, catering to larger groups and families seeking more space in Nettlestone.
Nettlestone Vacation Rental Guest Capacity Trends (2025)
Distribution of Listings by Guest Capacity
Guest Capacity Insights for Nettlestone
- The most common guest capacity trend in Nettlestone vacation rentals is listings accommodating 8+ guests (53.8%). This suggests the primary traveler segment is likely larger groups.
- Properties designed for 8+ guests and 6 guests dominate the Nettlestone STR market, accounting for 73.0% of listings.
- 73.0% of properties accommodate 6+ guests, serving the market segment for larger families or group travel in Nettlestone.
- On average, properties in Nettlestone are equipped to host 6.2 guests.
Nettlestone Airbnb Booking Patterns (2025): Available vs. Booked Days
Available Days Distribution
Booked Days Distribution
Booking Pattern Insights for Nettlestone
- The most common availability pattern in Nettlestone falls within the 271-366 days range, representing 42.3% of listings. This suggests many properties have significant open periods on their calendars.
- Approximately 80.8% of listings show high availability (181+ days open annually), indicating potential for increased bookings or specific owner usage patterns.
- For booked days, the 91-180 days range is most frequent in Nettlestone (38.5%), reflecting common guest stay durations or potential owner blocking patterns.
- A notable 19.2% of properties secure long booking periods (181+ days booked per year), highlighting successful long-term rental strategies or significant owner usage.
Nettlestone Airbnb Minimum Stay Requirements Analysis
Distribution of Listings by Minimum Night Requirement
1 Night
3 listings
12.5% of total
2 Nights
4 listings
16.7% of total
3 Nights
7 listings
29.2% of total
4-6 Nights
3 listings
12.5% of total
7-29 Nights
1 listings
4.2% of total
30+ Nights
6 listings
25% of total
Key Insights
- The most prevalent minimum stay requirement in Nettlestone is 3 Nights, adopted by 29.2% of listings. This highlights the market's preference for longer commitments.
- A significant segment (25%) caters to monthly stays (30+ nights) in Nettlestone, pointing to opportunities in the extended-stay market.
Recommendations
- Align with the market by considering a 3 Nights minimum stay, as 29.2% of Nettlestone hosts use this setting.
- If feasible, allowing 1-night stays, especially midweek or during low season, could capture last-minute bookings, as only 12.5% currently do.
- Explore offering discounts for stays of 30+ nights to attract the 25% of the market seeking extended stays.
- Adjust minimum nights based on seasonality – potentially shorter during low season and longer during peak demand periods in Nettlestone.
Nettlestone Airbnb Cancellation Policy Trends Analysis (2025)
Super Strict 30 Days
3 listings
13.6% of total
Super Strict 60 Days
1 listings
4.5% of total
Flexible
2 listings
9.1% of total
Moderate
3 listings
13.6% of total
Firm
11 listings
50% of total
Strict
2 listings
9.1% of total
Cancellation Policy Insights for Nettlestone
- The prevailing Airbnb cancellation policy trend in Nettlestone is Firm, used by 50% of listings.
- A majority (59.1%) of hosts in Nettlestone utilize Firm or Strict policies, indicating a market where hosts prioritize booking security.
- Strict cancellation policies are quite rare (9.1%), potentially making listings with this policy less competitive unless justified by high demand or property type.
Recommendations for Hosts
- Consider adopting a Firm policy to align with the 50% market standard in Nettlestone.
- Using a Strict policy might deter some guests, as only 9.1% of listings use it. Evaluate if potential revenue protection outweighs possible lower booking rates.
- Regularly review your cancellation policy against competitors and market demand shifts in Nettlestone.
Nettlestone STR Booking Lead Time Analysis (2025)
Average Booking Lead Time by Month
Booking Lead Time Insights for Nettlestone
- The overall average booking lead time for vacation rentals in Nettlestone is 74 days.
- Guests book furthest in advance for stays during July (average 138 days), likely coinciding with peak travel demand or local events.
- The shortest booking windows occur for stays in January (average 32 days), indicating more last-minute travel plans during this time.
- Seasonally, Summer (114 days avg.) sees the longest lead times, while Winter (51 days avg.) has the shortest, reflecting typical travel planning cycles.
Recommendations for Hosts
- Use the overall average lead time (74 days) as a baseline for your pricing and availability strategy in Nettlestone.
- For July stays, consider implementing length-of-stay discounts or slightly higher rates for bookings made less than 138 days out to capitalize on advance planning.
- Target marketing efforts for the Summer season well in advance (at least 114 days) to capture early planners.
- Monitor your own booking lead times against these Nettlestone averages to identify opportunities for dynamic pricing adjustments.
Popular & Essential Airbnb Amenities in Nettlestone (2025)
Amenity Prevalence
Amenity Insights for Nettlestone
- Essential amenities in Nettlestone that guests expect include: Wifi, Heating, Kitchen, Refrigerator, Smoke alarm. Lacking these (any) could significantly impact bookings.
- Popular amenities like TV, Carbon monoxide alarm, Backyard are common but not universal. Offering these can provide a competitive edge.
Recommendations for Hosts
- Ensure your listing includes all essential amenities for Nettlestone: Wifi, Heating, Kitchen, Refrigerator, Smoke alarm.
- Prioritize adding missing essentials: Kitchen, Refrigerator, Smoke alarm.
- Consider adding popular differentiators like TV or Carbon monoxide alarm to increase appeal.
- Highlight unique or less common amenities you offer (e.g., hot tub, dedicated workspace, EV charger) in your listing description and photos.
- Regularly check competitor amenities in Nettlestone to stay competitive.
Nettlestone Airbnb Guest Demographics & Profile Analysis (2025)
Guest Profile Summary for Nettlestone
- The typical guest profile for Airbnb in Nettlestone consists of primarily domestic travelers (92%), often arriving from nearby England, typically belonging to the Post-2000s (Gen Z/Alpha) group (50%), primarily speaking English or Spanish.
- Domestic travelers account for 91.9% of guests.
- Key international markets include United Kingdom (91.9%) and United States (1.3%).
- Top languages spoken are English (66.1%) followed by Spanish (8.5%).
- A significant demographic segment is the Post-2000s (Gen Z/Alpha) group, representing 50% of guests.
Recommendations for Hosts
- Target domestic marketing efforts towards travelers from England and London.
- Tailor amenities and listing descriptions to appeal to the dominant Post-2000s (Gen Z/Alpha) demographic (e.g., highlight fast WiFi, smart home features, local guides).
- Highlight unique local experiences or amenities relevant to the primary guest profile.
- Consider seasonal promotions aligned with peak travel times for key origin markets.
Nearby Short-Term Rental Market Comparison
How does the Nettlestone Airbnb market stack up against its neighbors? Compare key performance metrics like average monthly revenue, ADR, and occupancy rates in surrounding areas to understand the broader regional STR landscape.
| Market | Active Properties | Monthly Revenue | Daily Rate | Avg. Occupancy |
|---|---|---|---|---|
| Englishcombe | 13 | $8,558 | $573.69 | 49% |
| Dorney | 12 | $8,335 | $622.48 | 45% |
| Chew Magna | 14 | $6,649 | $399.59 | 46% |
| Lambourn | 11 | $6,081 | $669.47 | 28% |
| City of Westminster | 1,327 | $6,043 | $486.66 | 52% |
| Long Sutton | 17 | $5,726 | $383.88 | 46% |
| Stoke St. Michael | 10 | $5,277 | $424.04 | 42% |
| Winsham | 10 | $5,154 | $484.22 | 52% |
| Oldland Common | 13 | $5,093 | $355.47 | 43% |
| Wraysbury | 14 | $4,719 | $396.18 | 46% |