Mungrisdale Airbnb Market Analysis 2025: Short Term Rental Data & Vacation Rental Statistics in England, United Kingdom
Is Airbnb profitable in Mungrisdale in 2025? Explore comprehensive Airbnb analytics for Mungrisdale, England, United Kingdom to uncover income potential. This 2025 STR market report for Mungrisdale, based on AirROI data from April 2024 to March 2025, reveals key trends in the niche market of 31 active listings.
Whether you're considering an Airbnb investment in Mungrisdale, optimizing your existing vacation rental, or exploring rental arbitrage opportunities, understanding the Mungrisdale Airbnb data is crucial. Leveraging the low regulation environment is key to maximizing your short term rental income potential. Let's dive into the specifics.
Key Mungrisdale Airbnb Performance Metrics Overview
Monthly Airbnb Revenue Variations & Income Potential in Mungrisdale (2025)
Understanding the monthly revenue variations for Airbnb listings in Mungrisdale is key to maximizing your short term rental income potential. Seasonality significantly impacts earnings. Our analysis, based on data from the past 12 months, shows that the peak revenue month for STRs in Mungrisdale is typically August, while January often presents the lowest earnings, highlighting opportunities for strategic pricing adjustments during shoulder and low seasons. Explore the typical Airbnb income in Mungrisdale across different performance tiers:
- Best-in-class properties (Top 10%) achieve $6,048+ monthly, often utilizing dynamic pricing and superior guest experiences.
- Strong performing properties (Top 25%) earn $4,305 or more, indicating effective management and desirable locations/amenities.
- Typical properties (Median) generate around $2,334 per month, representing the average market performance.
- Entry-level properties (Bottom 25%) see earnings around $1,091, often with potential for optimization.
Average Monthly Airbnb Earnings Trend in Mungrisdale
Mungrisdale Airbnb Occupancy Rate Trends (2025)
Maximize your bookings by understanding the Mungrisdale STR occupancy trends. Seasonal demand shifts significantly influence how often properties are booked. Typically, Augustsees the highest demand (peak season occupancy), while January experiences the lowest (low season). Effective strategies, like adjusting minimum stays or offering promotions, can boost occupancy during slower periods. Here's how different property tiers perform in Mungrisdale:
- Best-in-class properties (Top 10%) achieve 85%+ occupancy, indicating high desirability and potentially optimized availability.
- Strong performing properties (Top 25%) maintain 62% or higher occupancy, suggesting good market fit and guest satisfaction.
- Typical properties (Median) have an occupancy rate around 35%.
- Entry-level properties (Bottom 25%) average 17% occupancy, potentially facing higher vacancy.
Average Monthly Occupancy Rate Trend in Mungrisdale
Average Daily Rate (ADR) Airbnb Trends in Mungrisdale (2025)
Effective short term rental pricing strategy in Mungrisdale involves understanding monthly ADR fluctuations. The Average Daily Rate (ADR) for Airbnb in Mungrisdale typically peaks in August and dips lowest during November. Leveraging Airbnb dynamic pricing tools or strategies based on this seasonality can significantly boost revenue. Here's a look at the typical nightly rates achieved:
- Best-in-class properties (Top 10%) command rates of $440+ per night, often due to premium features or locations.
- Strong performing properties (Top 25%) achieve nightly rates of $294 or more.
- Typical properties (Median) charge around $198 per night.
- Entry-level properties (Bottom 25%) earn around $142 per night.
Average Daily Rate (ADR) Trend by Month in Mungrisdale
Get Live Mungrisdale Market Intelligence 👇

Explore Real-time Analytics
Airbnb Seasonality Analysis & Trends in Mungrisdale (2025)
Peak Season (August, July, June)
- Revenue averages $4,194 per month
- Occupancy rates average 50.6%
- Daily rates average $272
Shoulder Season
- Revenue averages $2,900 per month
- Occupancy maintains around 41.3%
- Daily rates hold near $249
Low Season (January, March, November)
- Revenue drops to average $1,863 per month
- Occupancy decreases to average 33.2%
- Daily rates adjust to average $240
Seasonality Insights for Mungrisdale
- The Airbnb seasonality in Mungrisdale shows highly seasonal trends requiring careful strategy. While the sections above show seasonal averages, it's also insightful to look at the extremes:
- During the high season, the absolute peak month showcases Mungrisdale's highest earning potential, with monthly revenues capable of climbing to $4,829, occupancy reaching a high of 57.0%, and ADRs peaking at $285.
- Conversely, the slowest single month of the year, typically falling within the low season, marks the market's lowest point. In this month, revenue might dip to $1,724, occupancy could drop to 29.3%, and ADRs may adjust down to $235.
- Understanding both the seasonal averages and these monthly peaks and troughs in revenue, occupancy, and ADR is crucial for maximizing your Airbnb profit potential in Mungrisdale.
Seasonal Strategies for Maximizing Profit
- Peak Season: Maximize revenue through premium pricing and potentially longer minimum stays. Ensure high availability.
- Low Season: Offer competitive pricing, special promotions (e.g., extended stay discounts), and flexible cancellation policies. Target off-season travelers like remote workers or budget-conscious guests.
- Shoulder Seasons: Implement dynamic pricing that balances peak and low rates. Target weekend travelers or specific events. Offer slightly more flexible terms than peak season.
- Regularly analyze your own performance against these Mungrisdale seasonality benchmarks and adjust your pricing and availability strategy accordingly.
Best Areas for Airbnb Investment in Mungrisdale (2025)
Exploring the top neighborhoods for short-term rentals in Mungrisdale? This section highlights key areas, outlining why they are attractive for hosts and guests, along with notable local attractions. Consider these locations based on your target guest profile and investment strategy.
| Neighborhood / Area | Why Host Here? (Target Guests & Appeal) | Key Attractions & Landmarks |
|---|---|---|
| Mungrisdale Village | A quaint village atmosphere with beautiful scenery, ideal for nature lovers and those looking to escape the hustle and bustle. Close to hiking trails and outdoor activities, perfect for those seeking a peaceful retreat. | Blencathra Mountain, Thirlmere Reservoir, Lake District National Park, Greystoke Forest, Mungrisdale Common |
| The Lakes | Located near the stunning Lake District, this area is famous for its breathtaking lakes, hiking, and outdoor activities. A hotspot for tourists seeking adventure and scenic beauty. | Derwentwater, Ullswater, Windermere, Helvellyn, Buttermere |
| Penrith | A nearby market town with a rich history and convenient amenities. Attracts tourists visiting the Lake District and serves as a gateway to various attractions in the region. | Penrith Castle, Askham Hall, The Penrith Farmers' Market, Mayburgh Henge, Historic Churches |
| Keswick | A bustling town located on the shores of Derwentwater, it's a popular spot for walkers and visitors. Offers a lively atmosphere with shops and restaurants. | Derwent Water, Keswick Museum and Art Gallery, Theatre by the Lake, Castlerigg Stone Circle, Surrounding Fells and Trails |
| Caldbeck | A picturesque village with stunning countryside views, perfect for those seeking tranquility in nature. Its rustic charm draws visitors looking for relaxation and exploration. | Caldbeck Church, Caldbeck Fells, The Old Crown, Nearby walks and trails, Cumbrian landscape |
| Greystoke | A charming village with historic sites and close proximity to outdoor activities. Ideal for families and groups looking for a rural escape. | Greystoke Castle, Greystoke Cycle Trails, Nearby lakes, Scenic walking routes, Local pubs and cafes |
| Threlkeld | A small village close to Blencathra, offering access to excellent walking and cycling routes. Attractive for outdoor enthusiasts and those seeking a peaceful stay. | Threlkeld Quarry and Mining Museum, Blencathra, Walking paths, Surrounding countryside, Local wildlife |
| St John’s in the Vale | A tranquil area with stunning valley views and rich wildlife. It’s perfect for visitors looking for a peaceful retreat surrounded by nature. | Skiddaw Mountain, St John’s Church, Beautiful walking paths, Fishing opportunities, Rural landscape |
Understanding Airbnb License Requirements & STR Laws in Mungrisdale (2025)
While Mungrisdale, England, United Kingdom currently shows low STR regulations, specific Airbnb license requirements might still exist or change. Always verify the latest short term rental regulations and Airbnb license requirements directly with local government authorities for Mungrisdale to ensure full compliance before hosting.
(Source: AirROI data, 2025, finding no licensed listings among those analyzed)
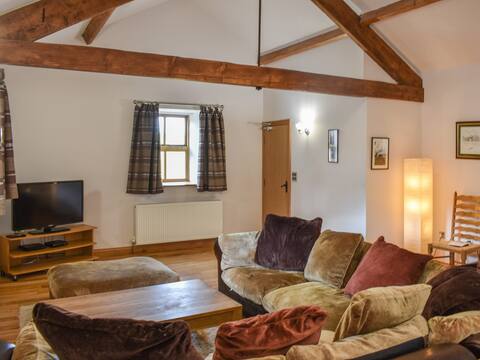
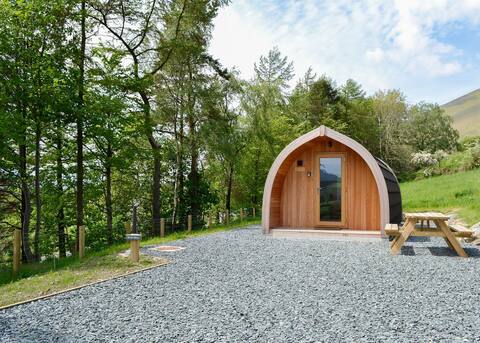
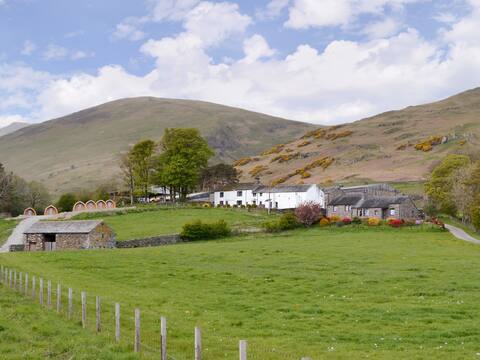
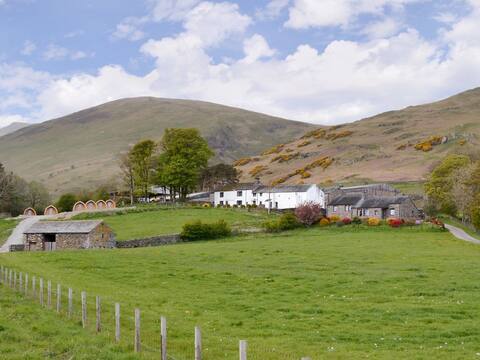
Top Performing Airbnb Properties in Mungrisdale (2025)
Benchmark your potential! Explore examples of top-performing Airbnb properties in Mungrisdalebased on Trailing Twelve Month (TTM) revenue. Analyze their characteristics, revenue, occupancy rate, and ADR to understand what drives success in this market.
uk39799 - old Corner Barn
Entire Place • 3 bedrooms
Lambrigg
Entire Place • 1 bedroom
Swallow Bank
Entire Place • 1 bedroom
Leafield
Entire Place • 1 bedroom
Tarn Cottage
Entire Place • 3 bedrooms
Wallthwaite Cottage
Entire Place • 3 bedrooms
Note: Performance varies based on location, size, amenities, seasonality, and management quality. Data reflects the past 12 months.
Top Performing Airbnb Hosts in Mungrisdale (2025)
Learn from the best! This table showcases top-performing Airbnb hosts in Mungrisdale based on the number of properties managed and estimated total revenue over the past year. Analyze their scale and performance metrics.
| Host Name | Properties | Grossing Revenue | Stay Reviews | Avg Rating |
|---|---|---|---|---|
| Hoseasons | 5 | $262,474 | 100 | 4.62/5.0 |
| Cottages | 7 | $223,191 | 26 | 3.33/5.0 |
| Lowside | 3 | $95,672 | 80 | 4.92/5.0 |
| Dorothy | 2 | $43,533 | 410 | 4.90/5.0 |
| Stef | 1 | $33,884 | 119 | 4.79/5.0 |
| Fiona And Mark | 7 | $30,861 | 318 | 4.89/5.0 |
| Kathryn | 1 | $24,692 | 141 | 4.96/5.0 |
| Jim | 1 | $24,099 | 112 | 4.96/5.0 |
| Judith | 1 | $18,448 | 27 | 4.96/5.0 |
| Host #453952957 | 1 | $17,057 | 0 | 0.00/5.0 |
Analyzing the strategies of top hosts, such as their property selection, pricing, and guest communication, can offer valuable lessons for optimizing your own Airbnb operations in Mungrisdale.
Dive Deeper: Advanced Mungrisdale STR Market Data (2025)
Ready to unlock more insights? AirROI provides access to advanced metrics and comprehensive Airbnb data for Mungrisdale. Explore detailed analytics beyond this report to refine your investment strategy, optimize pricing, and maximize your vacation rental profits.
Explore Advanced MetricsMungrisdale Short-Term Rental Market Composition (2025): Property & Room Types
Room Type Distribution
Property Type Distribution
Market Composition Insights for Mungrisdale
- The Mungrisdale Airbnb market composition is heavily skewed towards Entire Home/Apt listings, which make up 100% of the 31 active rentals. This indicates strong guest preference for privacy and space.
- Looking at the property type distribution in Mungrisdale, House properties are the most common (77.4%), reflecting the local real estate landscape.
- Houses represent a significant 77.4% portion, catering likely to families or larger groups.
- Smaller segments like others, outdoor/unique (combined 6.4%) offer potential for unique stay experiences.
Mungrisdale Airbnb Room Capacity Analysis (2025): Bedroom Distribution
Distribution of Listings by Number of Bedrooms
Room Capacity Insights for Mungrisdale
- The dominant room capacity in Mungrisdale is 1 bedroom listings, making up 32.3% of the market. This suggests a strong demand for properties suitable for couples or solo travelers.
- Together, 1 bedroom and 2 bedrooms properties represent 61.3% of the active Airbnb listings in Mungrisdale, indicating a high concentration in these sizes.
- A significant 38.7% of listings offer 3+ bedrooms, catering to larger groups and families seeking more space in Mungrisdale.
Mungrisdale Vacation Rental Guest Capacity Trends (2025)
Distribution of Listings by Guest Capacity
Guest Capacity Insights for Mungrisdale
- The most common guest capacity trend in Mungrisdale vacation rentals is listings accommodating 4 guests (38.7%). This suggests the primary traveler segment is likely small families or groups.
- Properties designed for 4 guests and 6 guests dominate the Mungrisdale STR market, accounting for 58.1% of listings.
- 42.0% of properties accommodate 6+ guests, serving the market segment for larger families or group travel in Mungrisdale.
- On average, properties in Mungrisdale are equipped to host 4.9 guests.
Mungrisdale Airbnb Booking Patterns (2025): Available vs. Booked Days
Available Days Distribution
Booked Days Distribution
Booking Pattern Insights for Mungrisdale
- The most common availability pattern in Mungrisdale falls within the 271-366 days range, representing 48.4% of listings. This suggests many properties have significant open periods on their calendars.
- Approximately 67.8% of listings show high availability (181+ days open annually), indicating potential for increased bookings or specific owner usage patterns.
- For booked days, the 1-30 days range is most frequent in Mungrisdale (22.6%), reflecting common guest stay durations or potential owner blocking patterns.
- A notable 32.3% of properties secure long booking periods (181+ days booked per year), highlighting successful long-term rental strategies or significant owner usage.
Mungrisdale Airbnb Minimum Stay Requirements Analysis
Distribution of Listings by Minimum Night Requirement
1 Night
15 listings
48.4% of total
2 Nights
4 listings
12.9% of total
3 Nights
1 listings
3.2% of total
4-6 Nights
3 listings
9.7% of total
7-29 Nights
1 listings
3.2% of total
30+ Nights
7 listings
22.6% of total
Key Insights
- The most prevalent minimum stay requirement in Mungrisdale is 1 Night, adopted by 48.4% of listings. This highlights the market's preference for shorter, flexible bookings.
- A strong majority (61.3%) of the Mungrisdale Airbnb data shows acceptance of very short stays (1-2 nights), indicating a dynamic, high-turnover market.
- A significant segment (22.6%) caters to monthly stays (30+ nights) in Mungrisdale, pointing to opportunities in the extended-stay market.
Recommendations
- Align with the market by considering a 1 Night minimum stay, as 48.4% of Mungrisdale hosts use this setting.
- Explore offering discounts for stays of 30+ nights to attract the 22.6% of the market seeking extended stays.
- Adjust minimum nights based on seasonality – potentially shorter during low season and longer during peak demand periods in Mungrisdale.
Mungrisdale Airbnb Cancellation Policy Trends Analysis (2025)
Super Strict 60 Days
11 listings
40.7% of total
Flexible
2 listings
7.4% of total
Moderate
8 listings
29.6% of total
Firm
5 listings
18.5% of total
Strict
1 listings
3.7% of total
Cancellation Policy Insights for Mungrisdale
- The prevailing Airbnb cancellation policy trend in Mungrisdale is Super Strict 60 Days, used by 40.7% of listings.
- There's a relatively balanced mix between guest-friendly (37.0%) and stricter (22.2%) policies, offering choices for different guest needs.
- Strict cancellation policies are quite rare (3.7%), potentially making listings with this policy less competitive unless justified by high demand or property type.
Recommendations for Hosts
- Consider adopting a Super Strict 60 Days policy to align with the 40.7% market standard in Mungrisdale.
- Using a Strict policy might deter some guests, as only 3.7% of listings use it. Evaluate if potential revenue protection outweighs possible lower booking rates.
- Regularly review your cancellation policy against competitors and market demand shifts in Mungrisdale.
Mungrisdale STR Booking Lead Time Analysis (2025)
Average Booking Lead Time by Month
Booking Lead Time Insights for Mungrisdale
- The overall average booking lead time for vacation rentals in Mungrisdale is 63 days.
- Guests book furthest in advance for stays during June (average 102 days), likely coinciding with peak travel demand or local events.
- The shortest booking windows occur for stays in February (average 37 days), indicating more last-minute travel plans during this time.
- Seasonally, Summer (83 days avg.) sees the longest lead times, while Winter (44 days avg.) has the shortest, reflecting typical travel planning cycles.
Recommendations for Hosts
- Use the overall average lead time (63 days) as a baseline for your pricing and availability strategy in Mungrisdale.
- For June stays, consider implementing length-of-stay discounts or slightly higher rates for bookings made less than 102 days out to capitalize on advance planning.
- Target marketing efforts for the Summer season well in advance (at least 83 days) to capture early planners.
- Monitor your own booking lead times against these Mungrisdale averages to identify opportunities for dynamic pricing adjustments.
Popular & Essential Airbnb Amenities in Mungrisdale (2025)
Amenity Prevalence
Amenity Insights for Mungrisdale
- Essential amenities in Mungrisdale that guests expect include: Smoke alarm, Free parking on premises, Heating, Wifi, TV. Lacking these (any) could significantly impact bookings.
- Popular amenities like Bed linens, Kitchen, Cooking basics are common but not universal. Offering these can provide a competitive edge.
Recommendations for Hosts
- Ensure your listing includes all essential amenities for Mungrisdale: Smoke alarm, Free parking on premises, Heating, Wifi, TV.
- Consider adding popular differentiators like Bed linens or Kitchen to increase appeal.
- Highlight unique or less common amenities you offer (e.g., hot tub, dedicated workspace, EV charger) in your listing description and photos.
- Regularly check competitor amenities in Mungrisdale to stay competitive.
Mungrisdale Airbnb Guest Demographics & Profile Analysis (2025)
Guest Profile Summary for Mungrisdale
- The typical guest profile for Airbnb in Mungrisdale consists of primarily domestic travelers (84%), often arriving from nearby England, typically belonging to the Post-2000s (Gen Z/Alpha) group (50%), primarily speaking English or French.
- Domestic travelers account for 84.0% of guests.
- Key international markets include United Kingdom (84%) and United States (4.9%).
- Top languages spoken are English (75%) followed by French (6.5%).
- A significant demographic segment is the Post-2000s (Gen Z/Alpha) group, representing 50% of guests.
Recommendations for Hosts
- Target domestic marketing efforts towards travelers from England and London.
- Tailor amenities and listing descriptions to appeal to the dominant Post-2000s (Gen Z/Alpha) demographic (e.g., highlight fast WiFi, smart home features, local guides).
- Highlight unique local experiences or amenities relevant to the primary guest profile.
- Consider seasonal promotions aligned with peak travel times for key origin markets.
Nearby Short-Term Rental Market Comparison
How does the Mungrisdale Airbnb market stack up against its neighbors? Compare key performance metrics like average monthly revenue, ADR, and occupancy rates in surrounding areas to understand the broader regional STR landscape.
| Market | Active Properties | Monthly Revenue | Daily Rate | Avg. Occupancy |
|---|---|---|---|---|
| Gorebridge | 12 | $6,209 | $493.62 | 54% |
| Grinton | 14 | $5,456 | $365.05 | 51% |
| Cartmel Fell | 17 | $4,719 | $331.68 | 52% |
| Casterton | 11 | $4,578 | $300.82 | 51% |
| Cark | 11 | $4,540 | $885.21 | 31% |
| City of Edinburgh | 4,312 | $4,528 | $274.67 | 61% |
| Eglwys-bach | 16 | $4,413 | $315.23 | 52% |
| Waverton | 16 | $4,358 | $444.20 | 33% |
| Hayton | 13 | $4,333 | $239.53 | 60% |
| Watermillock | 16 | $4,281 | $274.03 | 50% |