Middleham Airbnb Market Analysis 2025: Short Term Rental Data & Vacation Rental Statistics in England, United Kingdom
Is Airbnb profitable in Middleham in 2025? Explore comprehensive Airbnb analytics for Middleham, England, United Kingdom to uncover income potential. This 2025 STR market report for Middleham, based on AirROI data from April 2024 to March 2025, reveals key trends in the niche market of 18 active listings.
Whether you're considering an Airbnb investment in Middleham, optimizing your existing vacation rental, or exploring rental arbitrage opportunities, understanding the Middleham Airbnb data is crucial. Leveraging the low regulation environment is key to maximizing your short term rental income potential. Let's dive into the specifics.
Key Middleham Airbnb Performance Metrics Overview
Monthly Airbnb Revenue Variations & Income Potential in Middleham (2025)
Understanding the monthly revenue variations for Airbnb listings in Middleham is key to maximizing your short term rental income potential. Seasonality significantly impacts earnings. Our analysis, based on data from the past 12 months, shows that the peak revenue month for STRs in Middleham is typically September, while March often presents the lowest earnings, highlighting opportunities for strategic pricing adjustments during shoulder and low seasons. Explore the typical Airbnb income in Middleham across different performance tiers:
- Best-in-class properties (Top 10%) achieve $7,189+ monthly, often utilizing dynamic pricing and superior guest experiences.
- Strong performing properties (Top 25%) earn $4,171 or more, indicating effective management and desirable locations/amenities.
- Typical properties (Median) generate around $2,814 per month, representing the average market performance.
- Entry-level properties (Bottom 25%) see earnings around $1,962, often with potential for optimization.
Average Monthly Airbnb Earnings Trend in Middleham
Middleham Airbnb Occupancy Rate Trends (2025)
Maximize your bookings by understanding the Middleham STR occupancy trends. Seasonal demand shifts significantly influence how often properties are booked. Typically, Septembersees the highest demand (peak season occupancy), while April experiences the lowest (low season). Effective strategies, like adjusting minimum stays or offering promotions, can boost occupancy during slower periods. Here's how different property tiers perform in Middleham:
- Best-in-class properties (Top 10%) achieve 78%+ occupancy, indicating high desirability and potentially optimized availability.
- Strong performing properties (Top 25%) maintain 66% or higher occupancy, suggesting good market fit and guest satisfaction.
- Typical properties (Median) have an occupancy rate around 50%.
- Entry-level properties (Bottom 25%) average 26% occupancy, potentially facing higher vacancy.
Average Monthly Occupancy Rate Trend in Middleham
Average Daily Rate (ADR) Airbnb Trends in Middleham (2025)
Effective short term rental pricing strategy in Middleham involves understanding monthly ADR fluctuations. The Average Daily Rate (ADR) for Airbnb in Middleham typically peaks in August and dips lowest during February. Leveraging Airbnb dynamic pricing tools or strategies based on this seasonality can significantly boost revenue. Here's a look at the typical nightly rates achieved:
- Best-in-class properties (Top 10%) command rates of $351+ per night, often due to premium features or locations.
- Strong performing properties (Top 25%) achieve nightly rates of $285 or more.
- Typical properties (Median) charge around $226 per night.
- Entry-level properties (Bottom 25%) earn around $149 per night.
Average Daily Rate (ADR) Trend by Month in Middleham
Get Live Middleham Market Intelligence 👇

Explore Real-time Analytics
Airbnb Seasonality Analysis & Trends in Middleham (2025)
Peak Season (September, August, May)
- Revenue averages $5,172 per month
- Occupancy rates average 58.0%
- Daily rates average $333
Shoulder Season
- Revenue averages $3,735 per month
- Occupancy maintains around 46.6%
- Daily rates hold near $287
Low Season (January, February, March)
- Revenue drops to average $2,342 per month
- Occupancy decreases to average 43.7%
- Daily rates adjust to average $195
Seasonality Insights for Middleham
- The Airbnb seasonality in Middleham shows highly seasonal trends requiring careful strategy. While the sections above show seasonal averages, it's also insightful to look at the extremes:
- During the high season, the absolute peak month showcases Middleham's highest earning potential, with monthly revenues capable of climbing to $5,283, occupancy reaching a high of 65.5%, and ADRs peaking at $334.
- Conversely, the slowest single month of the year, typically falling within the low season, marks the market's lowest point. In this month, revenue might dip to $2,181, occupancy could drop to 29.7%, and ADRs may adjust down to $193.
- Understanding both the seasonal averages and these monthly peaks and troughs in revenue, occupancy, and ADR is crucial for maximizing your Airbnb profit potential in Middleham.
Seasonal Strategies for Maximizing Profit
- Peak Season: Maximize revenue through premium pricing and potentially longer minimum stays. Ensure high availability.
- Low Season: Offer competitive pricing, special promotions (e.g., extended stay discounts), and flexible cancellation policies. Target off-season travelers like remote workers or budget-conscious guests.
- Shoulder Seasons: Implement dynamic pricing that balances peak and low rates. Target weekend travelers or specific events. Offer slightly more flexible terms than peak season.
- Regularly analyze your own performance against these Middleham seasonality benchmarks and adjust your pricing and availability strategy accordingly.
Best Areas for Airbnb Investment in Middleham (2025)
Exploring the top neighborhoods for short-term rentals in Middleham? This section highlights key areas, outlining why they are attractive for hosts and guests, along with notable local attractions. Consider these locations based on your target guest profile and investment strategy.
| Neighborhood / Area | Why Host Here? (Target Guests & Appeal) | Key Attractions & Landmarks |
|---|---|---|
| Middleham Castle | A historic castle in the heart of Middleham, attracting visitors interested in British history and architecture. The castle's rich heritage makes it a prime spot for tourists. | Middleham Castle, The Richard III Museum, Wensleydale Railway, Aysgarth Falls, Bolton Castle |
| Dales National Park | Close to the stunning Yorkshire Dales, ideal for nature lovers and hikers. This area draws visitors looking for outdoor activities and breathtaking landscapes. | Yorkshire Dales National Park, Malham Cove, Semerwater, The Three Peaks, Bolton Abbey |
| Market Square | The vibrant market square offers local shops, cafes, and a sense of community. It's a perfect base for those looking to explore Middleham and its surroundings. | Local markets, Middleham's pubs and restaurants, Art galleries, The local bakery, Community events |
| Leyburn | Nearby town with a range of amenities and access to scenic walks. Attracts families and groups looking for a base with local conveniences. | Leyburn Market, Bolton Castle, Leyburn Shawl, The Forbidden Corner, Wensleydale Creamery |
| Richmond | A nearby historic market town offering charming streets and countryside. It's popular for tourists looking for history and shopping. | Richmond Castle, Easby Abbey, Richmond Market Place, The Station, Swaledale |
| Hawes | A small town in the Dales known for its cheese and the Wensleydale Creamery. Ideal for food lovers and hikers. | Wensleydale Creamery, Hardraw Force, Hawes Market, Dales Countryside Museum, The Pennine Way |
| Aysgarth | Known for its beautiful waterfalls and scenic views. Great for nature-loving tourists looking for relaxation and adventure. | Aysgarth Falls, Dales Cycleway, Aysgarth Falls National Park Centre, The River Ure, Wensleydale Railway |
| Coverdale | A picturesque valley offering stunning walks and quiet escapes. Perfect for those looking for a secluded getaway in nature. | Coverdale walks, Hiking trails, Scenic beauty, Historic sites, Local wildlife |
Understanding Airbnb License Requirements & STR Laws in Middleham (2025)
While Middleham, England, United Kingdom currently shows low STR regulations, specific Airbnb license requirements might still exist or change. Always verify the latest short term rental regulations and Airbnb license requirements directly with local government authorities for Middleham to ensure full compliance before hosting.
(Source: AirROI data, 2025, finding no licensed listings among those analyzed)
Top Performing Airbnb Properties in Middleham (2025)
Benchmark your potential! Explore examples of top-performing Airbnb properties in Middlehambased on Trailing Twelve Month (TTM) revenue. Analyze their characteristics, revenue, occupancy rate, and ADR to understand what drives success in this market.
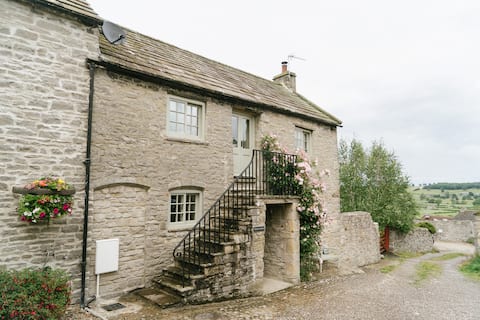
Luxury Garden cottage, private Lane & 3 local pubs
Entire Place • 2 bedrooms
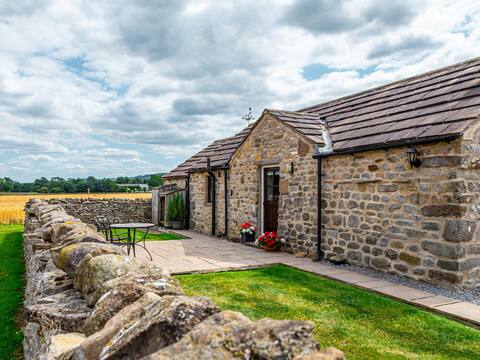
Curlew Barn
Entire Place • 1 bedroom
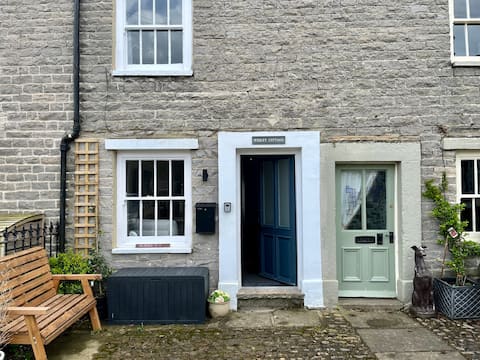
Wesley Cottage, West End, Middleham
Entire Place • 3 bedrooms
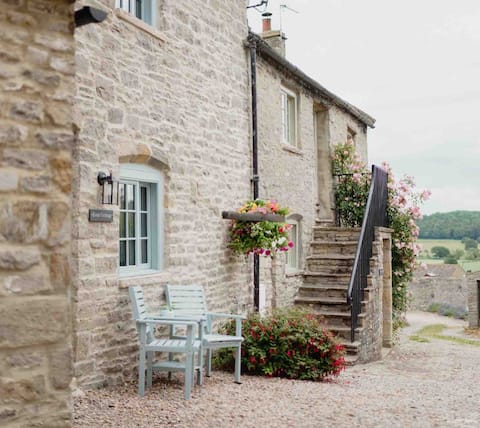
Luxury Dales village retreat, quiet private lane.
Entire Place • 1 bedroom
Slater's Cottage
Entire Place • 3 bedrooms
Luxury Cosy Cottage Middleham Yorkshire Dales
Entire Place • 1 bedroom
Note: Performance varies based on location, size, amenities, seasonality, and management quality. Data reflects the past 12 months.
Top Performing Airbnb Hosts in Middleham (2025)
Learn from the best! This table showcases top-performing Airbnb hosts in Middleham based on the number of properties managed and estimated total revenue over the past year. Analyze their scale and performance metrics.
| Host Name | Properties | Grossing Revenue | Stay Reviews | Avg Rating |
|---|---|---|---|---|
| Cottages | 6 | $135,622 | 21 | 2.41/5.0 |
| Leanne | 2 | $94,203 | 106 | 4.98/5.0 |
| Host #376104904 | 2 | $47,162 | 0 | 0.00/5.0 |
| Rebecca And Greg | 1 | $37,290 | 18 | 5.00/5.0 |
| Tim | 1 | $34,680 | 94 | 4.99/5.0 |
| Harriet | 1 | $34,502 | 42 | 4.88/5.0 |
| Karen | 1 | $31,296 | 102 | 4.79/5.0 |
| Mrs. Rita | 1 | $23,361 | 144 | 4.61/5.0 |
| Ingrid Flute'S Yorks Hol Cotta | 1 | $21,912 | 9 | 4.33/5.0 |
| Host #65205158 | 1 | $13,980 | 46 | 4.89/5.0 |
Analyzing the strategies of top hosts, such as their property selection, pricing, and guest communication, can offer valuable lessons for optimizing your own Airbnb operations in Middleham.
Dive Deeper: Advanced Middleham STR Market Data (2025)
Ready to unlock more insights? AirROI provides access to advanced metrics and comprehensive Airbnb data for Middleham. Explore detailed analytics beyond this report to refine your investment strategy, optimize pricing, and maximize your vacation rental profits.
Explore Advanced MetricsMiddleham Short-Term Rental Market Composition (2025): Property & Room Types
Room Type Distribution
Property Type Distribution
Market Composition Insights for Middleham
- The Middleham Airbnb market composition is heavily skewed towards Entire Home/Apt listings, which make up 100% of the 18 active rentals. This indicates strong guest preference for privacy and space.
- Looking at the property type distribution in Middleham, House properties are the most common (100%), reflecting the local real estate landscape.
- Houses represent a significant 100% portion, catering likely to families or larger groups.
Middleham Airbnb Room Capacity Analysis (2025): Bedroom Distribution
Distribution of Listings by Number of Bedrooms
Room Capacity Insights for Middleham
- The dominant room capacity in Middleham is 1 bedroom listings, making up 44.4% of the market. This suggests a strong demand for properties suitable for couples or solo travelers.
- Together, 1 bedroom and 2 bedrooms properties represent 72.2% of the active Airbnb listings in Middleham, indicating a high concentration in these sizes.
- A significant 27.8% of listings offer 3+ bedrooms, catering to larger groups and families seeking more space in Middleham.
Middleham Vacation Rental Guest Capacity Trends (2025)
Distribution of Listings by Guest Capacity
Guest Capacity Insights for Middleham
- The most common guest capacity trend in Middleham vacation rentals is listings accommodating 2 guests (44.4%). This suggests the primary traveler segment is likely couples or solo travelers.
- Properties designed for 2 guests and 4 guests dominate the Middleham STR market, accounting for 77.7% of listings.
- A significant 44.4% of listings cater specifically to 1-2 guests, highlighting strong demand from couples and solo travelers in Middleham.
- On average, properties in Middleham are equipped to host 3.5 guests.
Middleham Airbnb Booking Patterns (2025): Available vs. Booked Days
Available Days Distribution
Booked Days Distribution
Booking Pattern Insights for Middleham
- The most common availability pattern in Middleham falls within the 271-366 days range, representing 38.9% of listings. This suggests many properties have significant open periods on their calendars.
- Approximately 66.7% of listings show high availability (181+ days open annually), indicating potential for increased bookings or specific owner usage patterns.
- For booked days, the 31-90 days range is most frequent in Middleham (27.8%), reflecting common guest stay durations or potential owner blocking patterns.
- A notable 33.4% of properties secure long booking periods (181+ days booked per year), highlighting successful long-term rental strategies or significant owner usage.
Middleham Airbnb Minimum Stay Requirements Analysis
Distribution of Listings by Minimum Night Requirement
1 Night
5 listings
31.3% of total
2 Nights
2 listings
12.5% of total
3 Nights
3 listings
18.8% of total
4-6 Nights
1 listings
6.3% of total
30+ Nights
5 listings
31.3% of total
Key Insights
- The most prevalent minimum stay requirement in Middleham is 1 Night, adopted by 31.3% of listings. This highlights the market's preference for shorter, flexible bookings.
- A significant segment (31.3%) caters to monthly stays (30+ nights) in Middleham, pointing to opportunities in the extended-stay market.
Recommendations
- Align with the market by considering a 1 Night minimum stay, as 31.3% of Middleham hosts use this setting.
- Explore offering discounts for stays of 30+ nights to attract the 31.3% of the market seeking extended stays.
- Adjust minimum nights based on seasonality – potentially shorter during low season and longer during peak demand periods in Middleham.
Middleham Airbnb Cancellation Policy Trends Analysis (2025)
Super Strict 60 Days
4 listings
33.3% of total
Flexible
3 listings
25% of total
Moderate
1 listings
8.3% of total
Firm
2 listings
16.7% of total
Strict
2 listings
16.7% of total
Cancellation Policy Insights for Middleham
- The prevailing Airbnb cancellation policy trend in Middleham is Super Strict 60 Days, used by 33.3% of listings.
- There's a relatively balanced mix between guest-friendly (33.3%) and stricter (33.4%) policies, offering choices for different guest needs.
Recommendations for Hosts
- Consider adopting a Super Strict 60 Days policy to align with the 33.3% market standard in Middleham.
- Regularly review your cancellation policy against competitors and market demand shifts in Middleham.
Middleham STR Booking Lead Time Analysis (2025)
Average Booking Lead Time by Month
Booking Lead Time Insights for Middleham
- The overall average booking lead time for vacation rentals in Middleham is 94 days.
- Guests book furthest in advance for stays during June (average 146 days), likely coinciding with peak travel demand or local events.
- The shortest booking windows occur for stays in February (average 39 days), indicating more last-minute travel plans during this time.
- Seasonally, Summer (119 days avg.) sees the longest lead times, while Winter (73 days avg.) has the shortest, reflecting typical travel planning cycles.
Recommendations for Hosts
- Use the overall average lead time (94 days) as a baseline for your pricing and availability strategy in Middleham.
- For June stays, consider implementing length-of-stay discounts or slightly higher rates for bookings made less than 146 days out to capitalize on advance planning.
- Target marketing efforts for the Summer season well in advance (at least 119 days) to capture early planners.
- Monitor your own booking lead times against these Middleham averages to identify opportunities for dynamic pricing adjustments.
Popular & Essential Airbnb Amenities in Middleham (2025)
Amenity Prevalence
Amenity Insights for Middleham
- Essential amenities in Middleham that guests expect include: Hangers, Kitchen, Heating, TV, Smoke alarm, Wifi. Lacking these (any) could significantly impact bookings.
- Popular amenities like Bed linens, Private entrance, Essentials are common but not universal. Offering these can provide a competitive edge.
Recommendations for Hosts
- Ensure your listing includes all essential amenities for Middleham: Hangers, Kitchen, Heating, TV, Smoke alarm, Wifi.
- Consider adding popular differentiators like Bed linens or Private entrance to increase appeal.
- Highlight unique or less common amenities you offer (e.g., hot tub, dedicated workspace, EV charger) in your listing description and photos.
- Regularly check competitor amenities in Middleham to stay competitive.
Middleham Airbnb Guest Demographics & Profile Analysis (2025)
Guest Profile Summary for Middleham
- The typical guest profile for Airbnb in Middleham consists of primarily domestic travelers (97%), often arriving from nearby England, typically belonging to the Post-2000s (Gen Z/Alpha) group (50%), primarily speaking English or French.
- Domestic travelers account for 97.3% of guests.
- Key international markets include United Kingdom (97.3%) and Ireland (0.7%).
- Top languages spoken are English (73.7%) followed by French (10.5%).
- A significant demographic segment is the Post-2000s (Gen Z/Alpha) group, representing 50% of guests.
Recommendations for Hosts
- Target domestic marketing efforts towards travelers from England and London.
- Tailor amenities and listing descriptions to appeal to the dominant Post-2000s (Gen Z/Alpha) demographic (e.g., highlight fast WiFi, smart home features, local guides).
- Highlight unique local experiences or amenities relevant to the primary guest profile.
- Consider seasonal promotions aligned with peak travel times for key origin markets.
Nearby Short-Term Rental Market Comparison
How does the Middleham Airbnb market stack up against its neighbors? Compare key performance metrics like average monthly revenue, ADR, and occupancy rates in surrounding areas to understand the broader regional STR landscape.
| Market | Active Properties | Monthly Revenue | Daily Rate | Avg. Occupancy |
|---|---|---|---|---|
| Grinton | 14 | $5,456 | $365.05 | 51% |
| Cartmel Fell | 17 | $4,719 | $331.68 | 52% |
| Stamford Bridge | 11 | $4,669 | $410.14 | 38% |
| Casterton | 11 | $4,578 | $300.82 | 51% |
| Appleby | 10 | $4,577 | $332.39 | 44% |
| Cark | 11 | $4,540 | $885.21 | 31% |
| Hayton | 13 | $4,333 | $239.53 | 60% |
| Watermillock | 16 | $4,281 | $274.03 | 50% |
| Kielder | 12 | $4,215 | $329.21 | 53% |
| Pooley Bridge | 13 | $4,145 | $317.26 | 52% |