Middle Crackington Airbnb Market Analysis 2025: Short Term Rental Data & Vacation Rental Statistics in England, United Kingdom
Is Airbnb profitable in Middle Crackington in 2025? Explore comprehensive Airbnb analytics for Middle Crackington, England, United Kingdom to uncover income potential. This 2025 STR market report for Middle Crackington, based on AirROI data from April 2024 to March 2025, reveals key trends in the niche market of 21 active listings.
Whether you're considering an Airbnb investment in Middle Crackington, optimizing your existing vacation rental, or exploring rental arbitrage opportunities, understanding the Middle Crackington Airbnb data is crucial. Leveraging the low regulation environment is key to maximizing your short term rental income potential. Let's dive into the specifics.
Key Middle Crackington Airbnb Performance Metrics Overview
Monthly Airbnb Revenue Variations & Income Potential in Middle Crackington (2025)
Understanding the monthly revenue variations for Airbnb listings in Middle Crackington is key to maximizing your short term rental income potential. Seasonality significantly impacts earnings. Our analysis, based on data from the past 12 months, shows that the peak revenue month for STRs in Middle Crackington is typically August, while January often presents the lowest earnings, highlighting opportunities for strategic pricing adjustments during shoulder and low seasons. Explore the typical Airbnb income in Middle Crackington across different performance tiers:
- Best-in-class properties (Top 10%) achieve $4,787+ monthly, often utilizing dynamic pricing and superior guest experiences.
- Strong performing properties (Top 25%) earn $3,562 or more, indicating effective management and desirable locations/amenities.
- Typical properties (Median) generate around $2,533 per month, representing the average market performance.
- Entry-level properties (Bottom 25%) see earnings around $1,270, often with potential for optimization.
Average Monthly Airbnb Earnings Trend in Middle Crackington
Middle Crackington Airbnb Occupancy Rate Trends (2025)
Maximize your bookings by understanding the Middle Crackington STR occupancy trends. Seasonal demand shifts significantly influence how often properties are booked. Typically, Augustsees the highest demand (peak season occupancy), while January experiences the lowest (low season). Effective strategies, like adjusting minimum stays or offering promotions, can boost occupancy during slower periods. Here's how different property tiers perform in Middle Crackington:
- Best-in-class properties (Top 10%) achieve 81%+ occupancy, indicating high desirability and potentially optimized availability.
- Strong performing properties (Top 25%) maintain 69% or higher occupancy, suggesting good market fit and guest satisfaction.
- Typical properties (Median) have an occupancy rate around 47%.
- Entry-level properties (Bottom 25%) average 25% occupancy, potentially facing higher vacancy.
Average Monthly Occupancy Rate Trend in Middle Crackington
Average Daily Rate (ADR) Airbnb Trends in Middle Crackington (2025)
Effective short term rental pricing strategy in Middle Crackington involves understanding monthly ADR fluctuations. The Average Daily Rate (ADR) for Airbnb in Middle Crackington typically peaks in August and dips lowest during March. Leveraging Airbnb dynamic pricing tools or strategies based on this seasonality can significantly boost revenue. Here's a look at the typical nightly rates achieved:
- Best-in-class properties (Top 10%) command rates of $437+ per night, often due to premium features or locations.
- Strong performing properties (Top 25%) achieve nightly rates of $248 or more.
- Typical properties (Median) charge around $165 per night.
- Entry-level properties (Bottom 25%) earn around $126 per night.
Average Daily Rate (ADR) Trend by Month in Middle Crackington
Get Live Middle Crackington Market Intelligence 👇

Explore Real-time Analytics
Airbnb Seasonality Analysis & Trends in Middle Crackington (2025)
Peak Season (August, July, June)
- Revenue averages $4,193 per month
- Occupancy rates average 61.1%
- Daily rates average $235
Shoulder Season
- Revenue averages $2,622 per month
- Occupancy maintains around 49.9%
- Daily rates hold near $217
Low Season (January, November, December)
- Revenue drops to average $1,453 per month
- Occupancy decreases to average 28.2%
- Daily rates adjust to average $214
Seasonality Insights for Middle Crackington
- The Airbnb seasonality in Middle Crackington shows highly seasonal trends requiring careful strategy. While the sections above show seasonal averages, it's also insightful to look at the extremes:
- During the high season, the absolute peak month showcases Middle Crackington's highest earning potential, with monthly revenues capable of climbing to $5,621, occupancy reaching a high of 77.7%, and ADRs peaking at $239.
- Conversely, the slowest single month of the year, typically falling within the low season, marks the market's lowest point. In this month, revenue might dip to $1,327, occupancy could drop to 23.6%, and ADRs may adjust down to $205.
- Understanding both the seasonal averages and these monthly peaks and troughs in revenue, occupancy, and ADR is crucial for maximizing your Airbnb profit potential in Middle Crackington.
Seasonal Strategies for Maximizing Profit
- Peak Season: Maximize revenue through premium pricing and potentially longer minimum stays. Ensure high availability.
- Low Season: Offer competitive pricing, special promotions (e.g., extended stay discounts), and flexible cancellation policies. Target off-season travelers like remote workers or budget-conscious guests.
- Shoulder Seasons: Implement dynamic pricing that balances peak and low rates. Target weekend travelers or specific events. Offer slightly more flexible terms than peak season.
- Regularly analyze your own performance against these Middle Crackington seasonality benchmarks and adjust your pricing and availability strategy accordingly.
Best Areas for Airbnb Investment in Middle Crackington (2025)
Exploring the top neighborhoods for short-term rentals in Middle Crackington? This section highlights key areas, outlining why they are attractive for hosts and guests, along with notable local attractions. Consider these locations based on your target guest profile and investment strategy.
| Neighborhood / Area | Why Host Here? (Target Guests & Appeal) | Key Attractions & Landmarks |
|---|---|---|
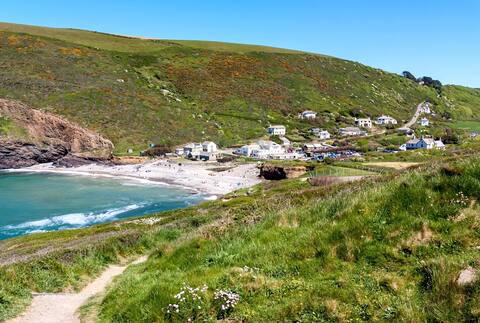
| Crackington Haven | A picturesque coastal village known for its stunning beach and scenic coastal walks. Perfect for families and nature lovers seeking an escape from city life. | Crackington Haven Beach, Bude Towans, North Cornwall Coastal Path, St Gennys Church, Widemouth Bay |
| Boscastle | A charming historic fishing village with a beautiful harbor and rich history. Attracts visitors interested in Lore, local shops, and scenic walks. | Boscastle Harbour, Museum of Witchcraft and Magic, St Juliot's Church, Boscastle to Tintagel Coastal Walk, The Old Mill |
| Tintagel | Famous for its legendary Arthurian tales and dramatic cliffside views. Popular with tourists exploring history and mythology as well as the stunning coastline. | Tintagel Castle, Merlin's Cave, King Arthur's Great Halls, Tintagel Old Post Office, The South West Coast Path |
| Bude | A popular seaside town with great surf beaches and family-friendly attractions. A classic choice for summer holidays and outdoor activities. | Summerleaze Beach, Bude Sea Pool, The Bude Canal, Crooklets Beach, Haven Surf School |
| Camelford | A small market town with access to the beautiful Cornish countryside and a base for exploring nearby attractions and historical sites. | The Museum of Camelford, King Arthur's Castle, St. Materiana's Church, Camelford to Boscastle Walk, North Cornwall |
| Widemouth Bay | Known for its long sandy beach and good surf conditions. A favorite among families and surfers alike with a relaxed atmosphere. | Widemouth Bay Beach, Widemouth Bay Surf School, The Widemouth Manor, Rock Pools at Widemouth, South West Coast Path |
| Launceston | Historically rich town with many attractions and easy access to the countryside. Great base to explore nearby attractions and historical landmarks. | Launceston Castle, Lawrence House Museum, The South Gate, Werrington Park, The Launceston Steam Railway |
| Delabole | Small village known for its slate quarry and proximity to beautiful rural and coastal walks. Suitable for visitors looking for a peaceful experience in nature. | Delabole Slate Quarry, The Camel Trail, Trebarwith Strand, Tintagel Haven, Helman Tor |
Understanding Airbnb License Requirements & STR Laws in Middle Crackington (2025)
While Middle Crackington, England, United Kingdom currently shows low STR regulations, specific Airbnb license requirements might still exist or change. Always verify the latest short term rental regulations and Airbnb license requirements directly with local government authorities for Middle Crackington to ensure full compliance before hosting.
(Source: AirROI data, 2025, finding no licensed listings among those analyzed)
Top Performing Airbnb Properties in Middle Crackington (2025)
Benchmark your potential! Explore examples of top-performing Airbnb properties in Middle Crackingtonbased on Trailing Twelve Month (TTM) revenue. Analyze their characteristics, revenue, occupancy rate, and ADR to understand what drives success in this market.

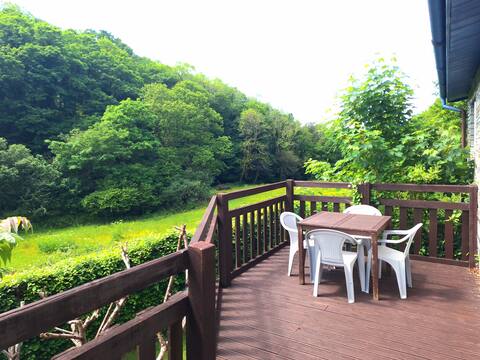
Modern house near beach hot tub
Entire Place • 3 bedrooms

Hallagather Farmhouse.
Entire Place • 4 bedrooms

Parada Cottages, beautiful walk to the beach
Entire Place • 2 bedrooms
Garyvoe cottage beautiful stroll to beach.
Entire Place • 2 bedrooms
Rusey- beautiful stroll to Crackington Haven beach
Entire Place • 2 bedrooms

Kiberick Cottage-Crackington Haven-Private garden
Entire Place • 2 bedrooms
Note: Performance varies based on location, size, amenities, seasonality, and management quality. Data reflects the past 12 months.
Top Performing Airbnb Hosts in Middle Crackington (2025)
Learn from the best! This table showcases top-performing Airbnb hosts in Middle Crackington based on the number of properties managed and estimated total revenue over the past year. Analyze their scale and performance metrics.
| Host Name | Properties | Grossing Revenue | Stay Reviews | Avg Rating |
|---|---|---|---|---|
| Ben, Jess And Charlie | 7 | $247,499 | 542 | 4.82/5.0 |
| Toni-Ann | 2 | $81,507 | 81 | 4.97/5.0 |
| Becky | 2 | $57,894 | 105 | 4.93/5.0 |
| Rachel | 1 | $21,561 | 39 | 4.95/5.0 |
| Cottages | 1 | $19,538 | 12 | 4.50/5.0 |
| Stephen | 1 | $18,779 | 79 | 4.92/5.0 |
| Elizabeth | 1 | $17,414 | 10 | 4.60/5.0 |
| Jonathan | 1 | $14,014 | 78 | 4.97/5.0 |
| Francis | 1 | $13,934 | 44 | 4.86/5.0 |
| Tim | 2 | $6,289 | 4 | 2.25/5.0 |
Analyzing the strategies of top hosts, such as their property selection, pricing, and guest communication, can offer valuable lessons for optimizing your own Airbnb operations in Middle Crackington.
Dive Deeper: Advanced Middle Crackington STR Market Data (2025)
Ready to unlock more insights? AirROI provides access to advanced metrics and comprehensive Airbnb data for Middle Crackington. Explore detailed analytics beyond this report to refine your investment strategy, optimize pricing, and maximize your vacation rental profits.
Explore Advanced MetricsMiddle Crackington Short-Term Rental Market Composition (2025): Property & Room Types
Room Type Distribution
Property Type Distribution
Market Composition Insights for Middle Crackington
- The Middle Crackington Airbnb market composition is heavily skewed towards Entire Home/Apt listings, which make up 95.2% of the 21 active rentals. This indicates strong guest preference for privacy and space.
- Looking at the property type distribution in Middle Crackington, House properties are the most common (90.5%), reflecting the local real estate landscape.
- Houses represent a significant 90.5% portion, catering likely to families or larger groups.
- Smaller segments like unique stays, outdoor/unique (combined 9.6%) offer potential for unique stay experiences.
Middle Crackington Airbnb Room Capacity Analysis (2025): Bedroom Distribution
Distribution of Listings by Number of Bedrooms
Room Capacity Insights for Middle Crackington
- The dominant room capacity in Middle Crackington is 2 bedrooms listings, making up 38.1% of the market. This suggests a strong demand for properties suitable for couples or solo travelers.
- Together, 2 bedrooms and 3 bedrooms properties represent 71.4% of the active Airbnb listings in Middle Crackington, indicating a high concentration in these sizes.
- A significant 47.6% of listings offer 3+ bedrooms, catering to larger groups and families seeking more space in Middle Crackington.
Middle Crackington Vacation Rental Guest Capacity Trends (2025)
Distribution of Listings by Guest Capacity
Guest Capacity Insights for Middle Crackington
- The most common guest capacity trend in Middle Crackington vacation rentals is listings accommodating 4 guests (33.3%). This suggests the primary traveler segment is likely small families or groups.
- Properties designed for 4 guests and 6 guests dominate the Middle Crackington STR market, accounting for 57.1% of listings.
- 47.6% of properties accommodate 6+ guests, serving the market segment for larger families or group travel in Middle Crackington.
- On average, properties in Middle Crackington are equipped to host 5.0 guests.
Middle Crackington Airbnb Booking Patterns (2025): Available vs. Booked Days
Available Days Distribution
Booked Days Distribution
Booking Pattern Insights for Middle Crackington
- The most common availability pattern in Middle Crackington falls within the 271-366 days range, representing 42.9% of listings. This suggests many properties have significant open periods on their calendars.
- Approximately 66.7% of listings show high availability (181+ days open annually), indicating potential for increased bookings or specific owner usage patterns.
- For booked days, the 91-180 days range is most frequent in Middle Crackington (28.6%), reflecting common guest stay durations or potential owner blocking patterns.
- A notable 33.3% of properties secure long booking periods (181+ days booked per year), highlighting successful long-term rental strategies or significant owner usage.
Middle Crackington Airbnb Minimum Stay Requirements Analysis
Distribution of Listings by Minimum Night Requirement
1 Night
7 listings
33.3% of total
2 Nights
2 listings
9.5% of total
3 Nights
6 listings
28.6% of total
4-6 Nights
3 listings
14.3% of total
30+ Nights
3 listings
14.3% of total
Key Insights
- The most prevalent minimum stay requirement in Middle Crackington is 1 Night, adopted by 33.3% of listings. This highlights the market's preference for shorter, flexible bookings.
- A significant segment (14.3%) caters to monthly stays (30+ nights) in Middle Crackington, pointing to opportunities in the extended-stay market.
Recommendations
- Align with the market by considering a 1 Night minimum stay, as 33.3% of Middle Crackington hosts use this setting.
- Explore offering discounts for stays of 30+ nights to attract the 14.3% of the market seeking extended stays.
- Adjust minimum nights based on seasonality – potentially shorter during low season and longer during peak demand periods in Middle Crackington.
Middle Crackington Airbnb Cancellation Policy Trends Analysis (2025)
Super Strict 60 Days
1 listings
5.3% of total
Firm
3 listings
15.8% of total
Strict
15 listings
78.9% of total
Cancellation Policy Insights for Middle Crackington
- The prevailing Airbnb cancellation policy trend in Middle Crackington is Strict, used by 78.9% of listings.
- A majority (94.7%) of hosts in Middle Crackington utilize Firm or Strict policies, indicating a market where hosts prioritize booking security.
Recommendations for Hosts
- Consider adopting a Strict policy to align with the 78.9% market standard in Middle Crackington.
- With 78.9% using Strict terms, this is a viable option in Middle Crackington, particularly for high-value properties or during peak demand periods.
- Regularly review your cancellation policy against competitors and market demand shifts in Middle Crackington.
Middle Crackington STR Booking Lead Time Analysis (2025)
Average Booking Lead Time by Month
Booking Lead Time Insights for Middle Crackington
- The overall average booking lead time for vacation rentals in Middle Crackington is 66 days.
- Guests book furthest in advance for stays during August (average 95 days), likely coinciding with peak travel demand or local events.
- The shortest booking windows occur for stays in February (average 15 days), indicating more last-minute travel plans during this time.
- Seasonally, Summer (78 days avg.) sees the longest lead times, while Winter (25 days avg.) has the shortest, reflecting typical travel planning cycles.
Recommendations for Hosts
- Use the overall average lead time (66 days) as a baseline for your pricing and availability strategy in Middle Crackington.
- For August stays, consider implementing length-of-stay discounts or slightly higher rates for bookings made less than 95 days out to capitalize on advance planning.
- Target marketing efforts for the Summer season well in advance (at least 78 days) to capture early planners.
- Monitor your own booking lead times against these Middle Crackington averages to identify opportunities for dynamic pricing adjustments.
Popular & Essential Airbnb Amenities in Middle Crackington (2025)
Amenity Prevalence
Amenity Insights for Middle Crackington
- Essential amenities in Middle Crackington that guests expect include: Heating, Free parking on premises, TV, Kitchen, Smoke alarm, Hot water, Wifi. Lacking these (any) could significantly impact bookings.
- Popular amenities like Washer, Refrigerator, Hangers are common but not universal. Offering these can provide a competitive edge.
Recommendations for Hosts
- Ensure your listing includes all essential amenities for Middle Crackington: Heating, Free parking on premises, TV, Kitchen, Smoke alarm, Hot water, Wifi.
- Prioritize adding missing essentials: TV, Kitchen, Smoke alarm, Hot water, Wifi.
- Consider adding popular differentiators like Washer or Refrigerator to increase appeal.
- Highlight unique or less common amenities you offer (e.g., hot tub, dedicated workspace, EV charger) in your listing description and photos.
- Regularly check competitor amenities in Middle Crackington to stay competitive.
Middle Crackington Airbnb Guest Demographics & Profile Analysis (2025)
Guest Profile Summary for Middle Crackington
- The typical guest profile for Airbnb in Middle Crackington consists of primarily domestic travelers (91%), often arriving from nearby England, typically belonging to the Post-2000s (Gen Z/Alpha) group (50%), primarily speaking English or French.
- Domestic travelers account for 91.0% of guests.
- Key international markets include United Kingdom (91%) and United States (2.8%).
- Top languages spoken are English (69.9%) followed by French (7.2%).
- A significant demographic segment is the Post-2000s (Gen Z/Alpha) group, representing 50% of guests.
Recommendations for Hosts
- Target domestic marketing efforts towards travelers from England and London.
- Tailor amenities and listing descriptions to appeal to the dominant Post-2000s (Gen Z/Alpha) demographic (e.g., highlight fast WiFi, smart home features, local guides).
- Highlight unique local experiences or amenities relevant to the primary guest profile.
- Consider seasonal promotions aligned with peak travel times for key origin markets.
Nearby Short-Term Rental Market Comparison
How does the Middle Crackington Airbnb market stack up against its neighbors? Compare key performance metrics like average monthly revenue, ADR, and occupancy rates in surrounding areas to understand the broader regional STR landscape.
| Market | Active Properties | Monthly Revenue | Daily Rate | Avg. Occupancy |
|---|---|---|---|---|
| Llanrhidian | 15 | $4,842 | $386.18 | 53% |
| Crai | 20 | $4,799 | $371.85 | 46% |
| Trenance | 19 | $4,795 | $428.63 | 43% |
| Angle | 13 | $4,602 | $384.81 | 42% |
| Ludchurch | 15 | $4,354 | $291.87 | 43% |
| Redberth | 29 | $4,103 | $223.37 | 59% |
| Higher Crackington | 17 | $3,731 | $340.74 | 37% |
| Milverton | 11 | $3,675 | $393.89 | 37% |
| Pennorth | 13 | $3,595 | $417.69 | 37% |
| Gilwern | 22 | $3,505 | $193.56 | 53% |