Mawnan Smith Airbnb Market Analysis 2025: Short Term Rental Data & Vacation Rental Statistics in England, United Kingdom
Is Airbnb profitable in Mawnan Smith in 2025? Explore comprehensive Airbnb analytics for Mawnan Smith, England, United Kingdom to uncover income potential. This 2025 STR market report for Mawnan Smith, based on AirROI data from April 2024 to March 2025, reveals key trends in the niche market of 34 active listings.
Whether you're considering an Airbnb investment in Mawnan Smith, optimizing your existing vacation rental, or exploring rental arbitrage opportunities, understanding the Mawnan Smith Airbnb data is crucial. Leveraging the low regulation environment is key to maximizing your short term rental income potential. Let's dive into the specifics.
Key Mawnan Smith Airbnb Performance Metrics Overview
Monthly Airbnb Revenue Variations & Income Potential in Mawnan Smith (2025)
Understanding the monthly revenue variations for Airbnb listings in Mawnan Smith is key to maximizing your short term rental income potential. Seasonality significantly impacts earnings. Our analysis, based on data from the past 12 months, shows that the peak revenue month for STRs in Mawnan Smith is typically August, while February often presents the lowest earnings, highlighting opportunities for strategic pricing adjustments during shoulder and low seasons. Explore the typical Airbnb income in Mawnan Smith across different performance tiers:
- Best-in-class properties (Top 10%) achieve $5,005+ monthly, often utilizing dynamic pricing and superior guest experiences.
- Strong performing properties (Top 25%) earn $3,415 or more, indicating effective management and desirable locations/amenities.
- Typical properties (Median) generate around $2,386 per month, representing the average market performance.
- Entry-level properties (Bottom 25%) see earnings around $1,241, often with potential for optimization.
Average Monthly Airbnb Earnings Trend in Mawnan Smith
Mawnan Smith Airbnb Occupancy Rate Trends (2025)
Maximize your bookings by understanding the Mawnan Smith STR occupancy trends. Seasonal demand shifts significantly influence how often properties are booked. Typically, Julysees the highest demand (peak season occupancy), while March experiences the lowest (low season). Effective strategies, like adjusting minimum stays or offering promotions, can boost occupancy during slower periods. Here's how different property tiers perform in Mawnan Smith:
- Best-in-class properties (Top 10%) achieve 81%+ occupancy, indicating high desirability and potentially optimized availability.
- Strong performing properties (Top 25%) maintain 65% or higher occupancy, suggesting good market fit and guest satisfaction.
- Typical properties (Median) have an occupancy rate around 48%.
- Entry-level properties (Bottom 25%) average 29% occupancy, potentially facing higher vacancy.
Average Monthly Occupancy Rate Trend in Mawnan Smith
Average Daily Rate (ADR) Airbnb Trends in Mawnan Smith (2025)
Effective short term rental pricing strategy in Mawnan Smith involves understanding monthly ADR fluctuations. The Average Daily Rate (ADR) for Airbnb in Mawnan Smith typically peaks in August and dips lowest during November. Leveraging Airbnb dynamic pricing tools or strategies based on this seasonality can significantly boost revenue. Here's a look at the typical nightly rates achieved:
- Best-in-class properties (Top 10%) command rates of $302+ per night, often due to premium features or locations.
- Strong performing properties (Top 25%) achieve nightly rates of $217 or more.
- Typical properties (Median) charge around $148 per night.
- Entry-level properties (Bottom 25%) earn around $113 per night.
Average Daily Rate (ADR) Trend by Month in Mawnan Smith
Get Live Mawnan Smith Market Intelligence 👇

Explore Real-time Analytics
Airbnb Seasonality Analysis & Trends in Mawnan Smith (2025)
Peak Season (August, July, June)
- Revenue averages $4,039 per month
- Occupancy rates average 64.9%
- Daily rates average $191
Shoulder Season
- Revenue averages $2,360 per month
- Occupancy maintains around 47.3%
- Daily rates hold near $176
Low Season (February, March, December)
- Revenue drops to average $1,487 per month
- Occupancy decreases to average 33.9%
- Daily rates adjust to average $172
Seasonality Insights for Mawnan Smith
- The Airbnb seasonality in Mawnan Smith shows highly seasonal trends requiring careful strategy. While the sections above show seasonal averages, it's also insightful to look at the extremes:
- During the high season, the absolute peak month showcases Mawnan Smith's highest earning potential, with monthly revenues capable of climbing to $4,372, occupancy reaching a high of 67.7%, and ADRs peaking at $193.
- Conversely, the slowest single month of the year, typically falling within the low season, marks the market's lowest point. In this month, revenue might dip to $1,344, occupancy could drop to 32.1%, and ADRs may adjust down to $166.
- Understanding both the seasonal averages and these monthly peaks and troughs in revenue, occupancy, and ADR is crucial for maximizing your Airbnb profit potential in Mawnan Smith.
Seasonal Strategies for Maximizing Profit
- Peak Season: Maximize revenue through premium pricing and potentially longer minimum stays. Ensure high availability.
- Low Season: Offer competitive pricing, special promotions (e.g., extended stay discounts), and flexible cancellation policies. Target off-season travelers like remote workers or budget-conscious guests.
- Shoulder Seasons: Implement dynamic pricing that balances peak and low rates. Target weekend travelers or specific events. Offer slightly more flexible terms than peak season.
- Regularly analyze your own performance against these Mawnan Smith seasonality benchmarks and adjust your pricing and availability strategy accordingly.
Best Areas for Airbnb Investment in Mawnan Smith (2025)
Exploring the top neighborhoods for short-term rentals in Mawnan Smith? This section highlights key areas, outlining why they are attractive for hosts and guests, along with notable local attractions. Consider these locations based on your target guest profile and investment strategy.
| Neighborhood / Area | Why Host Here? (Target Guests & Appeal) | Key Attractions & Landmarks |
|---|---|---|
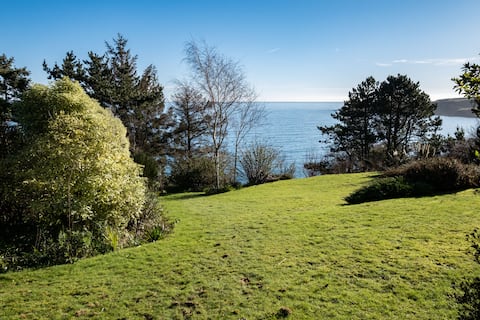
| Mawnan Smith Village | Charming village with beautiful gardens, close to the scenic Helford River and stunning coastal paths. Ideal for guests looking for a peaceful retreat surrounded by nature. | Helford River, Mawnan Smith Gardens, Trebah Garden, Glendurgan Garden, National Trust properties |
| Trebah Garden | Famous sub-tropical garden offering breathtaking views and tranquil walks; a significant drawing point for tourists and garden enthusiasts. | Trebah Garden, Garden Trails, Café and Shop at Trebah |
| Falmouth | Nearby coastal town renowned for its maritime heritage, vibrant arts scene, and beaches. Popular with both tourists and local festivals, maximizing guest occupancy year-round. | Falmouth Harbour, National Maritime Museum, Gyllyngvase Beach, Pendennis Castle, Falmouth Art Gallery |
| Helford Passage | Scenic riverside village providing great sailing and walking opportunities, perfect for those looking for a relaxing getaway. | Helford River walks, Helford ferry, The Ferry Boat Inn |
| St. Mawes | Picturesque village located on the Roseland Peninsula, known for its stunning coastal scenery and historical significance. Great for those seeking a seaside vacation. | St. Mawes Castle, Boat trips to Falmouth, Local beaches, Walking trails |
| Gweek | Quaint village away from the crowds, known for its natural beauty and the nearby Seal Sanctuary. Attracts visitors looking for a small village experience. | Gweek Seal Sanctuary, Coastal walks, River walks |
| Port Navas | A serene village on the river, offers tranquility and rural charm, excellent for those seeking relaxation away from busy tourist hotspots. | River views, Beautiful walks, Secluded beaches |
| Mawnan Smith Coastal Path | Stunning coastal path with breathtaking views, perfect for walkers and outdoor enthusiasts; a major attraction for eco-tourists and adventurers. | Coastal walking paths, Breathtaking views, Wildlife watching |
Understanding Airbnb License Requirements & STR Laws in Mawnan Smith (2025)
While Mawnan Smith, England, United Kingdom currently shows low STR regulations, specific Airbnb license requirements might still exist or change. Always verify the latest short term rental regulations and Airbnb license requirements directly with local government authorities for Mawnan Smith to ensure full compliance before hosting.
(Source: AirROI data, 2025, finding no licensed listings among those analyzed)
Top Performing Airbnb Properties in Mawnan Smith (2025)
Benchmark your potential! Explore examples of top-performing Airbnb properties in Mawnan Smithbased on Trailing Twelve Month (TTM) revenue. Analyze their characteristics, revenue, occupancy rate, and ADR to understand what drives success in this market.

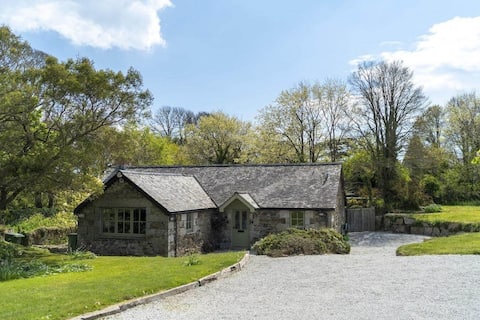
Coastal house with large garden, walk to beaches
Entire Place • 4 bedrooms
Amazing Panoramic Sea Views
Entire Place • 3 bedrooms
Delightful Family Getaway Cornwall
Entire Place • 3 bedrooms
Coastal barn, sea view, woodburner, walk to beach
Entire Place • 1 bedroom

Cosy loft, wood burner, walking distance to beach
Entire Place • 1 bedroom
Tranquil Barn Conversion in Helford Passage, Nr Fa
Entire Place • 3 bedrooms
Note: Performance varies based on location, size, amenities, seasonality, and management quality. Data reflects the past 12 months.
Top Performing Airbnb Hosts in Mawnan Smith (2025)
Learn from the best! This table showcases top-performing Airbnb hosts in Mawnan Smith based on the number of properties managed and estimated total revenue over the past year. Analyze their scale and performance metrics.
| Host Name | Properties | Grossing Revenue | Stay Reviews | Avg Rating |
|---|---|---|---|---|
| Charlotte | 4 | $193,355 | 1079 | 4.95/5.0 |
| Lucy | 2 | $63,827 | 64 | 5.00/5.0 |
| Host #39048965 | 1 | $58,605 | 92 | 4.83/5.0 |
| Ailsa | 2 | $49,221 | 470 | 4.92/5.0 |
| Toby | 1 | $49,133 | 9 | 5.00/5.0 |
| Host #48240870 | 1 | $38,657 | 110 | 4.55/5.0 |
| Mark & Jayne | 3 | $38,625 | 367 | 4.95/5.0 |
| Anna | 1 | $36,210 | 153 | 4.85/5.0 |
| Host #27796880 | 1 | $33,658 | 41 | 5.00/5.0 |
| Melanie | 1 | $30,161 | 54 | 4.87/5.0 |
Analyzing the strategies of top hosts, such as their property selection, pricing, and guest communication, can offer valuable lessons for optimizing your own Airbnb operations in Mawnan Smith.
Dive Deeper: Advanced Mawnan Smith STR Market Data (2025)
Ready to unlock more insights? AirROI provides access to advanced metrics and comprehensive Airbnb data for Mawnan Smith. Explore detailed analytics beyond this report to refine your investment strategy, optimize pricing, and maximize your vacation rental profits.
Explore Advanced MetricsMawnan Smith Short-Term Rental Market Composition (2025): Property & Room Types
Room Type Distribution
Property Type Distribution
Market Composition Insights for Mawnan Smith
- The Mawnan Smith Airbnb market composition is heavily skewed towards Entire Home/Apt listings, which make up 94.1% of the 34 active rentals. This indicates strong guest preference for privacy and space.
- Looking at the property type distribution in Mawnan Smith, House properties are the most common (64.7%), reflecting the local real estate landscape.
- Houses represent a significant 64.7% portion, catering likely to families or larger groups.
- Smaller segments like outdoor/unique, hotel/boutique (combined 5.8%) offer potential for unique stay experiences.
Mawnan Smith Airbnb Room Capacity Analysis (2025): Bedroom Distribution
Distribution of Listings by Number of Bedrooms
Room Capacity Insights for Mawnan Smith
- The dominant room capacity in Mawnan Smith is 1 bedroom listings, making up 32.4% of the market. This suggests a strong demand for properties suitable for couples or solo travelers.
- Together, 1 bedroom and 3 bedrooms properties represent 55.9% of the active Airbnb listings in Mawnan Smith, indicating a high concentration in these sizes.
- A significant 26.4% of listings offer 3+ bedrooms, catering to larger groups and families seeking more space in Mawnan Smith.
Mawnan Smith Vacation Rental Guest Capacity Trends (2025)
Distribution of Listings by Guest Capacity
Guest Capacity Insights for Mawnan Smith
- The most common guest capacity trend in Mawnan Smith vacation rentals is listings accommodating 4 guests (32.4%). This suggests the primary traveler segment is likely small families or groups.
- Properties designed for 4 guests and 2 guests dominate the Mawnan Smith STR market, accounting for 64.8% of listings.
- 23.5% of properties accommodate 6+ guests, serving the market segment for larger families or group travel in Mawnan Smith.
- On average, properties in Mawnan Smith are equipped to host 3.6 guests.
Mawnan Smith Airbnb Booking Patterns (2025): Available vs. Booked Days
Available Days Distribution
Booked Days Distribution
Booking Pattern Insights for Mawnan Smith
- The most common availability pattern in Mawnan Smith falls within the 181-270 days range, representing 38.2% of listings. This suggests many properties have significant open periods on their calendars.
- Approximately 70.6% of listings show high availability (181+ days open annually), indicating potential for increased bookings or specific owner usage patterns.
- For booked days, the 91-180 days range is most frequent in Mawnan Smith (41.2%), reflecting common guest stay durations or potential owner blocking patterns.
- A notable 32.3% of properties secure long booking periods (181+ days booked per year), highlighting successful long-term rental strategies or significant owner usage.
Mawnan Smith Airbnb Minimum Stay Requirements Analysis
Distribution of Listings by Minimum Night Requirement
1 Night
1 listings
3.1% of total
2 Nights
6 listings
18.8% of total
3 Nights
10 listings
31.3% of total
4-6 Nights
8 listings
25% of total
7-29 Nights
1 listings
3.1% of total
30+ Nights
6 listings
18.8% of total
Key Insights
- The most prevalent minimum stay requirement in Mawnan Smith is 3 Nights, adopted by 31.3% of listings. This highlights the market's preference for longer commitments.
- A significant segment (18.8%) caters to monthly stays (30+ nights) in Mawnan Smith, pointing to opportunities in the extended-stay market.
Recommendations
- Align with the market by considering a 3 Nights minimum stay, as 31.3% of Mawnan Smith hosts use this setting.
- If feasible, allowing 1-night stays, especially midweek or during low season, could capture last-minute bookings, as only 3.1% currently do.
- Explore offering discounts for stays of 30+ nights to attract the 18.8% of the market seeking extended stays.
- Adjust minimum nights based on seasonality – potentially shorter during low season and longer during peak demand periods in Mawnan Smith.
Mawnan Smith Airbnb Cancellation Policy Trends Analysis (2025)
Super Strict 60 Days
1 listings
3.3% of total
Flexible
9 listings
30% of total
Moderate
11 listings
36.7% of total
Firm
8 listings
26.7% of total
Strict
1 listings
3.3% of total
Cancellation Policy Insights for Mawnan Smith
- The prevailing Airbnb cancellation policy trend in Mawnan Smith is Moderate, used by 36.7% of listings.
- There's a relatively balanced mix between guest-friendly (66.7%) and stricter (30.0%) policies, offering choices for different guest needs.
- Strict cancellation policies are quite rare (3.3%), potentially making listings with this policy less competitive unless justified by high demand or property type.
Recommendations for Hosts
- Consider adopting a Moderate policy to align with the 36.7% market standard in Mawnan Smith.
- Using a Strict policy might deter some guests, as only 3.3% of listings use it. Evaluate if potential revenue protection outweighs possible lower booking rates.
- Regularly review your cancellation policy against competitors and market demand shifts in Mawnan Smith.
Mawnan Smith STR Booking Lead Time Analysis (2025)
Average Booking Lead Time by Month
Booking Lead Time Insights for Mawnan Smith
- The overall average booking lead time for vacation rentals in Mawnan Smith is 60 days.
- Guests book furthest in advance for stays during May (average 100 days), likely coinciding with peak travel demand or local events.
- The shortest booking windows occur for stays in February (average 22 days), indicating more last-minute travel plans during this time.
- Seasonally, Summer (89 days avg.) sees the longest lead times, while Fall (47 days avg.) has the shortest, reflecting typical travel planning cycles.
Recommendations for Hosts
- Use the overall average lead time (60 days) as a baseline for your pricing and availability strategy in Mawnan Smith.
- For May stays, consider implementing length-of-stay discounts or slightly higher rates for bookings made less than 100 days out to capitalize on advance planning.
- Target marketing efforts for the Summer season well in advance (at least 89 days) to capture early planners.
- Monitor your own booking lead times against these Mawnan Smith averages to identify opportunities for dynamic pricing adjustments.
Popular & Essential Airbnb Amenities in Mawnan Smith (2025)
Amenity Prevalence
Amenity Insights for Mawnan Smith
- Essential amenities in Mawnan Smith that guests expect include: Heating, Hot water, Wifi, TV, Essentials. Lacking these (any) could significantly impact bookings.
- Popular amenities like Kitchen, Cooking basics, Smoke alarm are common but not universal. Offering these can provide a competitive edge.
Recommendations for Hosts
- Ensure your listing includes all essential amenities for Mawnan Smith: Heating, Hot water, Wifi, TV, Essentials.
- Prioritize adding missing essentials: Wifi, TV, Essentials.
- Consider adding popular differentiators like Kitchen or Cooking basics to increase appeal.
- Highlight unique or less common amenities you offer (e.g., hot tub, dedicated workspace, EV charger) in your listing description and photos.
- Regularly check competitor amenities in Mawnan Smith to stay competitive.
Mawnan Smith Airbnb Guest Demographics & Profile Analysis (2025)
Guest Profile Summary for Mawnan Smith
- The typical guest profile for Airbnb in Mawnan Smith consists of primarily domestic travelers (85%), often arriving from nearby England, typically belonging to the Post-2000s (Gen Z/Alpha) group (50%), primarily speaking English or French.
- Domestic travelers account for 85.2% of guests.
- Key international markets include United Kingdom (85.2%) and United States (4%).
- Top languages spoken are English (64.6%) followed by French (11.6%).
- A significant demographic segment is the Post-2000s (Gen Z/Alpha) group, representing 50% of guests.
Recommendations for Hosts
- Target domestic marketing efforts towards travelers from England and London.
- Tailor amenities and listing descriptions to appeal to the dominant Post-2000s (Gen Z/Alpha) demographic (e.g., highlight fast WiFi, smart home features, local guides).
- Highlight unique local experiences or amenities relevant to the primary guest profile.
- Consider seasonal promotions aligned with peak travel times for key origin markets.
Nearby Short-Term Rental Market Comparison
How does the Mawnan Smith Airbnb market stack up against its neighbors? Compare key performance metrics like average monthly revenue, ADR, and occupancy rates in surrounding areas to understand the broader regional STR landscape.
| Market | Active Properties | Monthly Revenue | Daily Rate | Avg. Occupancy |
|---|---|---|---|---|
| Llanrhidian | 15 | $4,842 | $386.18 | 53% |
| Trenance | 19 | $4,795 | $428.63 | 43% |
| Angle | 13 | $4,602 | $384.81 | 42% |
| Ludchurch | 15 | $4,354 | $291.87 | 43% |
| Redberth | 29 | $4,103 | $223.37 | 59% |
| Higher Crackington | 17 | $3,731 | $340.74 | 37% |
| Perranuthnoe | 24 | $3,421 | $352.15 | 37% |
| St. John | 44 | $3,354 | $233.49 | 50% |
| Llanboidy | 10 | $3,280 | $260.08 | 45% |
| Llangennith | 32 | $3,271 | $251.71 | 52% |