Marshfield Airbnb Market Analysis 2025: Short Term Rental Data & Vacation Rental Statistics in England, United Kingdom
Is Airbnb profitable in Marshfield in 2025? Explore comprehensive Airbnb analytics for Marshfield, England, United Kingdom to uncover income potential. This 2025 STR market report for Marshfield, based on AirROI data from April 2024 to March 2025, reveals key trends in the niche market of 18 active listings.
Whether you're considering an Airbnb investment in Marshfield, optimizing your existing vacation rental, or exploring rental arbitrage opportunities, understanding the Marshfield Airbnb data is crucial. Leveraging the low regulation environment is key to maximizing your short term rental income potential. Let's dive into the specifics.
Key Marshfield Airbnb Performance Metrics Overview
Monthly Airbnb Revenue Variations & Income Potential in Marshfield (2025)
Understanding the monthly revenue variations for Airbnb listings in Marshfield is key to maximizing your short term rental income potential. Seasonality significantly impacts earnings. Our analysis, based on data from the past 12 months, shows that the peak revenue month for STRs in Marshfield is typically May, while January often presents the lowest earnings, highlighting opportunities for strategic pricing adjustments during shoulder and low seasons. Explore the typical Airbnb income in Marshfield across different performance tiers:
- Best-in-class properties (Top 10%) achieve $12,736+ monthly, often utilizing dynamic pricing and superior guest experiences.
- Strong performing properties (Top 25%) earn $4,706 or more, indicating effective management and desirable locations/amenities.
- Typical properties (Median) generate around $2,884 per month, representing the average market performance.
- Entry-level properties (Bottom 25%) see earnings around $1,880, often with potential for optimization.
Average Monthly Airbnb Earnings Trend in Marshfield
Marshfield Airbnb Occupancy Rate Trends (2025)
Maximize your bookings by understanding the Marshfield STR occupancy trends. Seasonal demand shifts significantly influence how often properties are booked. Typically, Augustsees the highest demand (peak season occupancy), while January experiences the lowest (low season). Effective strategies, like adjusting minimum stays or offering promotions, can boost occupancy during slower periods. Here's how different property tiers perform in Marshfield:
- Best-in-class properties (Top 10%) achieve 77%+ occupancy, indicating high desirability and potentially optimized availability.
- Strong performing properties (Top 25%) maintain 64% or higher occupancy, suggesting good market fit and guest satisfaction.
- Typical properties (Median) have an occupancy rate around 49%.
- Entry-level properties (Bottom 25%) average 28% occupancy, potentially facing higher vacancy.
Average Monthly Occupancy Rate Trend in Marshfield
Average Daily Rate (ADR) Airbnb Trends in Marshfield (2025)
Effective short term rental pricing strategy in Marshfield involves understanding monthly ADR fluctuations. The Average Daily Rate (ADR) for Airbnb in Marshfield typically peaks in December and dips lowest during April. Leveraging Airbnb dynamic pricing tools or strategies based on this seasonality can significantly boost revenue. Here's a look at the typical nightly rates achieved:
- Best-in-class properties (Top 10%) command rates of $966+ per night, often due to premium features or locations.
- Strong performing properties (Top 25%) achieve nightly rates of $382 or more.
- Typical properties (Median) charge around $177 per night.
- Entry-level properties (Bottom 25%) earn around $128 per night.
Average Daily Rate (ADR) Trend by Month in Marshfield
Get Live Marshfield Market Intelligence 👇

Explore Real-time Analytics
Airbnb Seasonality Analysis & Trends in Marshfield (2025)
Peak Season (May, August, April)
- Revenue averages $6,329 per month
- Occupancy rates average 58.7%
- Daily rates average $328
Shoulder Season
- Revenue averages $4,542 per month
- Occupancy maintains around 48.9%
- Daily rates hold near $351
Low Season (January, February, November)
- Revenue drops to average $2,979 per month
- Occupancy decreases to average 35.3%
- Daily rates adjust to average $371
Seasonality Insights for Marshfield
- The Airbnb seasonality in Marshfield shows highly seasonal trends requiring careful strategy. While the sections above show seasonal averages, it's also insightful to look at the extremes:
- During the high season, the absolute peak month showcases Marshfield's highest earning potential, with monthly revenues capable of climbing to $6,645, occupancy reaching a high of 63.9%, and ADRs peaking at $417.
- Conversely, the slowest single month of the year, typically falling within the low season, marks the market's lowest point. In this month, revenue might dip to $2,770, occupancy could drop to 31.8%, and ADRs may adjust down to $317.
- Understanding both the seasonal averages and these monthly peaks and troughs in revenue, occupancy, and ADR is crucial for maximizing your Airbnb profit potential in Marshfield.
Seasonal Strategies for Maximizing Profit
- Peak Season: Maximize revenue through premium pricing and potentially longer minimum stays. Ensure high availability.
- Low Season: Offer competitive pricing, special promotions (e.g., extended stay discounts), and flexible cancellation policies. Target off-season travelers like remote workers or budget-conscious guests.
- Shoulder Seasons: Implement dynamic pricing that balances peak and low rates. Target weekend travelers or specific events. Offer slightly more flexible terms than peak season.
- Regularly analyze your own performance against these Marshfield seasonality benchmarks and adjust your pricing and availability strategy accordingly.
Best Areas for Airbnb Investment in Marshfield (2025)
Exploring the top neighborhoods for short-term rentals in Marshfield? This section highlights key areas, outlining why they are attractive for hosts and guests, along with notable local attractions. Consider these locations based on your target guest profile and investment strategy.
| Neighborhood / Area | Why Host Here? (Target Guests & Appeal) | Key Attractions & Landmarks |
|---|---|---|
| Marshfield Village | Quaint and picturesque village ideal for a peaceful retreat. Close to nature and offers a relaxing rural experience, perfect for families and couples. | St. Mary’s Church, Marshfield Primary School, The Old Mill, local shops and cafes, Marshfield Cricket Club |
| Chippenham Road | Located on a major road, providing easy access to the surrounding areas and amenities, making it attractive for short-term rentals and easy commuting. | Chippenham Town Centre, Bowood House and Gardens, Local parks and recreational areas, Restaurants and pubs nearby |
| Marshfield Common | Surrounded by beautiful natural landscapes, ideal for nature enthusiasts and outdoor activities, attracting visitors who appreciate tranquility and scenic views. | Marshfield Common Nature Reserve, Walking trails, Picnic spots, Wildlife watching |
| Cotswold Area | Part of the Cotswolds, known for its rolling hills and charming villages, attracting tourists looking for in-depth English countryside experiences. | Cotswold Way, Historic buildings and cottages, Local artisan shops, Farmers markets |
| Bath Road | A bustling area with various shops and eateries, drawing in visitors for shopping and dining experiences, great for short stays. | Retail stores, Cafes and restaurants, Close proximity to Bath and Bristol |
| Local Parks | Green spaces in and around Marshfield ideal for outdoor activities and family gatherings, attracting families and individuals looking for relaxation. | Marshfield Park, Children’s playgrounds, Green picnic areas, Walking trails |
| Historical Sites | Rich in history, with various historical landmarks that attract visitors who appreciate culture and heritage. | Local heritage buildings, Historical exhibitions, Guided tours |
| Commuter Access | Well-connected through public transportation to nearby cities, appealing to business travelers and visitors looking for convenient accommodations. | Bus routes, Train access to Bristol and Bath, Parking facilities |
Understanding Airbnb License Requirements & STR Laws in Marshfield (2025)
While Marshfield, England, United Kingdom currently shows low STR regulations, specific Airbnb license requirements might still exist or change. Always verify the latest short term rental regulations and Airbnb license requirements directly with local government authorities for Marshfield to ensure full compliance before hosting.
(Source: AirROI data, 2025, finding no licensed listings among those analyzed)
Top Performing Airbnb Properties in Marshfield (2025)
Benchmark your potential! Explore examples of top-performing Airbnb properties in Marshfieldbased on Trailing Twelve Month (TTM) revenue. Analyze their characteristics, revenue, occupancy rate, and ADR to understand what drives success in this market.
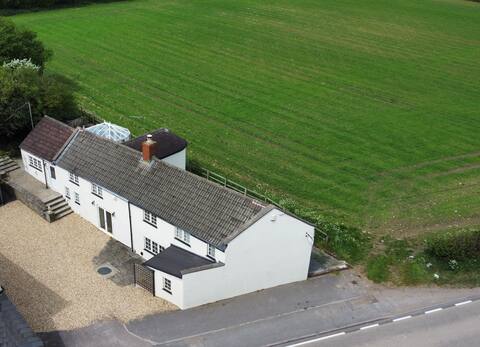
Wisteria View & Log Cabin with hot tub
Entire Place • 4 bedrooms
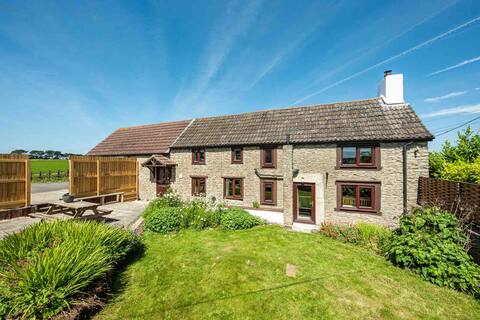
Huge 5 bedroom cottage with hot tub
Entire Place • 5 bedrooms
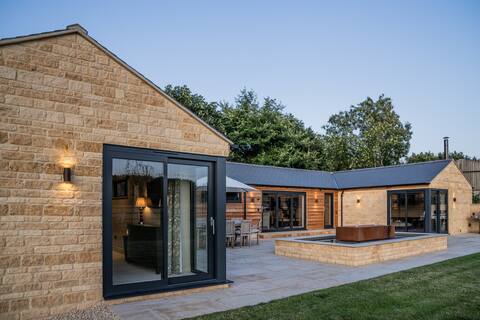
Stylish Cotswold Barn Conversion near Bath
Entire Place • 5 bedrooms
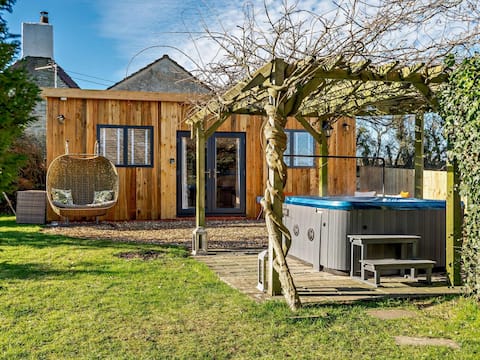
Log Cabin near Bath
Entire Place • 1 bedroom
Cosy Cotswold Cottage near Bath, BBQ and Parking!
Entire Place • 2 bedrooms
Cotswold Cottage near Bath with log fire
Entire Place • 2 bedrooms
Note: Performance varies based on location, size, amenities, seasonality, and management quality. Data reflects the past 12 months.
Top Performing Airbnb Hosts in Marshfield (2025)
Learn from the best! This table showcases top-performing Airbnb hosts in Marshfield based on the number of properties managed and estimated total revenue over the past year. Analyze their scale and performance metrics.
| Host Name | Properties | Grossing Revenue | Stay Reviews | Avg Rating |
|---|---|---|---|---|
| Christian | 2 | $262,025 | 70 | 4.76/5.0 |
| Joe | 1 | $123,488 | 37 | 4.81/5.0 |
| Andrew | 1 | $90,216 | 7 | 5.00/5.0 |
| Rebecca | 1 | $60,385 | 33 | 4.91/5.0 |
| Nicola | 1 | $46,334 | 152 | 4.98/5.0 |
| Sallie | 1 | $45,769 | 81 | 5.00/5.0 |
| Brett | 1 | $37,987 | 17 | 4.94/5.0 |
| Rebecca | 1 | $34,232 | 32 | 4.94/5.0 |
| Hannah | 1 | $31,146 | 27 | 5.00/5.0 |
| James | 1 | $25,558 | 159 | 4.99/5.0 |
Analyzing the strategies of top hosts, such as their property selection, pricing, and guest communication, can offer valuable lessons for optimizing your own Airbnb operations in Marshfield.
Dive Deeper: Advanced Marshfield STR Market Data (2025)
Ready to unlock more insights? AirROI provides access to advanced metrics and comprehensive Airbnb data for Marshfield. Explore detailed analytics beyond this report to refine your investment strategy, optimize pricing, and maximize your vacation rental profits.
Explore Advanced MetricsMarshfield Short-Term Rental Market Composition (2025): Property & Room Types
Room Type Distribution
Property Type Distribution
Market Composition Insights for Marshfield
- The Marshfield Airbnb market composition is heavily skewed towards Entire Home/Apt listings, which make up 94.4% of the 18 active rentals. This indicates strong guest preference for privacy and space.
- Looking at the property type distribution in Marshfield, House properties are the most common (55.6%), reflecting the local real estate landscape.
- Houses represent a significant 55.6% portion, catering likely to families or larger groups.
- The presence of 11.1% Hotel/Boutique listings indicates integration with traditional hospitality.
Marshfield Airbnb Room Capacity Analysis (2025): Bedroom Distribution
Distribution of Listings by Number of Bedrooms
Room Capacity Insights for Marshfield
- The dominant room capacity in Marshfield is 1 bedroom listings, making up 38.9% of the market. This suggests a strong demand for properties suitable for couples or solo travelers.
- Together, 1 bedroom and 2 bedrooms properties represent 61.1% of the active Airbnb listings in Marshfield, indicating a high concentration in these sizes.
- A significant 33.4% of listings offer 3+ bedrooms, catering to larger groups and families seeking more space in Marshfield.
Marshfield Vacation Rental Guest Capacity Trends (2025)
Distribution of Listings by Guest Capacity
Guest Capacity Insights for Marshfield
- The most common guest capacity trend in Marshfield vacation rentals is listings accommodating 4 guests (33.3%). This suggests the primary traveler segment is likely small families or groups.
- Properties designed for 4 guests and 8+ guests dominate the Marshfield STR market, accounting for 55.5% of listings.
- 33.3% of properties accommodate 6+ guests, serving the market segment for larger families or group travel in Marshfield.
- On average, properties in Marshfield are equipped to host 4.4 guests.
Marshfield Airbnb Booking Patterns (2025): Available vs. Booked Days
Available Days Distribution
Booked Days Distribution
Booking Pattern Insights for Marshfield
- The most common availability pattern in Marshfield falls within the 91-180 days range, representing 38.9% of listings. This suggests many properties have significant open periods on their calendars.
- Approximately 61.1% of listings show high availability (181+ days open annually), indicating potential for increased bookings or specific owner usage patterns.
- For booked days, the 181-270 days range is most frequent in Marshfield (38.9%), reflecting common guest stay durations or potential owner blocking patterns.
- A notable 44.5% of properties secure long booking periods (181+ days booked per year), highlighting successful long-term rental strategies or significant owner usage.
Marshfield Airbnb Minimum Stay Requirements Analysis
Distribution of Listings by Minimum Night Requirement
1 Night
3 listings
16.7% of total
2 Nights
9 listings
50% of total
3 Nights
2 listings
11.1% of total
4-6 Nights
1 listings
5.6% of total
7-29 Nights
1 listings
5.6% of total
30+ Nights
2 listings
11.1% of total
Key Insights
- The most prevalent minimum stay requirement in Marshfield is 2 Nights, adopted by 50% of listings. This highlights the market's preference for shorter, flexible bookings.
- A strong majority (66.7%) of the Marshfield Airbnb data shows acceptance of very short stays (1-2 nights), indicating a dynamic, high-turnover market.
- A significant segment (11.1%) caters to monthly stays (30+ nights) in Marshfield, pointing to opportunities in the extended-stay market.
Recommendations
- Align with the market by considering a 2 Nights minimum stay, as 50% of Marshfield hosts use this setting.
- If feasible, allowing 1-night stays, especially midweek or during low season, could capture last-minute bookings, as only 16.7% currently do.
- A 2-night minimum appears standard (50%). Consider this for weekends or peak periods.
- Explore offering discounts for stays of 30+ nights to attract the 11.1% of the market seeking extended stays.
- Adjust minimum nights based on seasonality – potentially shorter during low season and longer during peak demand periods in Marshfield.
Marshfield Airbnb Cancellation Policy Trends Analysis (2025)
Super Strict 60 Days
1 listings
5.6% of total
Flexible
3 listings
16.7% of total
Moderate
6 listings
33.3% of total
Firm
3 listings
16.7% of total
Strict
5 listings
27.8% of total
Cancellation Policy Insights for Marshfield
- The prevailing Airbnb cancellation policy trend in Marshfield is Moderate, used by 33.3% of listings.
- There's a relatively balanced mix between guest-friendly (50.0%) and stricter (44.5%) policies, offering choices for different guest needs.
Recommendations for Hosts
- Consider adopting a Moderate policy to align with the 33.3% market standard in Marshfield.
- Regularly review your cancellation policy against competitors and market demand shifts in Marshfield.
Marshfield STR Booking Lead Time Analysis (2025)
Average Booking Lead Time by Month
Booking Lead Time Insights for Marshfield
- The overall average booking lead time for vacation rentals in Marshfield is 55 days.
- Guests book furthest in advance for stays during May (average 89 days), likely coinciding with peak travel demand or local events.
- The shortest booking windows occur for stays in October (average 34 days), indicating more last-minute travel plans during this time.
- Seasonally, Summer (72 days avg.) sees the longest lead times, while Fall (42 days avg.) has the shortest, reflecting typical travel planning cycles.
Recommendations for Hosts
- Use the overall average lead time (55 days) as a baseline for your pricing and availability strategy in Marshfield.
- For May stays, consider implementing length-of-stay discounts or slightly higher rates for bookings made less than 89 days out to capitalize on advance planning.
- Target marketing efforts for the Summer season well in advance (at least 72 days) to capture early planners.
- Monitor your own booking lead times against these Marshfield averages to identify opportunities for dynamic pricing adjustments.
Popular & Essential Airbnb Amenities in Marshfield (2025)
Amenity Prevalence
Amenity Insights for Marshfield
- Essential amenities in Marshfield that guests expect include: Smoke alarm. Lacking these (this) could significantly impact bookings.
- Popular amenities like Heating, TV, Wifi are common but not universal. Offering these can provide a competitive edge.
- Warning: Wifi is not universally provided but is considered essential globally. Ensure reliable Wifi is offered.
Recommendations for Hosts
- Ensure your listing includes all essential amenities for Marshfield: Smoke alarm.
- Consider adding popular differentiators like Heating or TV to increase appeal.
- Highlight unique or less common amenities you offer (e.g., hot tub, dedicated workspace, EV charger) in your listing description and photos.
- Regularly check competitor amenities in Marshfield to stay competitive.
Marshfield Airbnb Guest Demographics & Profile Analysis (2025)
Guest Profile Summary for Marshfield
- The typical guest profile for Airbnb in Marshfield consists of primarily domestic travelers (79%), often arriving from nearby England, typically belonging to the Post-2000s (Gen Z/Alpha) group (50%), primarily speaking English or German.
- Domestic travelers account for 79.0% of guests.
- Key international markets include United Kingdom (79%) and United States (5.8%).
- Top languages spoken are English (66.5%) followed by German (5.5%).
- A significant demographic segment is the Post-2000s (Gen Z/Alpha) group, representing 50% of guests.
Recommendations for Hosts
- Target domestic marketing efforts towards travelers from England and London.
- Tailor amenities and listing descriptions to appeal to the dominant Post-2000s (Gen Z/Alpha) demographic (e.g., highlight fast WiFi, smart home features, local guides).
- Highlight unique local experiences or amenities relevant to the primary guest profile.
- Consider seasonal promotions aligned with peak travel times for key origin markets.
Nearby Short-Term Rental Market Comparison
How does the Marshfield Airbnb market stack up against its neighbors? Compare key performance metrics like average monthly revenue, ADR, and occupancy rates in surrounding areas to understand the broader regional STR landscape.
| Market | Active Properties | Monthly Revenue | Daily Rate | Avg. Occupancy |
|---|---|---|---|---|
| Englishcombe | 13 | $8,558 | $573.69 | 49% |
| Chew Magna | 14 | $6,649 | $399.59 | 46% |
| Lambourn | 11 | $6,081 | $669.47 | 28% |
| Long Sutton | 17 | $5,726 | $383.88 | 46% |
| Stoke St. Michael | 10 | $5,277 | $424.04 | 42% |
| Winsham | 10 | $5,154 | $484.22 | 52% |
| Oldland Common | 13 | $5,093 | $355.47 | 43% |
| Crai | 20 | $4,799 | $371.85 | 46% |
| Dinton | 11 | $4,637 | $242.16 | 58% |
| Limpley Stoke | 10 | $4,598 | $523.47 | 52% |