Lytchett Minster Airbnb Market Analysis 2025: Short Term Rental Data & Vacation Rental Statistics in England, United Kingdom
Is Airbnb profitable in Lytchett Minster in 2025? Explore comprehensive Airbnb analytics for Lytchett Minster, England, United Kingdom to uncover income potential. This 2025 STR market report for Lytchett Minster, based on AirROI data from April 2024 to March 2025, reveals key trends in the niche market of 26 active listings.
Whether you're considering an Airbnb investment in Lytchett Minster, optimizing your existing vacation rental, or exploring rental arbitrage opportunities, understanding the Lytchett Minster Airbnb data is crucial. Leveraging the low regulation environment is key to maximizing your short term rental income potential. Let's dive into the specifics.
Key Lytchett Minster Airbnb Performance Metrics Overview
Monthly Airbnb Revenue Variations & Income Potential in Lytchett Minster (2025)
Understanding the monthly revenue variations for Airbnb listings in Lytchett Minster is key to maximizing your short term rental income potential. Seasonality significantly impacts earnings. Our analysis, based on data from the past 12 months, shows that the peak revenue month for STRs in Lytchett Minster is typically January, while November often presents the lowest earnings, highlighting opportunities for strategic pricing adjustments during shoulder and low seasons. Explore the typical Airbnb income in Lytchett Minster across different performance tiers:
- Best-in-class properties (Top 10%) achieve $3,801+ monthly, often utilizing dynamic pricing and superior guest experiences.
- Strong performing properties (Top 25%) earn $3,289 or more, indicating effective management and desirable locations/amenities.
- Typical properties (Median) generate around $2,181 per month, representing the average market performance.
- Entry-level properties (Bottom 25%) see earnings around $1,474, often with potential for optimization.
Average Monthly Airbnb Earnings Trend in Lytchett Minster
Lytchett Minster Airbnb Occupancy Rate Trends (2025)
Maximize your bookings by understanding the Lytchett Minster STR occupancy trends. Seasonal demand shifts significantly influence how often properties are booked. Typically, Januarysees the highest demand (peak season occupancy), while November experiences the lowest (low season). Effective strategies, like adjusting minimum stays or offering promotions, can boost occupancy during slower periods. Here's how different property tiers perform in Lytchett Minster:
- Best-in-class properties (Top 10%) achieve 70%+ occupancy, indicating high desirability and potentially optimized availability.
- Strong performing properties (Top 25%) maintain 60% or higher occupancy, suggesting good market fit and guest satisfaction.
- Typical properties (Median) have an occupancy rate around 44%.
- Entry-level properties (Bottom 25%) average 33% occupancy, potentially facing higher vacancy.
Average Monthly Occupancy Rate Trend in Lytchett Minster
Average Daily Rate (ADR) Airbnb Trends in Lytchett Minster (2025)
Effective short term rental pricing strategy in Lytchett Minster involves understanding monthly ADR fluctuations. The Average Daily Rate (ADR) for Airbnb in Lytchett Minster typically peaks in March and dips lowest during September. Leveraging Airbnb dynamic pricing tools or strategies based on this seasonality can significantly boost revenue. Here's a look at the typical nightly rates achieved:
- Best-in-class properties (Top 10%) command rates of $164+ per night, often due to premium features or locations.
- Strong performing properties (Top 25%) achieve nightly rates of $146 or more.
- Typical properties (Median) charge around $128 per night.
- Entry-level properties (Bottom 25%) earn around $122 per night.
Average Daily Rate (ADR) Trend by Month in Lytchett Minster
Get Live Lytchett Minster Market Intelligence 👇

Explore Real-time Analytics
Airbnb Seasonality Analysis & Trends in Lytchett Minster (2025)
Peak Season (January, August, February)
- Revenue averages $3,963 per month
- Occupancy rates average 65.3%
- Daily rates average $148
Shoulder Season
- Revenue averages $2,242 per month
- Occupancy maintains around 46.6%
- Daily rates hold near $133
Low Season (March, November, December)
- Revenue drops to average $1,217 per month
- Occupancy decreases to average 24.9%
- Daily rates adjust to average $151
Seasonality Insights for Lytchett Minster
- The Airbnb seasonality in Lytchett Minster shows highly seasonal trends requiring careful strategy. While the sections above show seasonal averages, it's also insightful to look at the extremes:
- During the high season, the absolute peak month showcases Lytchett Minster's highest earning potential, with monthly revenues capable of climbing to $4,133, occupancy reaching a high of 87.9%, and ADRs peaking at $168.
- Conversely, the slowest single month of the year, typically falling within the low season, marks the market's lowest point. In this month, revenue might dip to $923, occupancy could drop to 22.5%, and ADRs may adjust down to $114.
- Understanding both the seasonal averages and these monthly peaks and troughs in revenue, occupancy, and ADR is crucial for maximizing your Airbnb profit potential in Lytchett Minster.
Seasonal Strategies for Maximizing Profit
- Peak Season: Maximize revenue through premium pricing and potentially longer minimum stays. Ensure high availability.
- Low Season: Offer competitive pricing, special promotions (e.g., extended stay discounts), and flexible cancellation policies. Target off-season travelers like remote workers or budget-conscious guests.
- Shoulder Seasons: Implement dynamic pricing that balances peak and low rates. Target weekend travelers or specific events. Offer slightly more flexible terms than peak season.
- Regularly analyze your own performance against these Lytchett Minster seasonality benchmarks and adjust your pricing and availability strategy accordingly.
Best Areas for Airbnb Investment in Lytchett Minster (2025)
Exploring the top neighborhoods for short-term rentals in Lytchett Minster? This section highlights key areas, outlining why they are attractive for hosts and guests, along with notable local attractions. Consider these locations based on your target guest profile and investment strategy.
| Neighborhood / Area | Why Host Here? (Target Guests & Appeal) | Key Attractions & Landmarks |
|---|---|---|
| Lytchett Minster Town Centre | Heart of the village with convenient access to shops, cafes, and local amenities. Ideal for guests wanting to experience the local lifestyle while being close to nature. | Lytchett Bay Nature Reserve, Local shops and cafes, Historic St. Mary's Church |
| Poole Harbour | A short drive from Lytchett Minster, Poole Harbour offers stunning waterfront views and leisure activities. Great for families and outdoor enthusiasts looking for water sports and beach activities. | Sandbanks Beach, Poole Quay, National Trust Brownsea Island, Water sports rentals |
| Wareham Forest | A beautiful natural area perfect for walking, cycling, and nature trails. Perfect for guests who enjoy the outdoors and are looking for tranquil retreats. | Forest trails, Wildlife spotting, Picnic areas |
| Studland Bay | Famous for its stunning beaches and natural beauty. Popular among beachgoers and nature lovers, ideal for summer vacation rentals. | Studland Beach, Dancing Ledge, Swanage Railway |
| Corfe Castle | Historic site with stunning views, attracting tourists interested in history and heritage. Ideal for guests who appreciate culture and sightseeing. | Corfe Castle ruins, The Purbeck Hills, Railway tours |
| Swanage | A charming seaside town offering traditional beach activities and scenic coastlines. Great for family-friendly stays and summer retreats. | Swanage Beach, Swanage Pier, Historic railway |
| Bournemouth | A vibrant coastal town known for its nightlife, shopping, and beaches, perfect for vacationers looking for both relaxation and entertainment options. | Bournemouth Beach, Pier Approach, Gardens and parklands |
| Ashley Heath | Quieter residential area that provides easy access to the New Forest and attractions nearby. Ideal for guests who prefer a peaceful setting away from busy tourist hotspots. | New Forest National Park, Local parks, Nature trails |
Understanding Airbnb License Requirements & STR Laws in Lytchett Minster (2025)
While Lytchett Minster, England, United Kingdom currently shows low STR regulations, specific Airbnb license requirements might still exist or change. Always verify the latest short term rental regulations and Airbnb license requirements directly with local government authorities for Lytchett Minster to ensure full compliance before hosting.
(Source: AirROI data, 2025, finding no licensed listings among those analyzed)
Top Performing Airbnb Properties in Lytchett Minster (2025)
Benchmark your potential! Explore examples of top-performing Airbnb properties in Lytchett Minsterbased on Trailing Twelve Month (TTM) revenue. Analyze their characteristics, revenue, occupancy rate, and ADR to understand what drives success in this market.
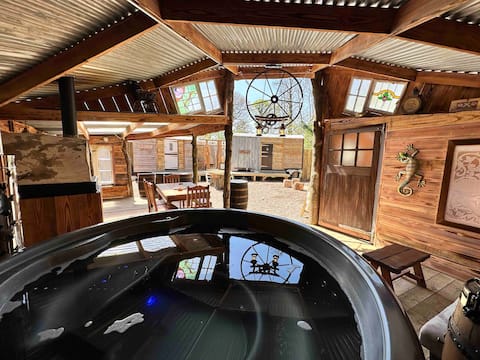
Coach Road Wagons
Entire Place • 2 bedrooms
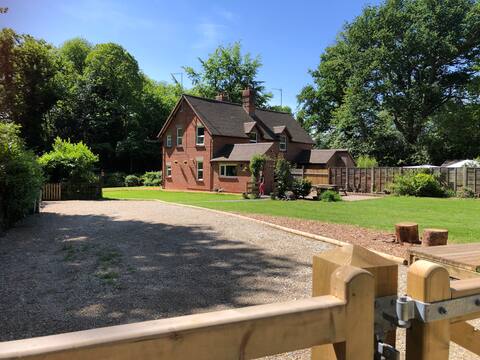
Cottage, Poole Dorset with Optional Hot tub.
Entire Place • 3 bedrooms

Pet Friendly Star Gazing Yurt
Entire Place • N/A

Pet Friendly Star Gazing Yurt
Entire Place • N/A
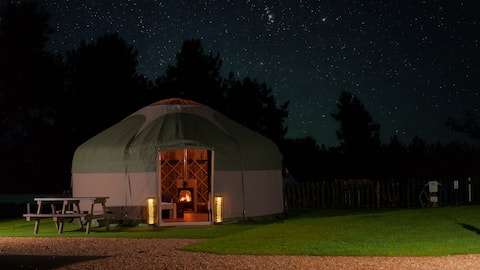
Star Gazing Yurt
Entire Place • N/A

Pet Friendly Star Gazing Yurt
Entire Place • N/A
Note: Performance varies based on location, size, amenities, seasonality, and management quality. Data reflects the past 12 months.
Top Performing Airbnb Hosts in Lytchett Minster (2025)
Learn from the best! This table showcases top-performing Airbnb hosts in Lytchett Minster based on the number of properties managed and estimated total revenue over the past year. Analyze their scale and performance metrics.
| Host Name | Properties | Grossing Revenue | Stay Reviews | Avg Rating |
|---|---|---|---|---|
| Joanne | 24 | $495,536 | 704 | 4.73/5.0 |
| Lucy | 1 | $49,308 | 90 | 4.94/5.0 |
| Dave | 1 | $48,154 | 89 | 4.83/5.0 |
Analyzing the strategies of top hosts, such as their property selection, pricing, and guest communication, can offer valuable lessons for optimizing your own Airbnb operations in Lytchett Minster.
Dive Deeper: Advanced Lytchett Minster STR Market Data (2025)
Ready to unlock more insights? AirROI provides access to advanced metrics and comprehensive Airbnb data for Lytchett Minster. Explore detailed analytics beyond this report to refine your investment strategy, optimize pricing, and maximize your vacation rental profits.
Explore Advanced MetricsLytchett Minster Short-Term Rental Market Composition (2025): Property & Room Types
Room Type Distribution
Property Type Distribution
Market Composition Insights for Lytchett Minster
- The Lytchett Minster Airbnb market composition is heavily skewed towards Entire Home/Apt listings, which make up 96.2% of the 26 active rentals. This indicates strong guest preference for privacy and space.
- Looking at the property type distribution in Lytchett Minster, Outdoor/Unique properties are the most common (69.2%), reflecting the local real estate landscape.
- Smaller segments like house (combined 3.8%) offer potential for unique stay experiences.
Lytchett Minster Airbnb Room Capacity Analysis (2025): Bedroom Distribution
Distribution of Listings by Number of Bedrooms
Room Capacity Insights for Lytchett Minster
- The dominant room capacity in Lytchett Minster is 1 bedroom listings, making up 3.8% of the market. This suggests a strong demand for properties suitable for couples or solo travelers.
- Together, 1 bedroom and 3 bedrooms properties represent 7.6% of the active Airbnb listings in Lytchett Minster, indicating a high concentration in these sizes.
- Listings with 3+ bedrooms (3.8%) represent a smaller niche, potentially indicating an underserved market for larger group accommodations in Lytchett Minster.
Lytchett Minster Vacation Rental Guest Capacity Trends (2025)
Distribution of Listings by Guest Capacity
Guest Capacity Insights for Lytchett Minster
- The most common guest capacity trend in Lytchett Minster vacation rentals is listings accommodating 4 guests (92.3%). This suggests the primary traveler segment is likely small families or groups.
- Properties designed for 4 guests and 6 guests dominate the Lytchett Minster STR market, accounting for 96.1% of listings.
- On average, properties in Lytchett Minster are equipped to host 4.2 guests.
Lytchett Minster Airbnb Booking Patterns (2025): Available vs. Booked Days
Available Days Distribution
Booked Days Distribution
Booking Pattern Insights for Lytchett Minster
- The most common availability pattern in Lytchett Minster falls within the 181-270 days range, representing 42.3% of listings. This suggests many properties have significant open periods on their calendars.
- Approximately 65.4% of listings show high availability (181+ days open annually), indicating potential for increased bookings or specific owner usage patterns.
- For booked days, the 91-180 days range is most frequent in Lytchett Minster (42.3%), reflecting common guest stay durations or potential owner blocking patterns.
- A notable 34.6% of properties secure long booking periods (181+ days booked per year), highlighting successful long-term rental strategies or significant owner usage.
Lytchett Minster Airbnb Minimum Stay Requirements Analysis
Distribution of Listings by Minimum Night Requirement
1 Night
22 listings
84.6% of total
2 Nights
2 listings
7.7% of total
30+ Nights
2 listings
7.7% of total
Key Insights
- The most prevalent minimum stay requirement in Lytchett Minster is 1 Night, adopted by 84.6% of listings. This highlights the market's preference for shorter, flexible bookings.
- A strong majority (92.3%) of the Lytchett Minster Airbnb data shows acceptance of very short stays (1-2 nights), indicating a dynamic, high-turnover market.
Recommendations
- Align with the market by considering a 1 Night minimum stay, as 84.6% of Lytchett Minster hosts use this setting.
- Explore offering discounts for stays of 30+ nights to attract the 7.7% of the market seeking extended stays.
- Adjust minimum nights based on seasonality – potentially shorter during low season and longer during peak demand periods in Lytchett Minster.
Lytchett Minster Airbnb Cancellation Policy Trends Analysis (2025)
Moderate
1 listings
4% of total
Firm
24 listings
96% of total
Cancellation Policy Insights for Lytchett Minster
- The prevailing Airbnb cancellation policy trend in Lytchett Minster is Firm, used by 96% of listings.
- A majority (96.0%) of hosts in Lytchett Minster utilize Firm or Strict policies, indicating a market where hosts prioritize booking security.
Recommendations for Hosts
- Consider adopting a Firm policy to align with the 96% market standard in Lytchett Minster.
- Regularly review your cancellation policy against competitors and market demand shifts in Lytchett Minster.
Lytchett Minster STR Booking Lead Time Analysis (2025)
Average Booking Lead Time by Month
Booking Lead Time Insights for Lytchett Minster
- The overall average booking lead time for vacation rentals in Lytchett Minster is 77 days.
- Guests book furthest in advance for stays during January (average 214 days), likely coinciding with peak travel demand or local events.
- The shortest booking windows occur for stays in March (average 25 days), indicating more last-minute travel plans during this time.
- Seasonally, Winter (150 days avg.) sees the longest lead times, while Fall (44 days avg.) has the shortest, reflecting typical travel planning cycles.
Recommendations for Hosts
- Use the overall average lead time (77 days) as a baseline for your pricing and availability strategy in Lytchett Minster.
- For January stays, consider implementing length-of-stay discounts or slightly higher rates for bookings made less than 214 days out to capitalize on advance planning.
- Target marketing efforts for the Winter season well in advance (at least 150 days) to capture early planners.
- Monitor your own booking lead times against these Lytchett Minster averages to identify opportunities for dynamic pricing adjustments.
Popular & Essential Airbnb Amenities in Lytchett Minster (2025)
Amenity Prevalence
Amenity Insights for Lytchett Minster
- Essential amenities in Lytchett Minster that guests expect include: Heating, Free parking on premises, Fire extinguisher, Smoke alarm, Carbon monoxide alarm, Outdoor playground, TV, Hair dryer, Dryer, Refrigerator. Lacking these (any) could significantly impact bookings.
Recommendations for Hosts
- Ensure your listing includes all essential amenities for Lytchett Minster: Heating, Free parking on premises, Fire extinguisher, Smoke alarm, Carbon monoxide alarm, Outdoor playground, TV, Hair dryer, Dryer, Refrigerator.
- Prioritize adding missing essentials: Outdoor playground, TV, Hair dryer, Dryer, Refrigerator.
- Highlight unique or less common amenities you offer (e.g., hot tub, dedicated workspace, EV charger) in your listing description and photos.
- Regularly check competitor amenities in Lytchett Minster to stay competitive.
Lytchett Minster Airbnb Guest Demographics & Profile Analysis (2025)
Guest Profile Summary for Lytchett Minster
- The typical guest profile for Airbnb in Lytchett Minster consists of primarily domestic travelers (95%), often arriving from nearby England, typically belonging to the Post-2000s (Gen Z/Alpha) group (50%), primarily speaking English or French.
- Domestic travelers account for 95.2% of guests.
- Key international markets include United Kingdom (95.2%) and Germany (1.3%).
- Top languages spoken are English (65.1%) followed by French (5.6%).
- A significant demographic segment is the Post-2000s (Gen Z/Alpha) group, representing 50% of guests.
Recommendations for Hosts
- Target domestic marketing efforts towards travelers from England and London.
- Tailor amenities and listing descriptions to appeal to the dominant Post-2000s (Gen Z/Alpha) demographic (e.g., highlight fast WiFi, smart home features, local guides).
- Highlight unique local experiences or amenities relevant to the primary guest profile.
- Consider seasonal promotions aligned with peak travel times for key origin markets.
Nearby Short-Term Rental Market Comparison
How does the Lytchett Minster Airbnb market stack up against its neighbors? Compare key performance metrics like average monthly revenue, ADR, and occupancy rates in surrounding areas to understand the broader regional STR landscape.
| Market | Active Properties | Monthly Revenue | Daily Rate | Avg. Occupancy |
|---|---|---|---|---|
| Englishcombe | 13 | $8,558 | $573.69 | 49% |
| Chew Magna | 14 | $6,649 | $399.59 | 46% |
| Lambourn | 11 | $6,081 | $669.47 | 28% |
| Long Sutton | 17 | $5,726 | $383.88 | 46% |
| Stoke St. Michael | 10 | $5,277 | $424.04 | 42% |
| Winsham | 10 | $5,154 | $484.22 | 52% |
| Oldland Common | 13 | $5,093 | $355.47 | 43% |
| Crai | 20 | $4,799 | $371.85 | 46% |
| Dinton | 11 | $4,637 | $242.16 | 58% |
| Limpley Stoke | 10 | $4,598 | $523.47 | 52% |