Lyonshall Airbnb Market Analysis 2025: Short Term Rental Data & Vacation Rental Statistics in England, United Kingdom
Is Airbnb profitable in Lyonshall in 2025? Explore comprehensive Airbnb analytics for Lyonshall, England, United Kingdom to uncover income potential. This 2025 STR market report for Lyonshall, based on AirROI data from April 2024 to March 2025, reveals key trends in the niche market of 28 active listings.
Whether you're considering an Airbnb investment in Lyonshall, optimizing your existing vacation rental, or exploring rental arbitrage opportunities, understanding the Lyonshall Airbnb data is crucial. Leveraging the low regulation environment is key to maximizing your short term rental income potential. Let's dive into the specifics.
Key Lyonshall Airbnb Performance Metrics Overview
Monthly Airbnb Revenue Variations & Income Potential in Lyonshall (2025)
Understanding the monthly revenue variations for Airbnb listings in Lyonshall is key to maximizing your short term rental income potential. Seasonality significantly impacts earnings. Our analysis, based on data from the past 12 months, shows that the peak revenue month for STRs in Lyonshall is typically August, while October often presents the lowest earnings, highlighting opportunities for strategic pricing adjustments during shoulder and low seasons. Explore the typical Airbnb income in Lyonshall across different performance tiers:
- Best-in-class properties (Top 10%) achieve $8,456+ monthly, often utilizing dynamic pricing and superior guest experiences.
- Strong performing properties (Top 25%) earn $5,305 or more, indicating effective management and desirable locations/amenities.
- Typical properties (Median) generate around $2,689 per month, representing the average market performance.
- Entry-level properties (Bottom 25%) see earnings around $1,258, often with potential for optimization.
Average Monthly Airbnb Earnings Trend in Lyonshall
Lyonshall Airbnb Occupancy Rate Trends (2025)
Maximize your bookings by understanding the Lyonshall STR occupancy trends. Seasonal demand shifts significantly influence how often properties are booked. Typically, Augustsees the highest demand (peak season occupancy), while January experiences the lowest (low season). Effective strategies, like adjusting minimum stays or offering promotions, can boost occupancy during slower periods. Here's how different property tiers perform in Lyonshall:
- Best-in-class properties (Top 10%) achieve 74%+ occupancy, indicating high desirability and potentially optimized availability.
- Strong performing properties (Top 25%) maintain 56% or higher occupancy, suggesting good market fit and guest satisfaction.
- Typical properties (Median) have an occupancy rate around 33%.
- Entry-level properties (Bottom 25%) average 19% occupancy, potentially facing higher vacancy.
Average Monthly Occupancy Rate Trend in Lyonshall
Average Daily Rate (ADR) Airbnb Trends in Lyonshall (2025)
Effective short term rental pricing strategy in Lyonshall involves understanding monthly ADR fluctuations. The Average Daily Rate (ADR) for Airbnb in Lyonshall typically peaks in May and dips lowest during December. Leveraging Airbnb dynamic pricing tools or strategies based on this seasonality can significantly boost revenue. Here's a look at the typical nightly rates achieved:
- Best-in-class properties (Top 10%) command rates of $926+ per night, often due to premium features or locations.
- Strong performing properties (Top 25%) achieve nightly rates of $282 or more.
- Typical properties (Median) charge around $208 per night.
- Entry-level properties (Bottom 25%) earn around $129 per night.
Average Daily Rate (ADR) Trend by Month in Lyonshall
Get Live Lyonshall Market Intelligence 👇

Explore Real-time Analytics
Airbnb Seasonality Analysis & Trends in Lyonshall (2025)
Peak Season (August, September, June)
- Revenue averages $5,200 per month
- Occupancy rates average 43.9%
- Daily rates average $366
Shoulder Season
- Revenue averages $4,219 per month
- Occupancy maintains around 40.2%
- Daily rates hold near $342
Low Season (January, February, October)
- Revenue drops to average $3,035 per month
- Occupancy decreases to average 30.8%
- Daily rates adjust to average $331
Seasonality Insights for Lyonshall
- The Airbnb seasonality in Lyonshall shows highly seasonal trends requiring careful strategy. While the sections above show seasonal averages, it's also insightful to look at the extremes:
- During the high season, the absolute peak month showcases Lyonshall's highest earning potential, with monthly revenues capable of climbing to $5,633, occupancy reaching a high of 46.8%, and ADRs peaking at $381.
- Conversely, the slowest single month of the year, typically falling within the low season, marks the market's lowest point. In this month, revenue might dip to $2,663, occupancy could drop to 24.9%, and ADRs may adjust down to $307.
- Understanding both the seasonal averages and these monthly peaks and troughs in revenue, occupancy, and ADR is crucial for maximizing your Airbnb profit potential in Lyonshall.
Seasonal Strategies for Maximizing Profit
- Peak Season: Maximize revenue through premium pricing and potentially longer minimum stays. Ensure high availability.
- Low Season: Offer competitive pricing, special promotions (e.g., extended stay discounts), and flexible cancellation policies. Target off-season travelers like remote workers or budget-conscious guests.
- Shoulder Seasons: Implement dynamic pricing that balances peak and low rates. Target weekend travelers or specific events. Offer slightly more flexible terms than peak season.
- Regularly analyze your own performance against these Lyonshall seasonality benchmarks and adjust your pricing and availability strategy accordingly.
Best Areas for Airbnb Investment in Lyonshall (2025)
Exploring the top neighborhoods for short-term rentals in Lyonshall? This section highlights key areas, outlining why they are attractive for hosts and guests, along with notable local attractions. Consider these locations based on your target guest profile and investment strategy.
| Neighborhood / Area | Why Host Here? (Target Guests & Appeal) | Key Attractions & Landmarks |
|---|---|---|
| Lyonshall | Quaint village in Herefordshire, offering a peaceful retreat in the English countryside. Great for families and couples looking for a serene getaway, with proximity to charming local attractions. | Lyonshall Castle, Local countryside trails, Skenfrith Castle, The River Wye, St. Michael's Church |
| Hereford City | Historic city with a vibrant culture and rich history. Popular for tourists visiting the Hereford Cathedral and the surrounding countryside, making it an attractive investment opportunity. | Hereford Cathedral, The Old Market, The Herefordshire Museum, The Cider Museum, Victoria Bridge |
| Kington | Market town known for its international walking festival and scenic views. Attracts tourists seeking outdoor activities and local festivals, ideal for Airbnb hosts. | The Kington Walking Festival, Hergest Ridge, St Mary’s Church, Local shops and cafes, The Offa's Dyke Path |
| Hay-on-Wye | Famous for its literary festival, this town draws book lovers and tourists seeking unique small shops and cafes. An ideal place for short-term rentals. | Hay Festival, Richard Booth's Bookshop, Hay Castle, River Wye activities, Local arts and crafts shops |
| Bredwardine | Picturesque village located along the River Wye, known for its natural beauty. Great for nature lovers and those looking for quiet retreats. | River Wye, Bredwardine Church, Local walking trails, Scenic views, Wildlife spotting |
| Weobley | Charming black-and-white village that attracts visitors interested in heritage and rural tourism. A peaceful place for a relaxing stay. | Weobley Village Museum, St. Peter's Church, Historic black and white buildings, Local pubs and eateries, Countryside walks |
| Wellington | A small town that serves as a convenient base for exploring the surrounding Herefordshire hills. Appeals to tourists and local outdoor enthusiasts. | Wellington Gravel Pits, Local farms, Countryside walks, Community events, Historical sites |
| Bromyard | Market town known for its festivals and markets, providing a quaint experience. Suitable for Airbnb guests who want to enjoy local events and tradition. | Bromyard and Winslow Show, The Bromyard Gala, Local shops and cafes, Historical buildings, Countryside adventures |
Understanding Airbnb License Requirements & STR Laws in Lyonshall (2025)
While Lyonshall, England, United Kingdom currently shows low STR regulations, specific Airbnb license requirements might still exist or change. Always verify the latest short term rental regulations and Airbnb license requirements directly with local government authorities for Lyonshall to ensure full compliance before hosting.
(Source: AirROI data, 2025, finding no licensed listings among those analyzed)
Top Performing Airbnb Properties in Lyonshall (2025)
Benchmark your potential! Explore examples of top-performing Airbnb properties in Lyonshallbased on Trailing Twelve Month (TTM) revenue. Analyze their characteristics, revenue, occupancy rate, and ADR to understand what drives success in this market.
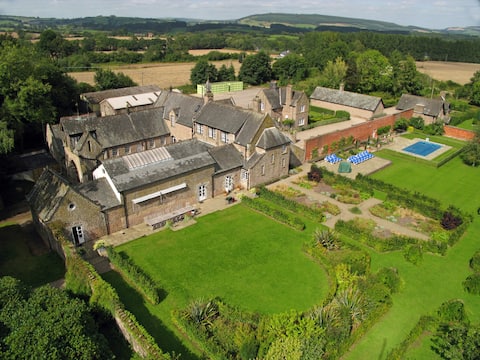
Huge Victorian house with pool - The Colloquy
Entire Place • 8 bedrooms
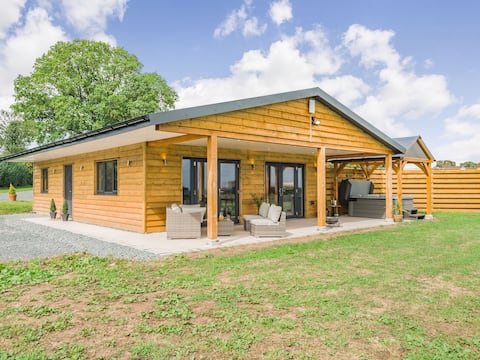
oak Tree Lodge - uk38383
Entire Place • 2 bedrooms
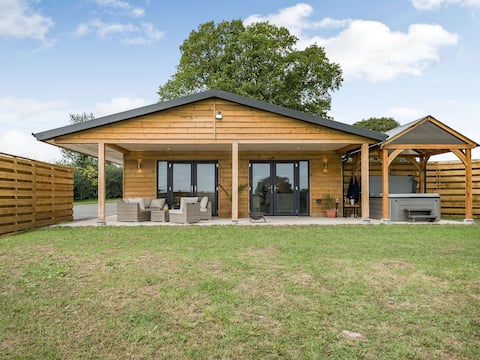
Bramley Lodge - UK38384
Entire Place • 2 bedrooms
No 7 The Threshing Barn. Sleeps 6
Entire Place • 3 bedrooms
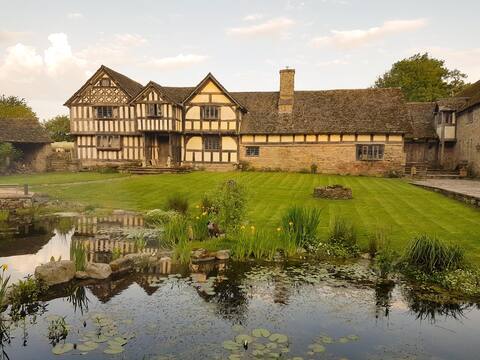
Historic Queen Anne property - The Sherriffs
Entire Place • 8 bedrooms

Vineyard views and hot tub - Field Cottage
Entire Place • 2 bedrooms
Note: Performance varies based on location, size, amenities, seasonality, and management quality. Data reflects the past 12 months.
Top Performing Airbnb Hosts in Lyonshall (2025)
Learn from the best! This table showcases top-performing Airbnb hosts in Lyonshall based on the number of properties managed and estimated total revenue over the past year. Analyze their scale and performance metrics.
| Host Name | Properties | Grossing Revenue | Stay Reviews | Avg Rating |
|---|---|---|---|---|
| Joanna | 6 | $447,473 | 36 | 3.28/5.0 |
| Cottages | 2 | $209,862 | 104 | 4.93/5.0 |
| Laura | 6 | $172,544 | 155 | 4.92/5.0 |
| Verity | 2 | $55,549 | 89 | 4.70/5.0 |
| Cei | 2 | $47,548 | 34 | 5.00/5.0 |
| Emma | 1 | $37,585 | 12 | 5.00/5.0 |
| The Barns | 1 | $34,202 | 4 | 5.00/5.0 |
| El | 1 | $19,709 | 6 | 4.83/5.0 |
| Steve | 3 | $3,254 | 42 | 4.67/5.0 |
| Host #182237374 | 2 | $2,905 | 0 | 0.00/5.0 |
Analyzing the strategies of top hosts, such as their property selection, pricing, and guest communication, can offer valuable lessons for optimizing your own Airbnb operations in Lyonshall.
Dive Deeper: Advanced Lyonshall STR Market Data (2025)
Ready to unlock more insights? AirROI provides access to advanced metrics and comprehensive Airbnb data for Lyonshall. Explore detailed analytics beyond this report to refine your investment strategy, optimize pricing, and maximize your vacation rental profits.
Explore Advanced MetricsLyonshall Short-Term Rental Market Composition (2025): Property & Room Types
Room Type Distribution
Property Type Distribution
Market Composition Insights for Lyonshall
- The Lyonshall Airbnb market composition is heavily skewed towards Entire Home/Apt listings, which make up 100% of the 28 active rentals. This indicates strong guest preference for privacy and space.
- Looking at the property type distribution in Lyonshall, House properties are the most common (50%), reflecting the local real estate landscape.
- Houses represent a significant 50% portion, catering likely to families or larger groups.
- Smaller segments like apartment/condo (combined 3.6%) offer potential for unique stay experiences.
Lyonshall Airbnb Room Capacity Analysis (2025): Bedroom Distribution
Distribution of Listings by Number of Bedrooms
Room Capacity Insights for Lyonshall
- The dominant room capacity in Lyonshall is 1 bedroom listings, making up 50% of the market. This suggests a strong demand for properties suitable for couples or solo travelers.
- Together, 1 bedroom and 2 bedrooms properties represent 71.4% of the active Airbnb listings in Lyonshall, indicating a high concentration in these sizes.
- A significant 28.6% of listings offer 3+ bedrooms, catering to larger groups and families seeking more space in Lyonshall.
Lyonshall Vacation Rental Guest Capacity Trends (2025)
Distribution of Listings by Guest Capacity
Guest Capacity Insights for Lyonshall
- The most common guest capacity trend in Lyonshall vacation rentals is listings accommodating 2 guests (35.7%). This suggests the primary traveler segment is likely couples or solo travelers.
- Properties designed for 2 guests and 4 guests dominate the Lyonshall STR market, accounting for 64.3% of listings.
- 28.6% of properties accommodate 6+ guests, serving the market segment for larger families or group travel in Lyonshall.
- On average, properties in Lyonshall are equipped to host 4.0 guests.
Lyonshall Airbnb Booking Patterns (2025): Available vs. Booked Days
Available Days Distribution
Booked Days Distribution
Booking Pattern Insights for Lyonshall
- The most common availability pattern in Lyonshall falls within the 271-366 days range, representing 46.4% of listings. This suggests many properties have significant open periods on their calendars.
- Approximately 71.4% of listings show high availability (181+ days open annually), indicating potential for increased bookings or specific owner usage patterns.
- For booked days, the 91-180 days range is most frequent in Lyonshall (28.6%), reflecting common guest stay durations or potential owner blocking patterns.
- A notable 28.5% of properties secure long booking periods (181+ days booked per year), highlighting successful long-term rental strategies or significant owner usage.
Lyonshall Airbnb Minimum Stay Requirements Analysis
Distribution of Listings by Minimum Night Requirement
1 Night
5 listings
17.9% of total
2 Nights
14 listings
50% of total
3 Nights
2 listings
7.1% of total
7-29 Nights
1 listings
3.6% of total
30+ Nights
6 listings
21.4% of total
Key Insights
- The most prevalent minimum stay requirement in Lyonshall is 2 Nights, adopted by 50% of listings. This highlights the market's preference for shorter, flexible bookings.
- A strong majority (67.9%) of the Lyonshall Airbnb data shows acceptance of very short stays (1-2 nights), indicating a dynamic, high-turnover market.
- A significant segment (21.4%) caters to monthly stays (30+ nights) in Lyonshall, pointing to opportunities in the extended-stay market.
Recommendations
- Align with the market by considering a 2 Nights minimum stay, as 50% of Lyonshall hosts use this setting.
- If feasible, allowing 1-night stays, especially midweek or during low season, could capture last-minute bookings, as only 17.9% currently do.
- A 2-night minimum appears standard (50%). Consider this for weekends or peak periods.
- Explore offering discounts for stays of 30+ nights to attract the 21.4% of the market seeking extended stays.
- Adjust minimum nights based on seasonality – potentially shorter during low season and longer during peak demand periods in Lyonshall.
Lyonshall Airbnb Cancellation Policy Trends Analysis (2025)
Super Strict 60 Days
2 listings
8.3% of total
Refundable
3 listings
12.5% of total
Non-refundable
3 listings
12.5% of total
Flexible
3 listings
12.5% of total
Moderate
3 listings
12.5% of total
Firm
9 listings
37.5% of total
Strict
1 listings
4.2% of total
Cancellation Policy Insights for Lyonshall
- The prevailing Airbnb cancellation policy trend in Lyonshall is Firm, used by 37.5% of listings.
- There's a relatively balanced mix between guest-friendly (25.0%) and stricter (41.7%) policies, offering choices for different guest needs.
- Strict cancellation policies are quite rare (4.2%), potentially making listings with this policy less competitive unless justified by high demand or property type.
Recommendations for Hosts
- Consider adopting a Firm policy to align with the 37.5% market standard in Lyonshall.
- Using a Strict policy might deter some guests, as only 4.2% of listings use it. Evaluate if potential revenue protection outweighs possible lower booking rates.
- Regularly review your cancellation policy against competitors and market demand shifts in Lyonshall.
Lyonshall STR Booking Lead Time Analysis (2025)
Average Booking Lead Time by Month
Booking Lead Time Insights for Lyonshall
- The overall average booking lead time for vacation rentals in Lyonshall is 45 days.
- Guests book furthest in advance for stays during May (average 149 days), likely coinciding with peak travel demand or local events.
- The shortest booking windows occur for stays in February (average 18 days), indicating more last-minute travel plans during this time.
- Seasonally, Summer (99 days avg.) sees the longest lead times, while Winter (41 days avg.) has the shortest, reflecting typical travel planning cycles.
Recommendations for Hosts
- Use the overall average lead time (45 days) as a baseline for your pricing and availability strategy in Lyonshall.
- For May stays, consider implementing length-of-stay discounts or slightly higher rates for bookings made less than 149 days out to capitalize on advance planning.
- Target marketing efforts for the Summer season well in advance (at least 99 days) to capture early planners.
- Monitor your own booking lead times against these Lyonshall averages to identify opportunities for dynamic pricing adjustments.
Popular & Essential Airbnb Amenities in Lyonshall (2025)
Amenity Prevalence
Amenity Insights for Lyonshall
- Essential amenities in Lyonshall that guests expect include: Free parking on premises, Smoke alarm, Kitchen. Lacking these (any) could significantly impact bookings.
- Popular amenities like Hangers, Refrigerator, Heating are common but not universal. Offering these can provide a competitive edge.
- Warning: Wifi is not universally provided but is considered essential globally. Ensure reliable Wifi is offered.
Recommendations for Hosts
- Ensure your listing includes all essential amenities for Lyonshall: Free parking on premises, Smoke alarm, Kitchen.
- Prioritize adding missing essentials: Kitchen.
- Consider adding popular differentiators like Hangers or Refrigerator to increase appeal.
- Highlight unique or less common amenities you offer (e.g., hot tub, dedicated workspace, EV charger) in your listing description and photos.
- Regularly check competitor amenities in Lyonshall to stay competitive.
Lyonshall Airbnb Guest Demographics & Profile Analysis (2025)
Guest Profile Summary for Lyonshall
- The typical guest profile for Airbnb in Lyonshall consists of primarily domestic travelers (99%), often arriving from nearby England, typically belonging to the Post-2000s (Gen Z/Alpha) group (50%), primarily speaking English or French.
- Domestic travelers account for 99.3% of guests.
- Key international markets include United Kingdom (99.3%) and Ireland (0.7%).
- Top languages spoken are English (83.3%) followed by French (8.3%).
- A significant demographic segment is the Post-2000s (Gen Z/Alpha) group, representing 50% of guests.
Recommendations for Hosts
- Target domestic marketing efforts towards travelers from England and London.
- Tailor amenities and listing descriptions to appeal to the dominant Post-2000s (Gen Z/Alpha) demographic (e.g., highlight fast WiFi, smart home features, local guides).
- Highlight unique local experiences or amenities relevant to the primary guest profile.
- Consider seasonal promotions aligned with peak travel times for key origin markets.
Nearby Short-Term Rental Market Comparison
How does the Lyonshall Airbnb market stack up against its neighbors? Compare key performance metrics like average monthly revenue, ADR, and occupancy rates in surrounding areas to understand the broader regional STR landscape.
| Market | Active Properties | Monthly Revenue | Daily Rate | Avg. Occupancy |
|---|---|---|---|---|
| Englishcombe | 13 | $8,558 | $573.69 | 49% |
| Chew Magna | 14 | $6,649 | $399.59 | 46% |
| Lambourn | 11 | $6,081 | $669.47 | 28% |
| Long Sutton | 17 | $5,726 | $383.88 | 46% |
| Stoke St. Michael | 10 | $5,277 | $424.04 | 42% |
| Oldland Common | 13 | $5,093 | $355.47 | 43% |
| Crai | 20 | $4,799 | $371.85 | 46% |
| Dinton | 11 | $4,637 | $242.16 | 58% |
| Limpley Stoke | 10 | $4,598 | $523.47 | 52% |
| Flore | 10 | $4,534 | $347.03 | 40% |