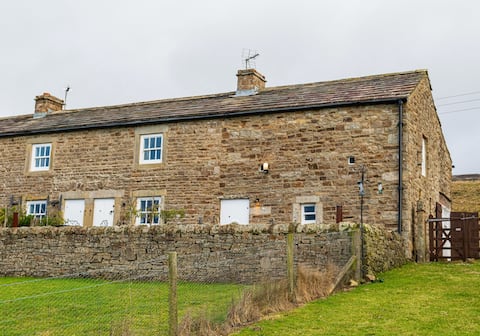
Low Row Airbnb Market Analysis 2025: Short Term Rental Data & Vacation Rental Statistics in England, United Kingdom
Is Airbnb profitable in Low Row in 2025? Explore comprehensive Airbnb analytics for Low Row, England, United Kingdom to uncover income potential. This 2025 STR market report for Low Row, based on AirROI data from April 2024 to March 2025, reveals key trends in the niche market of 18 active listings.
Whether you're considering an Airbnb investment in Low Row, optimizing your existing vacation rental, or exploring rental arbitrage opportunities, understanding the Low Row Airbnb data is crucial. Leveraging the low regulation environment is key to maximizing your short term rental income potential. Let's dive into the specifics.
Key Low Row Airbnb Performance Metrics Overview
Monthly Airbnb Revenue Variations & Income Potential in Low Row (2025)
Understanding the monthly revenue variations for Airbnb listings in Low Row is key to maximizing your short term rental income potential. Seasonality significantly impacts earnings. Our analysis, based on data from the past 12 months, shows that the peak revenue month for STRs in Low Row is typically August, while November often presents the lowest earnings, highlighting opportunities for strategic pricing adjustments during shoulder and low seasons. Explore the typical Airbnb income in Low Row across different performance tiers:
- Best-in-class properties (Top 10%) achieve $7,166+ monthly, often utilizing dynamic pricing and superior guest experiences.
- Strong performing properties (Top 25%) earn $4,619 or more, indicating effective management and desirable locations/amenities.
- Typical properties (Median) generate around $2,618 per month, representing the average market performance.
- Entry-level properties (Bottom 25%) see earnings around $1,212, often with potential for optimization.
Average Monthly Airbnb Earnings Trend in Low Row
Low Row Airbnb Occupancy Rate Trends (2025)
Maximize your bookings by understanding the Low Row STR occupancy trends. Seasonal demand shifts significantly influence how often properties are booked. Typically, Augustsees the highest demand (peak season occupancy), while March experiences the lowest (low season). Effective strategies, like adjusting minimum stays or offering promotions, can boost occupancy during slower periods. Here's how different property tiers perform in Low Row:
- Best-in-class properties (Top 10%) achieve 71%+ occupancy, indicating high desirability and potentially optimized availability.
- Strong performing properties (Top 25%) maintain 58% or higher occupancy, suggesting good market fit and guest satisfaction.
- Typical properties (Median) have an occupancy rate around 37%.
- Entry-level properties (Bottom 25%) average 22% occupancy, potentially facing higher vacancy.
Average Monthly Occupancy Rate Trend in Low Row
Average Daily Rate (ADR) Airbnb Trends in Low Row (2025)
Effective short term rental pricing strategy in Low Row involves understanding monthly ADR fluctuations. The Average Daily Rate (ADR) for Airbnb in Low Row typically peaks in December and dips lowest during April. Leveraging Airbnb dynamic pricing tools or strategies based on this seasonality can significantly boost revenue. Here's a look at the typical nightly rates achieved:
- Best-in-class properties (Top 10%) command rates of $865+ per night, often due to premium features or locations.
- Strong performing properties (Top 25%) achieve nightly rates of $274 or more.
- Typical properties (Median) charge around $203 per night.
- Entry-level properties (Bottom 25%) earn around $136 per night.
Average Daily Rate (ADR) Trend by Month in Low Row
Get Live Low Row Market Intelligence 👇

Explore Real-time Analytics
Airbnb Seasonality Analysis & Trends in Low Row (2025)
Peak Season (August, July, October)
- Revenue averages $4,762 per month
- Occupancy rates average 51.3%
- Daily rates average $296
Shoulder Season
- Revenue averages $3,717 per month
- Occupancy maintains around 39.6%
- Daily rates hold near $304
Low Season (May, June, November)
- Revenue drops to average $2,879 per month
- Occupancy decreases to average 35.3%
- Daily rates adjust to average $293
Seasonality Insights for Low Row
- The Airbnb seasonality in Low Row shows moderate seasonality with distinct peak and low periods. While the sections above show seasonal averages, it's also insightful to look at the extremes:
- During the high season, the absolute peak month showcases Low Row's highest earning potential, with monthly revenues capable of climbing to $5,363, occupancy reaching a high of 61.0%, and ADRs peaking at $322.
- Conversely, the slowest single month of the year, typically falling within the low season, marks the market's lowest point. In this month, revenue might dip to $2,735, occupancy could drop to 28.6%, and ADRs may adjust down to $274.
- Understanding both the seasonal averages and these monthly peaks and troughs in revenue, occupancy, and ADR is crucial for maximizing your Airbnb profit potential in Low Row.
Seasonal Strategies for Maximizing Profit
- Peak Season: Maximize revenue through premium pricing and potentially longer minimum stays. Ensure high availability.
- Low Season: Offer competitive pricing, special promotions (e.g., extended stay discounts), and flexible cancellation policies. Target off-season travelers like remote workers or budget-conscious guests.
- Shoulder Seasons: Implement dynamic pricing that balances peak and low rates. Target weekend travelers or specific events. Offer slightly more flexible terms than peak season.
- Regularly analyze your own performance against these Low Row seasonality benchmarks and adjust your pricing and availability strategy accordingly.
Best Areas for Airbnb Investment in Low Row (2025)
Exploring the top neighborhoods for short-term rentals in Low Row? This section highlights key areas, outlining why they are attractive for hosts and guests, along with notable local attractions. Consider these locations based on your target guest profile and investment strategy.
| Neighborhood / Area | Why Host Here? (Target Guests & Appeal) | Key Attractions & Landmarks |
|---|---|---|
| Low Row | A picturesque village located in the Yorkshire Dales, offering serene rural landscapes and traditional English ambiance. Ideal for those looking to escape the hustle and bustle of city life, attracting visitors who enjoy nature and outdoor activities. | Yorkshire Dales National Park, Swaledale, Hawes, Hardrow Force Waterfall, Wensleydale Creamery |
| Richmond | A charming market town known for its historical sites and beautiful scenery along the River Swale. Offers a mix of culture, history, and nature, making it a desirable spot for tourists and travelers. | Richmond Castle, Richmond Market Square, Easby Abbey, The Station, River Swale |
| Kirkby Stephen | A small town that serves as a gateway to the stunning landscapes of the North Pennines and offers a mix of outdoor activities and local culture. Popular for walkers and nature enthusiasts. | St. Stephen's Church, Appleby Castle, Rutter Force Waterfall, North Pennines Area of Outstanding Natural Beauty, The Settle-Carlisle Railway |
| Hawes | A bustling village renowned for its cheese production and charming streets. It attracts visitors for its market, shops, and surrounding natural beauty. | Hawes Market, Wensleydale Creamery, Hardraw Force, Dale Head Hall, The Dales Countryside Museum |
| Aysgarth | Known for its stunning waterfalls and beautiful walks, Aysgarth is a popular base for tourists exploring the Yorkshire Dales. Ideal for nature lovers and outdoor activities. | Aysgarth Falls, Yorkshire Dales National Park, Bolton Castle, Aysgarth Church, The Pennine Way |
| Grassington | A vibrant village that provides a focal point for visitors to the Dales, offering quaint streets, charming shops, and local festivals. Appeals to those seeking an authentic Yorkshire experience. | Grassington Festival, The Grassington National Park Centre, Linton Falls, The Old School, Grassington Market |
| Sedbergh | A quaint market town that is popular with walkers and cyclists, Sedbergh offers a gateway to the Howgill Fells and has a rich literary history. | Sedbergh School, Dentdale, Howgill Fells, Sedbergh Book Town, The Historic Church of St. Andrew |
| Askrigg | A picturesque village in Wensleydale, loved for its idyllic scenery and notable filming locations. Offers a peaceful retreat for visitors seeking tranquility and natural beauty. | Askrigg village, The Green Dragon Inn, Wensleydale Railway, Wensleydale Creamery, Yorkshire Dales |
Understanding Airbnb License Requirements & STR Laws in Low Row (2025)
While Low Row, England, United Kingdom currently shows low STR regulations, specific Airbnb license requirements might still exist or change. Always verify the latest short term rental regulations and Airbnb license requirements directly with local government authorities for Low Row to ensure full compliance before hosting.
(Source: AirROI data, 2025, finding no licensed listings among those analyzed)
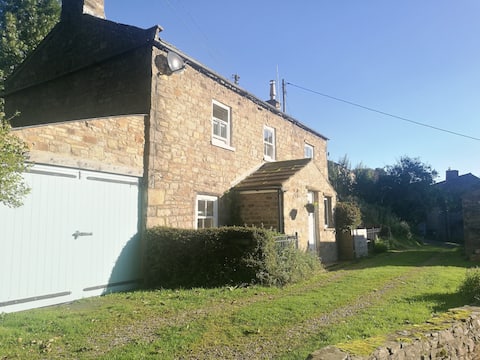
Top Performing Airbnb Properties in Low Row (2025)
Benchmark your potential! Explore examples of top-performing Airbnb properties in Low Rowbased on Trailing Twelve Month (TTM) revenue. Analyze their characteristics, revenue, occupancy rate, and ADR to understand what drives success in this market.

Large Country Residence
Entire Place • 8 bedrooms
Sandpiper
Entire Place • 2 bedrooms
Cosy Luxury Yorkshire Dales Cottage, sleeps 8
Entire Place • 4 bedrooms

Elegant Retreat: Where Tradition Meets Innovation
Entire Place • 4 bedrooms
Swale View
Entire Place • 3 bedrooms

Luxury Romantic - Swaledale Shepherds Hut
Entire Place • 1 bedroom
Note: Performance varies based on location, size, amenities, seasonality, and management quality. Data reflects the past 12 months.
Top Performing Airbnb Hosts in Low Row (2025)
Learn from the best! This table showcases top-performing Airbnb hosts in Low Row based on the number of properties managed and estimated total revenue over the past year. Analyze their scale and performance metrics.
| Host Name | Properties | Grossing Revenue | Stay Reviews | Avg Rating |
|---|---|---|---|---|
| Catherine | 2 | $187,776 | 50 | 4.99/5.0 |
| Hannah | 3 | $105,410 | 64 | 3.23/5.0 |
| Caroline | 1 | $52,690 | 164 | 4.92/5.0 |
| Neha | 1 | $49,596 | 136 | 4.92/5.0 |
| Michael | 3 | $47,251 | 287 | 4.90/5.0 |
| Louise | 1 | $32,734 | 119 | 4.99/5.0 |
| Mark | 1 | $26,468 | 16 | 5.00/5.0 |
| Emily | 1 | $23,064 | 12 | 4.67/5.0 |
| Host #217551926 | 1 | $21,116 | 0 | 0.00/5.0 |
| Ingrid Flute'S Yorks Hol Cotta | 1 | $18,379 | 4 | 4.75/5.0 |
Analyzing the strategies of top hosts, such as their property selection, pricing, and guest communication, can offer valuable lessons for optimizing your own Airbnb operations in Low Row.
Dive Deeper: Advanced Low Row STR Market Data (2025)
Ready to unlock more insights? AirROI provides access to advanced metrics and comprehensive Airbnb data for Low Row. Explore detailed analytics beyond this report to refine your investment strategy, optimize pricing, and maximize your vacation rental profits.
Explore Advanced MetricsLow Row Short-Term Rental Market Composition (2025): Property & Room Types
Room Type Distribution
Property Type Distribution
Market Composition Insights for Low Row
- The Low Row Airbnb market composition is heavily skewed towards Entire Home/Apt listings, which make up 94.4% of the 18 active rentals. This indicates strong guest preference for privacy and space.
- Looking at the property type distribution in Low Row, House properties are the most common (72.2%), reflecting the local real estate landscape.
- Houses represent a significant 72.2% portion, catering likely to families or larger groups.
- The presence of 5.6% Hotel/Boutique listings indicates integration with traditional hospitality.
Low Row Airbnb Room Capacity Analysis (2025): Bedroom Distribution
Distribution of Listings by Number of Bedrooms
Room Capacity Insights for Low Row
- The dominant room capacity in Low Row is 2 bedrooms listings, making up 27.8% of the market. This suggests a strong demand for properties suitable for couples or solo travelers.
- Together, 2 bedrooms and 1 bedroom properties represent 55.6% of the active Airbnb listings in Low Row, indicating a high concentration in these sizes.
- A significant 44.4% of listings offer 3+ bedrooms, catering to larger groups and families seeking more space in Low Row.
Low Row Vacation Rental Guest Capacity Trends (2025)
Distribution of Listings by Guest Capacity
Guest Capacity Insights for Low Row
- The most common guest capacity trend in Low Row vacation rentals is listings accommodating 2 guests (27.8%). This suggests the primary traveler segment is likely couples or solo travelers.
- Properties designed for 2 guests and 4 guests dominate the Low Row STR market, accounting for 44.5% of listings.
- 33.4% of properties accommodate 6+ guests, serving the market segment for larger families or group travel in Low Row.
- On average, properties in Low Row are equipped to host 4.5 guests.
Low Row Airbnb Booking Patterns (2025): Available vs. Booked Days
Available Days Distribution
Booked Days Distribution
Booking Pattern Insights for Low Row
- The most common availability pattern in Low Row falls within the 271-366 days range, representing 50% of listings. This suggests many properties have significant open periods on their calendars.
- Approximately 83.3% of listings show high availability (181+ days open annually), indicating potential for increased bookings or specific owner usage patterns.
- For booked days, the 31-90 days range is most frequent in Low Row (33.3%), reflecting common guest stay durations or potential owner blocking patterns.
- A notable 16.7% of properties secure long booking periods (181+ days booked per year), highlighting successful long-term rental strategies or significant owner usage.
Low Row Airbnb Minimum Stay Requirements Analysis
Distribution of Listings by Minimum Night Requirement
1 Night
6 listings
40% of total
2 Nights
5 listings
33.3% of total
4-6 Nights
1 listings
6.7% of total
7-29 Nights
1 listings
6.7% of total
30+ Nights
2 listings
13.3% of total
Key Insights
- The most prevalent minimum stay requirement in Low Row is 1 Night, adopted by 40% of listings. This highlights the market's preference for shorter, flexible bookings.
- A strong majority (73.3%) of the Low Row Airbnb data shows acceptance of very short stays (1-2 nights), indicating a dynamic, high-turnover market.
- A significant segment (13.3%) caters to monthly stays (30+ nights) in Low Row, pointing to opportunities in the extended-stay market.
Recommendations
- Align with the market by considering a 1 Night minimum stay, as 40% of Low Row hosts use this setting.
- Explore offering discounts for stays of 30+ nights to attract the 13.3% of the market seeking extended stays.
- Adjust minimum nights based on seasonality – potentially shorter during low season and longer during peak demand periods in Low Row.
Low Row Airbnb Cancellation Policy Trends Analysis (2025)
Super Strict 60 Days
3 listings
18.8% of total
Flexible
3 listings
18.8% of total
Moderate
2 listings
12.5% of total
Firm
6 listings
37.5% of total
Strict
2 listings
12.5% of total
Cancellation Policy Insights for Low Row
- The prevailing Airbnb cancellation policy trend in Low Row is Firm, used by 37.5% of listings.
- There's a relatively balanced mix between guest-friendly (31.3%) and stricter (50.0%) policies, offering choices for different guest needs.
Recommendations for Hosts
- Consider adopting a Firm policy to align with the 37.5% market standard in Low Row.
- Using a Strict policy might deter some guests, as only 12.5% of listings use it. Evaluate if potential revenue protection outweighs possible lower booking rates.
- Regularly review your cancellation policy against competitors and market demand shifts in Low Row.
Low Row STR Booking Lead Time Analysis (2025)
Average Booking Lead Time by Month
Booking Lead Time Insights for Low Row
- The overall average booking lead time for vacation rentals in Low Row is 74 days.
- Guests book furthest in advance for stays during May (average 117 days), likely coinciding with peak travel demand or local events.
- The shortest booking windows occur for stays in February (average 55 days), indicating more last-minute travel plans during this time.
- Seasonally, Summer (96 days avg.) sees the longest lead times, while Winter (64 days avg.) has the shortest, reflecting typical travel planning cycles.
Recommendations for Hosts
- Use the overall average lead time (74 days) as a baseline for your pricing and availability strategy in Low Row.
- For May stays, consider implementing length-of-stay discounts or slightly higher rates for bookings made less than 117 days out to capitalize on advance planning.
- Target marketing efforts for the Summer season well in advance (at least 96 days) to capture early planners.
- Monitor your own booking lead times against these Low Row averages to identify opportunities for dynamic pricing adjustments.
Popular & Essential Airbnb Amenities in Low Row (2025)
Amenity Prevalence
Amenity Insights for Low Row
- Popular amenities like Smoke alarm, Bed linens, Carbon monoxide alarm are common but not universal. Offering these can provide a competitive edge.
Recommendations for Hosts
- Consider adding popular differentiators like Smoke alarm or Bed linens to increase appeal.
- Highlight unique or less common amenities you offer (e.g., hot tub, dedicated workspace, EV charger) in your listing description and photos.
- Regularly check competitor amenities in Low Row to stay competitive.
Low Row Airbnb Guest Demographics & Profile Analysis (2025)
Guest Profile Summary for Low Row
- The typical guest profile for Airbnb in Low Row consists of primarily domestic travelers (95%), often arriving from nearby England, typically belonging to the Post-2000s (Gen Z/Alpha) group (50%), primarily speaking English or French.
- Domestic travelers account for 94.7% of guests.
- Key international markets include United Kingdom (94.7%) and United States (2.7%).
- Top languages spoken are English (81.5%) followed by French (6.2%).
- A significant demographic segment is the Post-2000s (Gen Z/Alpha) group, representing 50% of guests.
Recommendations for Hosts
- Target domestic marketing efforts towards travelers from England and London.
- Tailor amenities and listing descriptions to appeal to the dominant Post-2000s (Gen Z/Alpha) demographic (e.g., highlight fast WiFi, smart home features, local guides).
- Highlight unique local experiences or amenities relevant to the primary guest profile.
- Consider seasonal promotions aligned with peak travel times for key origin markets.
Nearby Short-Term Rental Market Comparison
How does the Low Row Airbnb market stack up against its neighbors? Compare key performance metrics like average monthly revenue, ADR, and occupancy rates in surrounding areas to understand the broader regional STR landscape.
| Market | Active Properties | Monthly Revenue | Daily Rate | Avg. Occupancy |
|---|---|---|---|---|
| Gorebridge | 12 | $6,209 | $493.62 | 54% |
| Grinton | 14 | $5,456 | $365.05 | 51% |
| Cartmel Fell | 17 | $4,719 | $331.68 | 52% |
| Casterton | 11 | $4,578 | $300.82 | 51% |
| Cark | 11 | $4,540 | $885.21 | 31% |
| City of Edinburgh | 4,312 | $4,528 | $274.67 | 61% |
| Eglwys-bach | 16 | $4,413 | $315.23 | 52% |
| Waverton | 16 | $4,358 | $444.20 | 33% |
| Hayton | 13 | $4,333 | $239.53 | 60% |
| Watermillock | 16 | $4,281 | $274.03 | 50% |