Lofthouse Airbnb Market Analysis 2025: Short Term Rental Data & Vacation Rental Statistics in England, United Kingdom
Is Airbnb profitable in Lofthouse in 2025? Explore comprehensive Airbnb analytics for Lofthouse, England, United Kingdom to uncover income potential. This 2025 STR market report for Lofthouse, based on AirROI data from April 2024 to March 2025, reveals key trends in the niche market of 18 active listings.
Whether you're considering an Airbnb investment in Lofthouse, optimizing your existing vacation rental, or exploring rental arbitrage opportunities, understanding the Lofthouse Airbnb data is crucial. Leveraging the low regulation environment is key to maximizing your short term rental income potential. Let's dive into the specifics.
Key Lofthouse Airbnb Performance Metrics Overview
Monthly Airbnb Revenue Variations & Income Potential in Lofthouse (2025)
Understanding the monthly revenue variations for Airbnb listings in Lofthouse is key to maximizing your short term rental income potential. Seasonality significantly impacts earnings. Our analysis, based on data from the past 12 months, shows that the peak revenue month for STRs in Lofthouse is typically August, while January often presents the lowest earnings, highlighting opportunities for strategic pricing adjustments during shoulder and low seasons. Explore the typical Airbnb income in Lofthouse across different performance tiers:
- Best-in-class properties (Top 10%) achieve $5,042+ monthly, often utilizing dynamic pricing and superior guest experiences.
- Strong performing properties (Top 25%) earn $3,746 or more, indicating effective management and desirable locations/amenities.
- Typical properties (Median) generate around $2,652 per month, representing the average market performance.
- Entry-level properties (Bottom 25%) see earnings around $1,624, often with potential for optimization.
Average Monthly Airbnb Earnings Trend in Lofthouse
Lofthouse Airbnb Occupancy Rate Trends (2025)
Maximize your bookings by understanding the Lofthouse STR occupancy trends. Seasonal demand shifts significantly influence how often properties are booked. Typically, Julysees the highest demand (peak season occupancy), while January experiences the lowest (low season). Effective strategies, like adjusting minimum stays or offering promotions, can boost occupancy during slower periods. Here's how different property tiers perform in Lofthouse:
- Best-in-class properties (Top 10%) achieve 82%+ occupancy, indicating high desirability and potentially optimized availability.
- Strong performing properties (Top 25%) maintain 73% or higher occupancy, suggesting good market fit and guest satisfaction.
- Typical properties (Median) have an occupancy rate around 50%.
- Entry-level properties (Bottom 25%) average 27% occupancy, potentially facing higher vacancy.
Average Monthly Occupancy Rate Trend in Lofthouse
Average Daily Rate (ADR) Airbnb Trends in Lofthouse (2025)
Effective short term rental pricing strategy in Lofthouse involves understanding monthly ADR fluctuations. The Average Daily Rate (ADR) for Airbnb in Lofthouse typically peaks in August and dips lowest during March. Leveraging Airbnb dynamic pricing tools or strategies based on this seasonality can significantly boost revenue. Here's a look at the typical nightly rates achieved:
- Best-in-class properties (Top 10%) command rates of $400+ per night, often due to premium features or locations.
- Strong performing properties (Top 25%) achieve nightly rates of $238 or more.
- Typical properties (Median) charge around $180 per night.
- Entry-level properties (Bottom 25%) earn around $128 per night.
Average Daily Rate (ADR) Trend by Month in Lofthouse
Get Live Lofthouse Market Intelligence 👇

Explore Real-time Analytics
Airbnb Seasonality Analysis & Trends in Lofthouse (2025)
Peak Season (August, July, June)
- Revenue averages $4,014 per month
- Occupancy rates average 61.2%
- Daily rates average $284
Shoulder Season
- Revenue averages $2,903 per month
- Occupancy maintains around 51.2%
- Daily rates hold near $245
Low Season (January, March, November)
- Revenue drops to average $1,805 per month
- Occupancy decreases to average 34.8%
- Daily rates adjust to average $186
Seasonality Insights for Lofthouse
- The Airbnb seasonality in Lofthouse shows highly seasonal trends requiring careful strategy. While the sections above show seasonal averages, it's also insightful to look at the extremes:
- During the high season, the absolute peak month showcases Lofthouse's highest earning potential, with monthly revenues capable of climbing to $4,143, occupancy reaching a high of 62.8%, and ADRs peaking at $291.
- Conversely, the slowest single month of the year, typically falling within the low season, marks the market's lowest point. In this month, revenue might dip to $1,511, occupancy could drop to 27.8%, and ADRs may adjust down to $184.
- Understanding both the seasonal averages and these monthly peaks and troughs in revenue, occupancy, and ADR is crucial for maximizing your Airbnb profit potential in Lofthouse.
Seasonal Strategies for Maximizing Profit
- Peak Season: Maximize revenue through premium pricing and potentially longer minimum stays. Ensure high availability.
- Low Season: Offer competitive pricing, special promotions (e.g., extended stay discounts), and flexible cancellation policies. Target off-season travelers like remote workers or budget-conscious guests.
- Shoulder Seasons: Implement dynamic pricing that balances peak and low rates. Target weekend travelers or specific events. Offer slightly more flexible terms than peak season.
- Regularly analyze your own performance against these Lofthouse seasonality benchmarks and adjust your pricing and availability strategy accordingly.
Best Areas for Airbnb Investment in Lofthouse (2025)
Exploring the top neighborhoods for short-term rentals in Lofthouse? This section highlights key areas, outlining why they are attractive for hosts and guests, along with notable local attractions. Consider these locations based on your target guest profile and investment strategy.
| Neighborhood / Area | Why Host Here? (Target Guests & Appeal) | Key Attractions & Landmarks |
|---|---|---|
| Lofthouse Village | Charming village atmosphere with access to rural landscapes. Attracts tourists looking for a peaceful getaway close to nature and the city. | Roundhay Park, Tropical World, Temple Newsam, Leeds City Centre, Rodley Nature Reserve |
| Leeds City Centre | Vibrant urban center with a mix of cultural, shopping, and dining experiences. Ideal for travelers looking for city life and the convenience of nearby amenities. | Royal Armouries Museum, Leeds Art Gallery, Trinity Leeds, Corn Exchange, Victoria Quarter |
| Roundhay | Residential area with expansive parks and recreational activities. Popular with families and those looking for outdoor activities close to the city. | Roundhay Park, Tropical World, The Mansion, Oakwood Park, Allerton Bywater |
| Kirkstall | Historical area with attractions focused on the Abbey and river walks. Great for those interested in history and nature walks. | Kirkstall Abbey, Kirkstall Bridge Shopping Park, Leeds Liverpool Canal, Abbey House Museum, Gledhow Valley Woods |
| Otley | Market town known for its scenic views and outdoor activities. Ideal for those seeking a rural retreat with local charm. | Otley Chevin Forest Park, Wharfedale, Otley Market, Tadcaster Bridge, The Otley Courthouse |
| Wetherby | Historic market town with a mix of shops and dining. Great for visitors looking for a quaint town experience within easy reach of larger cities. | Wetherby Racecourse, Wetherby Town Centre, River Wharfe, Deighton Lock, Scarcroft Golf Club |
| Horsforth | Suburban area with a vibrant community and plenty of green spaces. Attractive for families and those looking for a community feel. | Horsforth Hall Park, Golden Acre Park, Horsforth Golf Club, Horsforth Town Street, The Green |
| Pudsey | A mix of urban convenience and access to the countryside. Popular with families and those wanting a suburban lifestyle with city access. | Pudsey Park, Horsforth Woodside, Dale Park, Hollins Hill, The Ridges |
Understanding Airbnb License Requirements & STR Laws in Lofthouse (2025)
While Lofthouse, England, United Kingdom currently shows low STR regulations, specific Airbnb license requirements might still exist or change. Always verify the latest short term rental regulations and Airbnb license requirements directly with local government authorities for Lofthouse to ensure full compliance before hosting.
(Source: AirROI data, 2025, finding no licensed listings among those analyzed)
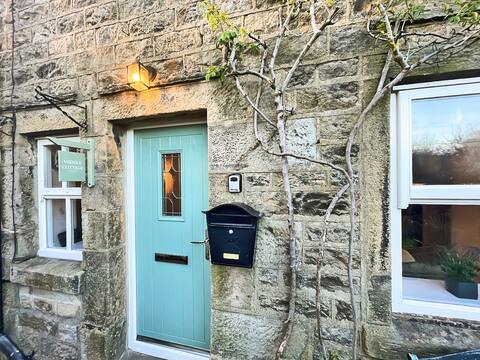
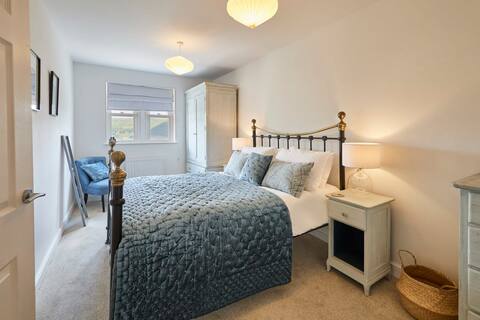
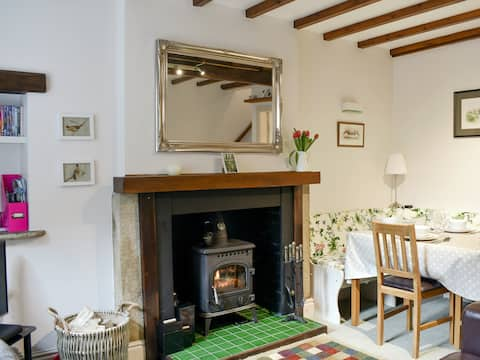
Top Performing Airbnb Properties in Lofthouse (2025)
Benchmark your potential! Explore examples of top-performing Airbnb properties in Lofthousebased on Trailing Twelve Month (TTM) revenue. Analyze their characteristics, revenue, occupancy rate, and ADR to understand what drives success in this market.

How Stean Cottage, a gorgeous home in Nidderdale
Entire Place • 6 bedrooms

Charming Nidderdale cottage with panoramic views
Entire Place • 3 bedrooms
Middle Cottage
Entire Place • 2 bedrooms
Host & Stay | Clackgill Cottage
Entire Place • 4 bedrooms
Rose Cottage
Entire Place • 2 bedrooms
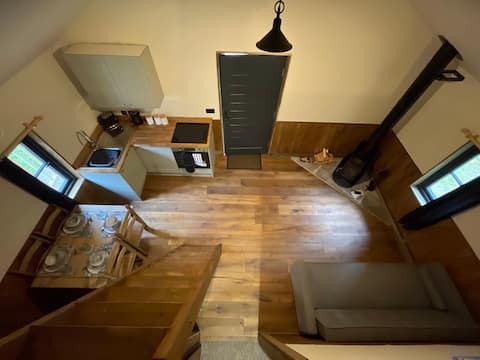
Hot Tub Chalet and Log Burner sleeps 6
Entire Place • 2 bedrooms
Note: Performance varies based on location, size, amenities, seasonality, and management quality. Data reflects the past 12 months.
Top Performing Airbnb Hosts in Lofthouse (2025)
Learn from the best! This table showcases top-performing Airbnb hosts in Lofthouse based on the number of properties managed and estimated total revenue over the past year. Analyze their scale and performance metrics.
| Host Name | Properties | Grossing Revenue | Stay Reviews | Avg Rating |
|---|---|---|---|---|
| Cottages | 3 | $96,161 | 40 | 3.25/5.0 |
| Joe | 1 | $85,753 | 134 | 4.90/5.0 |
| How Stean | 3 | $85,188 | 45 | 4.86/5.0 |
| Ashley | 2 | $62,742 | 761 | 5.00/5.0 |
| Dale | 3 | $61,632 | 71 | 4.74/5.0 |
| Helen | 1 | $47,697 | 253 | 4.93/5.0 |
| Hannah | 2 | $43,778 | 305 | 4.95/5.0 |
| Neil | 1 | $30,101 | 188 | 4.98/5.0 |
| Joanne | 1 | $25,799 | 68 | 4.84/5.0 |
| Mark & Kim | 1 | $23,195 | 64 | 4.95/5.0 |
Analyzing the strategies of top hosts, such as their property selection, pricing, and guest communication, can offer valuable lessons for optimizing your own Airbnb operations in Lofthouse.
Dive Deeper: Advanced Lofthouse STR Market Data (2025)
Ready to unlock more insights? AirROI provides access to advanced metrics and comprehensive Airbnb data for Lofthouse. Explore detailed analytics beyond this report to refine your investment strategy, optimize pricing, and maximize your vacation rental profits.
Explore Advanced MetricsLofthouse Short-Term Rental Market Composition (2025): Property & Room Types
Room Type Distribution
Property Type Distribution
Market Composition Insights for Lofthouse
- The Lofthouse Airbnb market composition is heavily skewed towards Entire Home/Apt listings, which make up 94.4% of the 18 active rentals. This indicates strong guest preference for privacy and space.
- Looking at the property type distribution in Lofthouse, House properties are the most common (66.7%), reflecting the local real estate landscape.
- Houses represent a significant 66.7% portion, catering likely to families or larger groups.
- The presence of 5.6% Hotel/Boutique listings indicates integration with traditional hospitality.
Lofthouse Airbnb Room Capacity Analysis (2025): Bedroom Distribution
Distribution of Listings by Number of Bedrooms
Room Capacity Insights for Lofthouse
- The dominant room capacity in Lofthouse is 1 bedroom listings, making up 33.3% of the market. This suggests a strong demand for properties suitable for couples or solo travelers.
- Together, 1 bedroom and 2 bedrooms properties represent 66.6% of the active Airbnb listings in Lofthouse, indicating a high concentration in these sizes.
- A significant 27.9% of listings offer 3+ bedrooms, catering to larger groups and families seeking more space in Lofthouse.
Lofthouse Vacation Rental Guest Capacity Trends (2025)
Distribution of Listings by Guest Capacity
Guest Capacity Insights for Lofthouse
- The most common guest capacity trend in Lofthouse vacation rentals is listings accommodating 4 guests (33.3%). This suggests the primary traveler segment is likely small families or groups.
- Properties designed for 4 guests and 6 guests dominate the Lofthouse STR market, accounting for 55.5% of listings.
- 38.9% of properties accommodate 6+ guests, serving the market segment for larger families or group travel in Lofthouse.
- On average, properties in Lofthouse are equipped to host 4.4 guests.
Lofthouse Airbnb Booking Patterns (2025): Available vs. Booked Days
Available Days Distribution
Booked Days Distribution
Booking Pattern Insights for Lofthouse
- The most common availability pattern in Lofthouse falls within the 91-180 days range, representing 38.9% of listings. This suggests many properties have significant open periods on their calendars.
- Approximately 50.0% of listings show high availability (181+ days open annually), indicating potential for increased bookings or specific owner usage patterns.
- For booked days, the 181-270 days range is most frequent in Lofthouse (38.9%), reflecting common guest stay durations or potential owner blocking patterns.
- A notable 50.0% of properties secure long booking periods (181+ days booked per year), highlighting successful long-term rental strategies or significant owner usage.
Lofthouse Airbnb Minimum Stay Requirements Analysis
Distribution of Listings by Minimum Night Requirement
1 Night
6 listings
33.3% of total
2 Nights
5 listings
27.8% of total
3 Nights
2 listings
11.1% of total
30+ Nights
5 listings
27.8% of total
Key Insights
- The most prevalent minimum stay requirement in Lofthouse is 1 Night, adopted by 33.3% of listings. This highlights the market's preference for shorter, flexible bookings.
- A strong majority (61.1%) of the Lofthouse Airbnb data shows acceptance of very short stays (1-2 nights), indicating a dynamic, high-turnover market.
- A significant segment (27.8%) caters to monthly stays (30+ nights) in Lofthouse, pointing to opportunities in the extended-stay market.
Recommendations
- Align with the market by considering a 1 Night minimum stay, as 33.3% of Lofthouse hosts use this setting.
- Explore offering discounts for stays of 30+ nights to attract the 27.8% of the market seeking extended stays.
- Adjust minimum nights based on seasonality – potentially shorter during low season and longer during peak demand periods in Lofthouse.
Lofthouse Airbnb Cancellation Policy Trends Analysis (2025)
Super Strict 30 Days
3 listings
17.6% of total
Super Strict 60 Days
2 listings
11.8% of total
Flexible
1 listings
5.9% of total
Moderate
3 listings
17.6% of total
Firm
6 listings
35.3% of total
Strict
2 listings
11.8% of total
Cancellation Policy Insights for Lofthouse
- The prevailing Airbnb cancellation policy trend in Lofthouse is Firm, used by 35.3% of listings.
- There's a relatively balanced mix between guest-friendly (23.5%) and stricter (47.1%) policies, offering choices for different guest needs.
Recommendations for Hosts
- Consider adopting a Firm policy to align with the 35.3% market standard in Lofthouse.
- Using a Strict policy might deter some guests, as only 11.8% of listings use it. Evaluate if potential revenue protection outweighs possible lower booking rates.
- Regularly review your cancellation policy against competitors and market demand shifts in Lofthouse.
Lofthouse STR Booking Lead Time Analysis (2025)
Average Booking Lead Time by Month
Booking Lead Time Insights for Lofthouse
- The overall average booking lead time for vacation rentals in Lofthouse is 53 days.
- Guests book furthest in advance for stays during May (average 95 days), likely coinciding with peak travel demand or local events.
- The shortest booking windows occur for stays in February (average 27 days), indicating more last-minute travel plans during this time.
- Seasonally, Summer (83 days avg.) sees the longest lead times, while Winter (39 days avg.) has the shortest, reflecting typical travel planning cycles.
Recommendations for Hosts
- Use the overall average lead time (53 days) as a baseline for your pricing and availability strategy in Lofthouse.
- For May stays, consider implementing length-of-stay discounts or slightly higher rates for bookings made less than 95 days out to capitalize on advance planning.
- Target marketing efforts for the Summer season well in advance (at least 83 days) to capture early planners.
- Monitor your own booking lead times against these Lofthouse averages to identify opportunities for dynamic pricing adjustments.
Popular & Essential Airbnb Amenities in Lofthouse (2025)
Amenity Prevalence
Amenity Insights for Lofthouse
- Essential amenities in Lofthouse that guests expect include: Smoke alarm, Heating. Lacking these (any) could significantly impact bookings.
- Popular amenities like Wifi, Backyard, Bed linens are common but not universal. Offering these can provide a competitive edge.
- Warning: Wifi is not universally provided but is considered essential globally. Ensure reliable Wifi is offered.
Recommendations for Hosts
- Ensure your listing includes all essential amenities for Lofthouse: Smoke alarm, Heating.
- Consider adding popular differentiators like Wifi or Backyard to increase appeal.
- Highlight unique or less common amenities you offer (e.g., hot tub, dedicated workspace, EV charger) in your listing description and photos.
- Regularly check competitor amenities in Lofthouse to stay competitive.
Lofthouse Airbnb Guest Demographics & Profile Analysis (2025)
Guest Profile Summary for Lofthouse
- The typical guest profile for Airbnb in Lofthouse consists of primarily domestic travelers (89%), often arriving from nearby England, typically belonging to the Post-2000s (Gen Z/Alpha) group (50%), primarily speaking English or French.
- Domestic travelers account for 89.2% of guests.
- Key international markets include United Kingdom (89.2%) and United States (4.9%).
- Top languages spoken are English (74.2%) followed by French (6.3%).
- A significant demographic segment is the Post-2000s (Gen Z/Alpha) group, representing 50% of guests.
Recommendations for Hosts
- Target domestic marketing efforts towards travelers from England and Leeds.
- Tailor amenities and listing descriptions to appeal to the dominant Post-2000s (Gen Z/Alpha) demographic (e.g., highlight fast WiFi, smart home features, local guides).
- Highlight unique local experiences or amenities relevant to the primary guest profile.
- Consider seasonal promotions aligned with peak travel times for key origin markets.
Nearby Short-Term Rental Market Comparison
How does the Lofthouse Airbnb market stack up against its neighbors? Compare key performance metrics like average monthly revenue, ADR, and occupancy rates in surrounding areas to understand the broader regional STR landscape.
| Market | Active Properties | Monthly Revenue | Daily Rate | Avg. Occupancy |
|---|---|---|---|---|
| Grinton | 14 | $5,456 | $365.05 | 51% |
| Cartmel Fell | 17 | $4,719 | $331.68 | 52% |
| Stamford Bridge | 11 | $4,669 | $410.14 | 38% |
| Casterton | 11 | $4,578 | $300.82 | 51% |
| Appleby | 10 | $4,577 | $332.39 | 44% |
| Cark | 11 | $4,540 | $885.21 | 31% |
| Hayton | 13 | $4,333 | $239.53 | 60% |
| Watermillock | 16 | $4,281 | $274.03 | 50% |
| Kielder | 12 | $4,215 | $329.21 | 53% |
| Pooley Bridge | 13 | $4,145 | $317.26 | 52% |