Llangarron Airbnb Market Analysis 2025: Short Term Rental Data & Vacation Rental Statistics in England, United Kingdom
Is Airbnb profitable in Llangarron in 2025? Explore comprehensive Airbnb analytics for Llangarron, England, United Kingdom to uncover income potential. This 2025 STR market report for Llangarron, based on AirROI data from April 2024 to March 2025, reveals key trends in the niche market of 17 active listings.
Whether you're considering an Airbnb investment in Llangarron, optimizing your existing vacation rental, or exploring rental arbitrage opportunities, understanding the Llangarron Airbnb data is crucial. Leveraging the low regulation environment is key to maximizing your short term rental income potential. Let's dive into the specifics.
Key Llangarron Airbnb Performance Metrics Overview
Monthly Airbnb Revenue Variations & Income Potential in Llangarron (2025)
Understanding the monthly revenue variations for Airbnb listings in Llangarron is key to maximizing your short term rental income potential. Seasonality significantly impacts earnings. Our analysis, based on data from the past 12 months, shows that the peak revenue month for STRs in Llangarron is typically August, while January often presents the lowest earnings, highlighting opportunities for strategic pricing adjustments during shoulder and low seasons. Explore the typical Airbnb income in Llangarron across different performance tiers:
- Best-in-class properties (Top 10%) achieve $4,264+ monthly, often utilizing dynamic pricing and superior guest experiences.
- Strong performing properties (Top 25%) earn $2,378 or more, indicating effective management and desirable locations/amenities.
- Typical properties (Median) generate around $1,297 per month, representing the average market performance.
- Entry-level properties (Bottom 25%) see earnings around $691, often with potential for optimization.
Average Monthly Airbnb Earnings Trend in Llangarron
Llangarron Airbnb Occupancy Rate Trends (2025)
Maximize your bookings by understanding the Llangarron STR occupancy trends. Seasonal demand shifts significantly influence how often properties are booked. Typically, Augustsees the highest demand (peak season occupancy), while January experiences the lowest (low season). Effective strategies, like adjusting minimum stays or offering promotions, can boost occupancy during slower periods. Here's how different property tiers perform in Llangarron:
- Best-in-class properties (Top 10%) achieve 70%+ occupancy, indicating high desirability and potentially optimized availability.
- Strong performing properties (Top 25%) maintain 50% or higher occupancy, suggesting good market fit and guest satisfaction.
- Typical properties (Median) have an occupancy rate around 26%.
- Entry-level properties (Bottom 25%) average 13% occupancy, potentially facing higher vacancy.
Average Monthly Occupancy Rate Trend in Llangarron
Average Daily Rate (ADR) Airbnb Trends in Llangarron (2025)
Effective short term rental pricing strategy in Llangarron involves understanding monthly ADR fluctuations. The Average Daily Rate (ADR) for Airbnb in Llangarron typically peaks in July and dips lowest during March. Leveraging Airbnb dynamic pricing tools or strategies based on this seasonality can significantly boost revenue. Here's a look at the typical nightly rates achieved:
- Best-in-class properties (Top 10%) command rates of $607+ per night, often due to premium features or locations.
- Strong performing properties (Top 25%) achieve nightly rates of $261 or more.
- Typical properties (Median) charge around $154 per night.
- Entry-level properties (Bottom 25%) earn around $111 per night.
Average Daily Rate (ADR) Trend by Month in Llangarron
Get Live Llangarron Market Intelligence 👇

Explore Real-time Analytics
Airbnb Seasonality Analysis & Trends in Llangarron (2025)
Peak Season (August, July, November)
- Revenue averages $2,577 per month
- Occupancy rates average 42.7%
- Daily rates average $249
Shoulder Season
- Revenue averages $1,838 per month
- Occupancy maintains around 33.4%
- Daily rates hold near $256
Low Season (January, February, March)
- Revenue drops to average $886 per month
- Occupancy decreases to average 24.3%
- Daily rates adjust to average $190
Seasonality Insights for Llangarron
- The Airbnb seasonality in Llangarron shows highly seasonal trends requiring careful strategy. While the sections above show seasonal averages, it's also insightful to look at the extremes:
- During the high season, the absolute peak month showcases Llangarron's highest earning potential, with monthly revenues capable of climbing to $2,855, occupancy reaching a high of 51.4%, and ADRs peaking at $275.
- Conversely, the slowest single month of the year, typically falling within the low season, marks the market's lowest point. In this month, revenue might dip to $554, occupancy could drop to 14.4%, and ADRs may adjust down to $187.
- Understanding both the seasonal averages and these monthly peaks and troughs in revenue, occupancy, and ADR is crucial for maximizing your Airbnb profit potential in Llangarron.
Seasonal Strategies for Maximizing Profit
- Peak Season: Maximize revenue through premium pricing and potentially longer minimum stays. Ensure high availability.
- Low Season: Offer competitive pricing, special promotions (e.g., extended stay discounts), and flexible cancellation policies. Target off-season travelers like remote workers or budget-conscious guests.
- Shoulder Seasons: Implement dynamic pricing that balances peak and low rates. Target weekend travelers or specific events. Offer slightly more flexible terms than peak season.
- Regularly analyze your own performance against these Llangarron seasonality benchmarks and adjust your pricing and availability strategy accordingly.
Best Areas for Airbnb Investment in Llangarron (2025)
Exploring the top neighborhoods for short-term rentals in Llangarron? This section highlights key areas, outlining why they are attractive for hosts and guests, along with notable local attractions. Consider these locations based on your target guest profile and investment strategy.
| Neighborhood / Area | Why Host Here? (Target Guests & Appeal) | Key Attractions & Landmarks |
|---|---|---|
| Monmouth | Historic market town near Llangarron, known for its beautiful medieval architecture and charming riverside. A popular base for tourists exploring the Wye Valley and the Brecon Beacons. | Monmouth Castle, The Shire Hall, Monnow Bridge, Wye Valley Walk, Gypsy Hill Trail |
| Ross-on-Wye | Scenic market town located along the River Wye, known for its stunning views and outdoor activities. A favorite destination for visitors seeking nature and adventure. | Ross-on-Wye Photographic Gallery, The River Wye, Wilton Castle, The Herefordshire Trail, Ross Market |
| Symonds Yat | Famous for breathtaking river views and outdoor activities like hiking and canoeing. Ideal for nature lovers and those seeking tranquility in the countryside. | Symonds Yat Rock, River Wye Canoeing, Wye Valley Forest, Nature trails, Bird watching |
| Hereford | Larger city nearby known for its historic cathedral and cider production. Offers a mix of urban amenities and countryside charm, appealing to diverse travelers. | Hereford Cathedral, Cider Museum, The Old Market, Rotherwas Chapel, Hereford Map Shop |
| Brockweir | Picturesque village known for its stunning views and proximity to the Wye Valley Area of Outstanding Natural Beauty. Perfect for those looking for a rural retreat. | Brockweir Bridge, Wye Valley Trails, Local shops and cafes, Art galleries, Nature walks |
| Grosmont | Small village with a rich history and stunning scenery, popular with walkers and cyclists. Ideal for those wanting a peaceful getaway. | Grosmont Castle, Village walks, Black Mountains, Old railway, Local pubs and cafes |
| Chepstow | Medieval town at the edge of the Wye Valley, famous for its castle and close to the border with Wales. Attracts history enthusiasts and nature lovers. | Chepstow Castle, Lower Wye Valley, Chepstow Racecourse, The Wye Path, Historic town center |
| Abergavenny | Market town known for its food scene and surrounded by picturesque hills. A vibrant cultural hub with many festivals and events throughout the year. | Abergavenny Castle, Abergavenny Market, Sugar Loaf Mountain, Local food shops and restaurants, Brecon Beacons nearby |
Understanding Airbnb License Requirements & STR Laws in Llangarron (2025)
While Llangarron, England, United Kingdom currently shows low STR regulations, specific Airbnb license requirements might still exist or change. Always verify the latest short term rental regulations and Airbnb license requirements directly with local government authorities for Llangarron to ensure full compliance before hosting.
(Source: AirROI data, 2025, finding no licensed listings among those analyzed)
Top Performing Airbnb Properties in Llangarron (2025)
Benchmark your potential! Explore examples of top-performing Airbnb properties in Llangarronbased on Trailing Twelve Month (TTM) revenue. Analyze their characteristics, revenue, occupancy rate, and ADR to understand what drives success in this market.
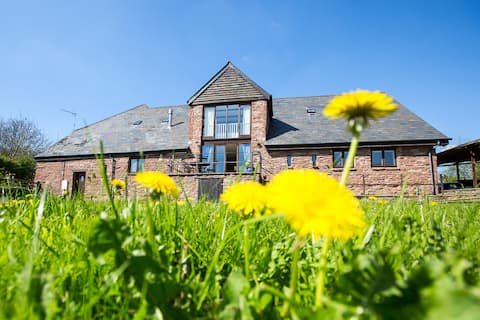
South Wing of the Great Barn at Trebandy Farm
Entire Place • 4 bedrooms
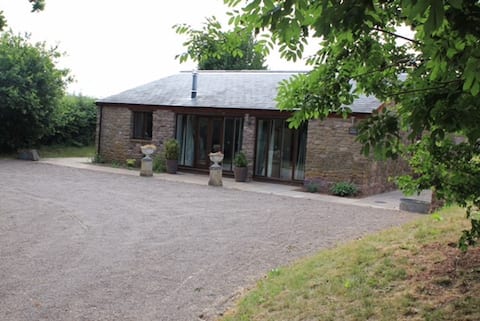
The Field Barn at Trebandy Farm
Entire Place • 3 bedrooms

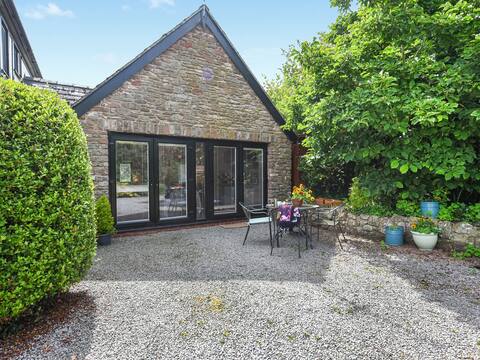
Picturesque Spacious and Cosy Barn Conversion
Entire Place • 2 bedrooms

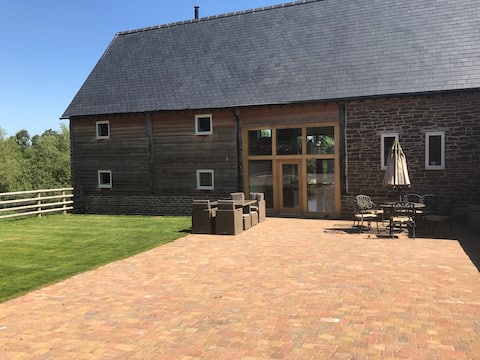
Treetop view towards the Wye Valley
Entire Place • 1 bedroom
Trecilla House
Entire Place • 1 bedroom
The Old Barn
Entire Place • 4 bedrooms
Note: Performance varies based on location, size, amenities, seasonality, and management quality. Data reflects the past 12 months.
Top Performing Airbnb Hosts in Llangarron (2025)
Learn from the best! This table showcases top-performing Airbnb hosts in Llangarron based on the number of properties managed and estimated total revenue over the past year. Analyze their scale and performance metrics.
| Host Name | Properties | Grossing Revenue | Stay Reviews | Avg Rating |
|---|---|---|---|---|
| Susan | 1 | $39,886 | 57 | 4.98/5.0 |
| Paola | 1 | $35,833 | 59 | 4.69/5.0 |
| Ophelia | 1 | $34,693 | 250 | 4.85/5.0 |
| Thomas | 3 | $18,543 | 140 | 4.97/5.0 |
| Catherine | 1 | $18,520 | 86 | 5.00/5.0 |
| Clare | 2 | $18,389 | 36 | 4.96/5.0 |
| Host #222199733 | 1 | $15,044 | 0 | 0.00/5.0 |
| Ingrid | 1 | $14,220 | 90 | 4.93/5.0 |
| Mark | 2 | $9,460 | 212 | 4.79/5.0 |
| Robin | 1 | $8,816 | 88 | 4.92/5.0 |
Analyzing the strategies of top hosts, such as their property selection, pricing, and guest communication, can offer valuable lessons for optimizing your own Airbnb operations in Llangarron.
Dive Deeper: Advanced Llangarron STR Market Data (2025)
Ready to unlock more insights? AirROI provides access to advanced metrics and comprehensive Airbnb data for Llangarron. Explore detailed analytics beyond this report to refine your investment strategy, optimize pricing, and maximize your vacation rental profits.
Explore Advanced MetricsLlangarron Short-Term Rental Market Composition (2025): Property & Room Types
Room Type Distribution
Property Type Distribution
Market Composition Insights for Llangarron
- The Llangarron Airbnb market composition is heavily skewed towards Entire Home/Apt listings, which make up 100% of the 17 active rentals. This indicates strong guest preference for privacy and space.
- Looking at the property type distribution in Llangarron, House properties are the most common (58.8%), reflecting the local real estate landscape.
- Houses represent a significant 58.8% portion, catering likely to families or larger groups.
Llangarron Airbnb Room Capacity Analysis (2025): Bedroom Distribution
Distribution of Listings by Number of Bedrooms
Room Capacity Insights for Llangarron
- The dominant room capacity in Llangarron is 1 bedroom listings, making up 52.9% of the market. This suggests a strong demand for properties suitable for couples or solo travelers.
- Together, 1 bedroom and 2 bedrooms properties represent 76.4% of the active Airbnb listings in Llangarron, indicating a high concentration in these sizes.
- With over half the market (52.9%) consisting of studios or 1-bedroom units, Llangarron is particularly well-suited for individuals or couples.
- A significant 23.6% of listings offer 3+ bedrooms, catering to larger groups and families seeking more space in Llangarron.
Llangarron Vacation Rental Guest Capacity Trends (2025)
Distribution of Listings by Guest Capacity
Guest Capacity Insights for Llangarron
- The most common guest capacity trend in Llangarron vacation rentals is listings accommodating 2 guests (47.1%). This suggests the primary traveler segment is likely couples or solo travelers.
- Properties designed for 2 guests and 4 guests dominate the Llangarron STR market, accounting for 70.6% of listings.
- A significant 47.1% of listings cater specifically to 1-2 guests, highlighting strong demand from couples and solo travelers in Llangarron.
- 23.6% of properties accommodate 6+ guests, serving the market segment for larger families or group travel in Llangarron.
- On average, properties in Llangarron are equipped to host 3.8 guests.
Llangarron Airbnb Booking Patterns (2025): Available vs. Booked Days
Available Days Distribution
Booked Days Distribution
Booking Pattern Insights for Llangarron
- The most common availability pattern in Llangarron falls within the 271-366 days range, representing 58.8% of listings. This suggests many properties have significant open periods on their calendars.
- Approximately 94.1% of listings show high availability (181+ days open annually), indicating potential for increased bookings or specific owner usage patterns.
- For booked days, the 91-180 days range is most frequent in Llangarron (41.2%), reflecting common guest stay durations or potential owner blocking patterns.
- A notable 5.9% of properties secure long booking periods (181+ days booked per year), highlighting successful long-term rental strategies or significant owner usage.
Llangarron Airbnb Minimum Stay Requirements Analysis
Distribution of Listings by Minimum Night Requirement
1 Night
2 listings
11.8% of total
2 Nights
7 listings
41.2% of total
3 Nights
6 listings
35.3% of total
30+ Nights
2 listings
11.8% of total
Key Insights
- The most prevalent minimum stay requirement in Llangarron is 2 Nights, adopted by 41.2% of listings. This highlights the market's preference for shorter, flexible bookings.
- A significant segment (11.8%) caters to monthly stays (30+ nights) in Llangarron, pointing to opportunities in the extended-stay market.
Recommendations
- Align with the market by considering a 2 Nights minimum stay, as 41.2% of Llangarron hosts use this setting.
- If feasible, allowing 1-night stays, especially midweek or during low season, could capture last-minute bookings, as only 11.8% currently do.
- A 2-night minimum appears standard (41.2%). Consider this for weekends or peak periods.
- Explore offering discounts for stays of 30+ nights to attract the 11.8% of the market seeking extended stays.
- Adjust minimum nights based on seasonality – potentially shorter during low season and longer during peak demand periods in Llangarron.
Llangarron Airbnb Cancellation Policy Trends Analysis (2025)
Flexible
8 listings
50% of total
Moderate
1 listings
6.3% of total
Firm
3 listings
18.8% of total
Strict
4 listings
25% of total
Cancellation Policy Insights for Llangarron
- The prevailing Airbnb cancellation policy trend in Llangarron is Flexible, used by 50% of listings.
- There's a relatively balanced mix between guest-friendly (56.3%) and stricter (43.8%) policies, offering choices for different guest needs.
Recommendations for Hosts
- Consider adopting a Flexible policy to align with the 50% market standard in Llangarron.
- Regularly review your cancellation policy against competitors and market demand shifts in Llangarron.
Llangarron STR Booking Lead Time Analysis (2025)
Average Booking Lead Time by Month
Booking Lead Time Insights for Llangarron
- The overall average booking lead time for vacation rentals in Llangarron is 37 days.
- Guests book furthest in advance for stays during December (average 63 days), likely coinciding with peak travel demand or local events.
- The shortest booking windows occur for stays in March (average 16 days), indicating more last-minute travel plans during this time.
- Seasonally, Winter (45 days avg.) sees the longest lead times, while Spring (23 days avg.) has the shortest, reflecting typical travel planning cycles.
Recommendations for Hosts
- Use the overall average lead time (37 days) as a baseline for your pricing and availability strategy in Llangarron.
- For December stays, consider implementing length-of-stay discounts or slightly higher rates for bookings made less than 63 days out to capitalize on advance planning.
- Target marketing efforts for the Winter season well in advance (at least 45 days) to capture early planners.
- Monitor your own booking lead times against these Llangarron averages to identify opportunities for dynamic pricing adjustments.
Popular & Essential Airbnb Amenities in Llangarron (2025)
Amenity Prevalence
Amenity Insights for Llangarron
- Essential amenities in Llangarron that guests expect include: Free parking on premises, Essentials, Heating, Kitchen, Smoke alarm. Lacking these (any) could significantly impact bookings.
- Popular amenities like Dishes and silverware, Private entrance, Hangers are common but not universal. Offering these can provide a competitive edge.
Recommendations for Hosts
- Ensure your listing includes all essential amenities for Llangarron: Free parking on premises, Essentials, Heating, Kitchen, Smoke alarm.
- Consider adding popular differentiators like Dishes and silverware or Private entrance to increase appeal.
- Highlight unique or less common amenities you offer (e.g., hot tub, dedicated workspace, EV charger) in your listing description and photos.
- Regularly check competitor amenities in Llangarron to stay competitive.
Llangarron Airbnb Guest Demographics & Profile Analysis (2025)
Guest Profile Summary for Llangarron
- The typical guest profile for Airbnb in Llangarron consists of primarily domestic travelers (95%), often arriving from nearby England, typically belonging to the Post-2000s (Gen Z/Alpha) group (50%), primarily speaking English or French.
- Domestic travelers account for 94.8% of guests.
- Key international markets include United Kingdom (94.8%) and France (2.6%).
- Top languages spoken are English (75.6%) followed by French (6.7%).
- A significant demographic segment is the Post-2000s (Gen Z/Alpha) group, representing 50% of guests.
Recommendations for Hosts
- Target domestic marketing efforts towards travelers from England and London.
- Tailor amenities and listing descriptions to appeal to the dominant Post-2000s (Gen Z/Alpha) demographic (e.g., highlight fast WiFi, smart home features, local guides).
- Highlight unique local experiences or amenities relevant to the primary guest profile.
- Consider seasonal promotions aligned with peak travel times for key origin markets.
Nearby Short-Term Rental Market Comparison
How does the Llangarron Airbnb market stack up against its neighbors? Compare key performance metrics like average monthly revenue, ADR, and occupancy rates in surrounding areas to understand the broader regional STR landscape.
| Market | Active Properties | Monthly Revenue | Daily Rate | Avg. Occupancy |
|---|---|---|---|---|
| Englishcombe | 13 | $8,558 | $573.69 | 49% |
| Chew Magna | 14 | $6,649 | $399.59 | 46% |
| Lambourn | 11 | $6,081 | $669.47 | 28% |
| Long Sutton | 17 | $5,726 | $383.88 | 46% |
| Stoke St. Michael | 10 | $5,277 | $424.04 | 42% |
| Winsham | 10 | $5,154 | $484.22 | 52% |
| Oldland Common | 13 | $5,093 | $355.47 | 43% |
| Crai | 20 | $4,799 | $371.85 | 46% |
| Dinton | 11 | $4,637 | $242.16 | 58% |
| Limpley Stoke | 10 | $4,598 | $523.47 | 52% |