Landford Airbnb Market Analysis 2025: Short Term Rental Data & Vacation Rental Statistics in England, United Kingdom
Is Airbnb profitable in Landford in 2025? Explore comprehensive Airbnb analytics for Landford, England, United Kingdom to uncover income potential. This 2025 STR market report for Landford, based on AirROI data from April 2024 to March 2025, reveals key trends in the niche market of 17 active listings.
Whether you're considering an Airbnb investment in Landford, optimizing your existing vacation rental, or exploring rental arbitrage opportunities, understanding the Landford Airbnb data is crucial. Leveraging the low regulation environment is key to maximizing your short term rental income potential. Let's dive into the specifics.
Key Landford Airbnb Performance Metrics Overview
Monthly Airbnb Revenue Variations & Income Potential in Landford (2025)
Understanding the monthly revenue variations for Airbnb listings in Landford is key to maximizing your short term rental income potential. Seasonality significantly impacts earnings. Our analysis, based on data from the past 12 months, shows that the peak revenue month for STRs in Landford is typically August, while January often presents the lowest earnings, highlighting opportunities for strategic pricing adjustments during shoulder and low seasons. Explore the typical Airbnb income in Landford across different performance tiers:
- Best-in-class properties (Top 10%) achieve $4,526+ monthly, often utilizing dynamic pricing and superior guest experiences.
- Strong performing properties (Top 25%) earn $3,060 or more, indicating effective management and desirable locations/amenities.
- Typical properties (Median) generate around $1,969 per month, representing the average market performance.
- Entry-level properties (Bottom 25%) see earnings around $1,126, often with potential for optimization.
Average Monthly Airbnb Earnings Trend in Landford
Landford Airbnb Occupancy Rate Trends (2025)
Maximize your bookings by understanding the Landford STR occupancy trends. Seasonal demand shifts significantly influence how often properties are booked. Typically, Augustsees the highest demand (peak season occupancy), while January experiences the lowest (low season). Effective strategies, like adjusting minimum stays or offering promotions, can boost occupancy during slower periods. Here's how different property tiers perform in Landford:
- Best-in-class properties (Top 10%) achieve 68%+ occupancy, indicating high desirability and potentially optimized availability.
- Strong performing properties (Top 25%) maintain 57% or higher occupancy, suggesting good market fit and guest satisfaction.
- Typical properties (Median) have an occupancy rate around 43%.
- Entry-level properties (Bottom 25%) average 22% occupancy, potentially facing higher vacancy.
Average Monthly Occupancy Rate Trend in Landford
Average Daily Rate (ADR) Airbnb Trends in Landford (2025)
Effective short term rental pricing strategy in Landford involves understanding monthly ADR fluctuations. The Average Daily Rate (ADR) for Airbnb in Landford typically peaks in July and dips lowest during February. Leveraging Airbnb dynamic pricing tools or strategies based on this seasonality can significantly boost revenue. Here's a look at the typical nightly rates achieved:
- Best-in-class properties (Top 10%) command rates of $326+ per night, often due to premium features or locations.
- Strong performing properties (Top 25%) achieve nightly rates of $224 or more.
- Typical properties (Median) charge around $162 per night.
- Entry-level properties (Bottom 25%) earn around $121 per night.
Average Daily Rate (ADR) Trend by Month in Landford
Get Live Landford Market Intelligence 👇
Explore Real-time Analytics
Airbnb Seasonality Analysis & Trends in Landford (2025)
Peak Season (August, July, June)
- Revenue averages $3,468 per month
- Occupancy rates average 54.6%
- Daily rates average $202
Shoulder Season
- Revenue averages $2,186 per month
- Occupancy maintains around 41.1%
- Daily rates hold near $192
Low Season (January, February, March)
- Revenue drops to average $1,353 per month
- Occupancy decreases to average 28.6%
- Daily rates adjust to average $180
Seasonality Insights for Landford
- The Airbnb seasonality in Landford shows highly seasonal trends requiring careful strategy. While the sections above show seasonal averages, it's also insightful to look at the extremes:
- During the high season, the absolute peak month showcases Landford's highest earning potential, with monthly revenues capable of climbing to $4,447, occupancy reaching a high of 70.1%, and ADRs peaking at $205.
- Conversely, the slowest single month of the year, typically falling within the low season, marks the market's lowest point. In this month, revenue might dip to $1,211, occupancy could drop to 23.9%, and ADRs may adjust down to $177.
- Understanding both the seasonal averages and these monthly peaks and troughs in revenue, occupancy, and ADR is crucial for maximizing your Airbnb profit potential in Landford.
Seasonal Strategies for Maximizing Profit
- Peak Season: Maximize revenue through premium pricing and potentially longer minimum stays. Ensure high availability.
- Low Season: Offer competitive pricing, special promotions (e.g., extended stay discounts), and flexible cancellation policies. Target off-season travelers like remote workers or budget-conscious guests.
- Shoulder Seasons: Implement dynamic pricing that balances peak and low rates. Target weekend travelers or specific events. Offer slightly more flexible terms than peak season.
- Regularly analyze your own performance against these Landford seasonality benchmarks and adjust your pricing and availability strategy accordingly.
Best Areas for Airbnb Investment in Landford (2025)
Exploring the top neighborhoods for short-term rentals in Landford? This section highlights key areas, outlining why they are attractive for hosts and guests, along with notable local attractions. Consider these locations based on your target guest profile and investment strategy.
| Neighborhood / Area | Why Host Here? (Target Guests & Appeal) | Key Attractions & Landmarks |
|---|---|---|
| Landford Village | Charming village atmosphere with easy access to the New Forest National Park. Attracts families and nature lovers seeking a peaceful getaway. | New Forest National Park, Ringwood Forest, Landford Mill, Breamore House and Museum, Fordingbridge, The New Forest Cider |
| Fyfield End | A quiet area close to the village center, perfect for visitors looking for tranquility while being near local amenities. | Local shops, Parks and green spaces, Mere Golf Club, The Red Lion Pub, Landford Village Green |
| Landford Common | Surrounded by beautiful countryside, ideal for guests wanting to explore outdoor activities and nature trails. | Nature trails, Countryside walks, Cycle routes, Horse riding opportunities, Local wildlife sightings |
| Salisbury Road | Main road connecting to nearby towns and attractions, great for guests wanting to explore the wider region including Salisbury and the New Forest. | Quick access to Salisbury, Nearby shops, Local restaurants, Close to transport links |
| New Forest Visitor Centre | A popular starting point for travelers wanting to explore the New Forest, perfect for adventure seekers and nature enthusiasts. | Visitor center exhibits, Guided walks, Bike rentals, Wild ponies, Nature trails |
| Whaddon | A peaceful residential area offering a true taste of village life, appealing to long-stay guests and families. | Local parks, Community events, Village shops, Access to walking trails |
| The Glade | New development area with modern amenities, attracting visitors looking for comfort and convenience near countryside activities. | Modern accommodations, Close to shopping, Parks and recreation, Family-friendly attractions |
| Hatch Green | Rural setting with proximity to both the countryside and urban amenities, appealing to diverse visitors. | Farm shops, Rural walks, Horse trails, Local dining options |
Understanding Airbnb License Requirements & STR Laws in Landford (2025)
While Landford, England, United Kingdom currently shows low STR regulations, specific Airbnb license requirements might still exist or change. Always verify the latest short term rental regulations and Airbnb license requirements directly with local government authorities for Landford to ensure full compliance before hosting.
(Source: AirROI data, 2025, finding no licensed listings among those analyzed)
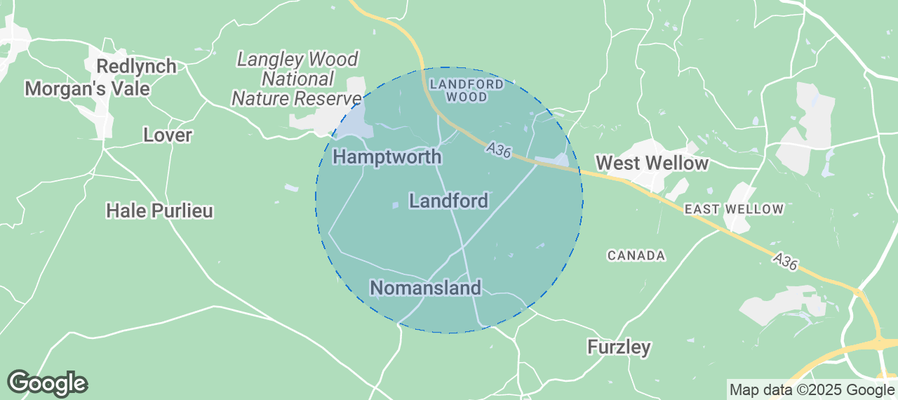
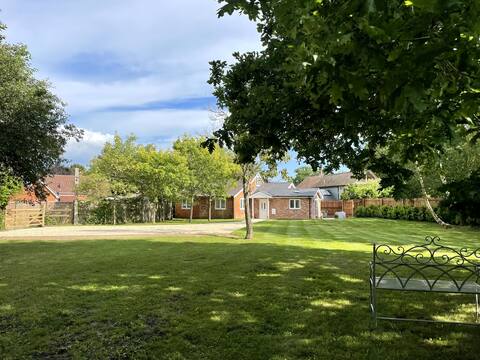
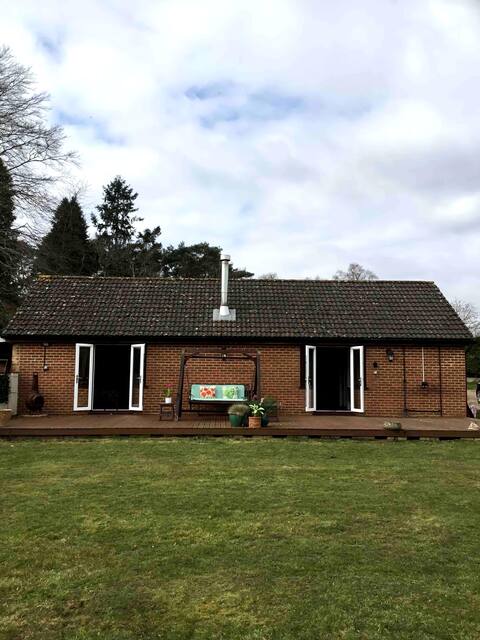
Top Performing Airbnb Properties in Landford (2025)
Benchmark your potential! Explore examples of top-performing Airbnb properties in Landfordbased on Trailing Twelve Month (TTM) revenue. Analyze their characteristics, revenue, occupancy rate, and ADR to understand what drives success in this market.
The Cowshed near Peppa Pig and New Forest
Entire Place • 4 bedrooms

Cosy cottage in New Forest village.
Entire Place • 1 bedroom
New Forest - Large studio annex with hot tub
Entire Place • 1 bedroom

Luxurious New Forest Holiday Lodge Free Pets
Entire Place • 2 bedrooms

Lodge Fantastic base to explore the New Forest
Entire Place • 2 bedrooms
Character barn with modern and traditional feel
Entire Place • 1 bedroom
Note: Performance varies based on location, size, amenities, seasonality, and management quality. Data reflects the past 12 months.
Top Performing Airbnb Hosts in Landford (2025)
Learn from the best! This table showcases top-performing Airbnb hosts in Landford based on the number of properties managed and estimated total revenue over the past year. Analyze their scale and performance metrics.
| Host Name | Properties | Grossing Revenue | Stay Reviews | Avg Rating |
|---|---|---|---|---|
| Jennie | 1 | $54,526 | 85 | 4.91/5.0 |
| Nicola | 1 | $47,465 | 44 | 5.00/5.0 |
| Liz | 2 | $47,061 | 398 | 4.94/5.0 |
| Lesley | 1 | $38,841 | 166 | 4.99/5.0 |
| Emma | 1 | $35,012 | 82 | 4.96/5.0 |
| Host #427476414 | 2 | $34,896 | 0 | 0.00/5.0 |
| Donna | 1 | $28,910 | 66 | 4.98/5.0 |
| Sharon | 2 | $24,420 | 159 | 4.92/5.0 |
| Alan | 1 | $22,660 | 108 | 4.98/5.0 |
| Hannah | 1 | $21,343 | 34 | 4.79/5.0 |
Analyzing the strategies of top hosts, such as their property selection, pricing, and guest communication, can offer valuable lessons for optimizing your own Airbnb operations in Landford.
Dive Deeper: Advanced Landford STR Market Data (2025)
Ready to unlock more insights? AirROI provides access to advanced metrics and comprehensive Airbnb data for Landford. Explore detailed analytics beyond this report to refine your investment strategy, optimize pricing, and maximize your vacation rental profits.
Explore Advanced MetricsLandford Short-Term Rental Market Composition (2025): Property & Room Types
Room Type Distribution
Property Type Distribution
Market Composition Insights for Landford
- The Landford Airbnb market composition is heavily skewed towards Entire Home/Apt listings, which make up 94.1% of the 17 active rentals. This indicates strong guest preference for privacy and space.
- Looking at the property type distribution in Landford, House properties are the most common (58.8%), reflecting the local real estate landscape.
- Houses represent a significant 58.8% portion, catering likely to families or larger groups.
Landford Airbnb Room Capacity Analysis (2025): Bedroom Distribution
Distribution of Listings by Number of Bedrooms
Room Capacity Insights for Landford
- The dominant room capacity in Landford is 1 bedroom listings, making up 41.2% of the market. This suggests a strong demand for properties suitable for couples or solo travelers.
- Together, 1 bedroom and 2 bedrooms properties represent 70.6% of the active Airbnb listings in Landford, indicating a high concentration in these sizes.
- A significant 23.5% of listings offer 3+ bedrooms, catering to larger groups and families seeking more space in Landford.
Landford Vacation Rental Guest Capacity Trends (2025)
Distribution of Listings by Guest Capacity
Guest Capacity Insights for Landford
- The most common guest capacity trend in Landford vacation rentals is listings accommodating 2 guests (29.4%). This suggests the primary traveler segment is likely couples or solo travelers.
- Properties designed for 2 guests and 4 guests dominate the Landford STR market, accounting for 52.9% of listings.
- 29.4% of properties accommodate 6+ guests, serving the market segment for larger families or group travel in Landford.
- On average, properties in Landford are equipped to host 4.0 guests.
Landford Airbnb Booking Patterns (2025): Available vs. Booked Days
Available Days Distribution
Booked Days Distribution
Booking Pattern Insights for Landford
- The most common availability pattern in Landford falls within the 181-270 days range, representing 41.2% of listings. This suggests many properties have significant open periods on their calendars.
- Approximately 70.6% of listings show high availability (181+ days open annually), indicating potential for increased bookings or specific owner usage patterns.
- For booked days, the 91-180 days range is most frequent in Landford (35.3%), reflecting common guest stay durations or potential owner blocking patterns.
- A notable 35.3% of properties secure long booking periods (181+ days booked per year), highlighting successful long-term rental strategies or significant owner usage.
Landford Airbnb Minimum Stay Requirements Analysis
Distribution of Listings by Minimum Night Requirement
1 Night
2 listings
13.3% of total
2 Nights
6 listings
40% of total
3 Nights
5 listings
33.3% of total
4-6 Nights
1 listings
6.7% of total
30+ Nights
1 listings
6.7% of total
Key Insights
- The most prevalent minimum stay requirement in Landford is 2 Nights, adopted by 40% of listings. This highlights the market's preference for shorter, flexible bookings.
Recommendations
- Align with the market by considering a 2 Nights minimum stay, as 40% of Landford hosts use this setting.
- If feasible, allowing 1-night stays, especially midweek or during low season, could capture last-minute bookings, as only 13.3% currently do.
- A 2-night minimum appears standard (40%). Consider this for weekends or peak periods.
- Explore offering discounts for stays of 30+ nights to attract the 6.7% of the market seeking extended stays.
- Adjust minimum nights based on seasonality – potentially shorter during low season and longer during peak demand periods in Landford.
Landford Airbnb Cancellation Policy Trends Analysis (2025)
Super Strict 60 Days
1 listings
6.7% of total
Flexible
4 listings
26.7% of total
Moderate
7 listings
46.7% of total
Firm
1 listings
6.7% of total
Strict
2 listings
13.3% of total
Cancellation Policy Insights for Landford
- The prevailing Airbnb cancellation policy trend in Landford is Moderate, used by 46.7% of listings.
- The market strongly favors guest-friendly terms, with 73.4% of listings offering Flexible or Moderate policies. This suggests guests in Landford may expect booking flexibility.
Recommendations for Hosts
- Consider adopting a Moderate policy to align with the 46.7% market standard in Landford.
- Using a Strict policy might deter some guests, as only 13.3% of listings use it. Evaluate if potential revenue protection outweighs possible lower booking rates.
- Regularly review your cancellation policy against competitors and market demand shifts in Landford.
Landford STR Booking Lead Time Analysis (2025)
Average Booking Lead Time by Month
Booking Lead Time Insights for Landford
- The overall average booking lead time for vacation rentals in Landford is 40 days.
- Guests book furthest in advance for stays during June (average 75 days), likely coinciding with peak travel demand or local events.
- The shortest booking windows occur for stays in March (average 24 days), indicating more last-minute travel plans during this time.
- Seasonally, Summer (68 days avg.) sees the longest lead times, while Fall (40 days avg.) has the shortest, reflecting typical travel planning cycles.
Recommendations for Hosts
- Use the overall average lead time (40 days) as a baseline for your pricing and availability strategy in Landford.
- For June stays, consider implementing length-of-stay discounts or slightly higher rates for bookings made less than 75 days out to capitalize on advance planning.
- Target marketing efforts for the Summer season well in advance (at least 68 days) to capture early planners.
- Monitor your own booking lead times against these Landford averages to identify opportunities for dynamic pricing adjustments.
Popular & Essential Airbnb Amenities in Landford (2025)
Amenity Prevalence
Amenity Insights for Landford
- Essential amenities in Landford that guests expect include: TV, Heating, Smoke alarm, Wifi, Free parking on premises. Lacking these (any) could significantly impact bookings.
- Popular amenities like Essentials, Hot water, Hangers are common but not universal. Offering these can provide a competitive edge.
Recommendations for Hosts
- Ensure your listing includes all essential amenities for Landford: TV, Heating, Smoke alarm, Wifi, Free parking on premises.
- Consider adding popular differentiators like Essentials or Hot water to increase appeal.
- Highlight unique or less common amenities you offer (e.g., hot tub, dedicated workspace, EV charger) in your listing description and photos.
- Regularly check competitor amenities in Landford to stay competitive.
Landford Airbnb Guest Demographics & Profile Analysis (2025)
Guest Profile Summary for Landford
- The typical guest profile for Airbnb in Landford consists of primarily domestic travelers (90%), often arriving from nearby England, typically belonging to the Post-2000s (Gen Z/Alpha) group (50%), primarily speaking English or French.
- Domestic travelers account for 89.8% of guests.
- Key international markets include United Kingdom (89.8%) and United States (2.3%).
- Top languages spoken are English (65.4%) followed by French (7.7%).
- A significant demographic segment is the Post-2000s (Gen Z/Alpha) group, representing 50% of guests.
Recommendations for Hosts
- Target domestic marketing efforts towards travelers from England and London.
- Tailor amenities and listing descriptions to appeal to the dominant Post-2000s (Gen Z/Alpha) demographic (e.g., highlight fast WiFi, smart home features, local guides).
- Highlight unique local experiences or amenities relevant to the primary guest profile.
- Consider seasonal promotions aligned with peak travel times for key origin markets.
Nearby Short-Term Rental Market Comparison
How does the Landford Airbnb market stack up against its neighbors? Compare key performance metrics like average monthly revenue, ADR, and occupancy rates in surrounding areas to understand the broader regional STR landscape.
| Market | Active Properties | Monthly Revenue | Daily Rate | Avg. Occupancy |
|---|---|---|---|---|
| Englishcombe | 13 | $8,558 | $573.69 | 49% |
| Dorney | 12 | $8,335 | $622.48 | 45% |
| Chew Magna | 14 | $6,649 | $399.59 | 46% |
| Lambourn | 11 | $6,081 | $669.47 | 28% |
| City of Westminster | 1,327 | $6,043 | $486.66 | 52% |
| Long Sutton | 17 | $5,726 | $383.88 | 46% |
| Stoke St. Michael | 10 | $5,277 | $424.04 | 42% |
| Winsham | 10 | $5,154 | $484.22 | 52% |
| Oldland Common | 13 | $5,093 | $355.47 | 43% |
| Wraysbury | 14 | $4,719 | $396.18 | 46% |