Lancaster Airbnb Market Analysis 2025: Short Term Rental Data & Vacation Rental Statistics in England, United Kingdom
Is Airbnb profitable in Lancaster in 2025? Explore comprehensive Airbnb analytics for Lancaster, England, United Kingdom to uncover income potential. This 2025 STR market report for Lancaster, based on AirROI data from April 2024 to March 2025, reveals key trends in the market of 649 active listings.
Whether you're considering an Airbnb investment in Lancaster, optimizing your existing vacation rental, or exploring rental arbitrage opportunities, understanding the Lancaster Airbnb data is crucial. Leveraging the low regulation environment is key to maximizing your short term rental income potential. Let's dive into the specifics.
Key Lancaster Airbnb Performance Metrics Overview
Monthly Airbnb Revenue Variations & Income Potential in Lancaster (2025)
Understanding the monthly revenue variations for Airbnb listings in Lancaster is key to maximizing your short term rental income potential. Seasonality significantly impacts earnings. Our analysis, based on data from the past 12 months, shows that the peak revenue month for STRs in Lancaster is typically August, while March often presents the lowest earnings, highlighting opportunities for strategic pricing adjustments during shoulder and low seasons. Explore the typical Airbnb income in Lancaster across different performance tiers:
- Best-in-class properties (Top 10%) achieve $4,766+ monthly, often utilizing dynamic pricing and superior guest experiences.
- Strong performing properties (Top 25%) earn $3,102 or more, indicating effective management and desirable locations/amenities.
- Typical properties (Median) generate around $1,861 per month, representing the average market performance.
- Entry-level properties (Bottom 25%) see earnings around $913, often with potential for optimization.
Average Monthly Airbnb Earnings Trend in Lancaster
Lancaster Airbnb Occupancy Rate Trends (2025)
Maximize your bookings by understanding the Lancaster STR occupancy trends. Seasonal demand shifts significantly influence how often properties are booked. Typically, Augustsees the highest demand (peak season occupancy), while March experiences the lowest (low season). Effective strategies, like adjusting minimum stays or offering promotions, can boost occupancy during slower periods. Here's how different property tiers perform in Lancaster:
- Best-in-class properties (Top 10%) achieve 82%+ occupancy, indicating high desirability and potentially optimized availability.
- Strong performing properties (Top 25%) maintain 64% or higher occupancy, suggesting good market fit and guest satisfaction.
- Typical properties (Median) have an occupancy rate around 38%.
- Entry-level properties (Bottom 25%) average 19% occupancy, potentially facing higher vacancy.
Average Monthly Occupancy Rate Trend in Lancaster
Average Daily Rate (ADR) Airbnb Trends in Lancaster (2025)
Effective short term rental pricing strategy in Lancaster involves understanding monthly ADR fluctuations. The Average Daily Rate (ADR) for Airbnb in Lancaster typically peaks in August and dips lowest during March. Leveraging Airbnb dynamic pricing tools or strategies based on this seasonality can significantly boost revenue. Here's a look at the typical nightly rates achieved:
- Best-in-class properties (Top 10%) command rates of $285+ per night, often due to premium features or locations.
- Strong performing properties (Top 25%) achieve nightly rates of $196 or more.
- Typical properties (Median) charge around $135 per night.
- Entry-level properties (Bottom 25%) earn around $98 per night.
Average Daily Rate (ADR) Trend by Month in Lancaster
Get Live Lancaster Market Intelligence 👇

Explore Real-time Analytics
Airbnb Seasonality Analysis & Trends in Lancaster (2025)
Peak Season (August, July, May)
- Revenue averages $3,083 per month
- Occupancy rates average 50.2%
- Daily rates average $182
Shoulder Season
- Revenue averages $2,450 per month
- Occupancy maintains around 40.8%
- Daily rates hold near $176
Low Season (February, March, November)
- Revenue drops to average $1,910 per month
- Occupancy decreases to average 36.4%
- Daily rates adjust to average $166
Seasonality Insights for Lancaster
- The Airbnb seasonality in Lancaster shows moderate seasonality with distinct peak and low periods. While the sections above show seasonal averages, it's also insightful to look at the extremes:
- During the high season, the absolute peak month showcases Lancaster's highest earning potential, with monthly revenues capable of climbing to $3,386, occupancy reaching a high of 57.3%, and ADRs peaking at $183.
- Conversely, the slowest single month of the year, typically falling within the low season, marks the market's lowest point. In this month, revenue might dip to $1,743, occupancy could drop to 33.1%, and ADRs may adjust down to $163.
- Understanding both the seasonal averages and these monthly peaks and troughs in revenue, occupancy, and ADR is crucial for maximizing your Airbnb profit potential in Lancaster.
Seasonal Strategies for Maximizing Profit
- Peak Season: Maximize revenue through premium pricing and potentially longer minimum stays. Ensure high availability.
- Low Season: Offer competitive pricing, special promotions (e.g., extended stay discounts), and flexible cancellation policies. Target off-season travelers like remote workers or budget-conscious guests.
- Shoulder Seasons: Implement dynamic pricing that balances peak and low rates. Target weekend travelers or specific events. Offer slightly more flexible terms than peak season.
- Regularly analyze your own performance against these Lancaster seasonality benchmarks and adjust your pricing and availability strategy accordingly.
Best Areas for Airbnb Investment in Lancaster (2025)
Exploring the top neighborhoods for short-term rentals in Lancaster? This section highlights key areas, outlining why they are attractive for hosts and guests, along with notable local attractions. Consider these locations based on your target guest profile and investment strategy.
| Neighborhood / Area | Why Host Here? (Target Guests & Appeal) | Key Attractions & Landmarks |
|---|---|---|
| City Centre | Lancaster's bustling hub with historic architecture, shops, and eateries. Ideal for tourists who want to explore local history and attractions. | Lancaster Castle, Lancaster City Museum, The Grand Theatre, Market Square, Ashton Memorial |
| Morecambe Bay | A beautiful coastal area just a short drive from Lancaster, featuring stunning views and outdoor activities. Great for visitors looking to enjoy the seaside. | Morecambe Beach, Happy Mount Park, Eric Morecambe Statue, The Stone Jetty, The Platform |
| Bowerham | A residential neighborhood with a mix of historic and modern houses, close to the university and local amenities. Appeals to families and university students. | Gregson Centre, University of Cumbria, local parks, Bowerham House |
| Caton | A quaint village just outside Lancaster, offering a rural charm and access to nature. Perfect for those seeking tranquility and outdoor pursuits. | River Lune, Caton Green, Bowland Forest, local walking trails |
| Heysham | Another attractive coastal area with a rich history and impressive views. Suitable for those looking for a more relaxed environment that’s still close to Lancaster. | Heysham Village, St Patrick's Chapel, Heysham Heritage Coast, Heysham Nature Reserve |
| Silverdale | A picturesque village with stunning coastal scenery, Silverdale is popular with nature lovers and those seeking a calming retreat tucked away from city life. | Silverdale Nature Reserve, Arnside and Silverdale AONB, local walking paths, the shoreline |
| Scotforth | A suburban area close to the university and city centre, making it appealing to students and young professionals. Offers convenience and amenities. | local shops and cafes, St. Paul's Church, nearby parks, Scotforth Green |
| Halton | A small village adjacent to Lancaster, Halton provides a community feel with easy access to both urban and rural settings, attracting families and professionals alike. | Halton Mill, local parks, Lancaster Canal, Halton Nature Reserve |
Understanding Airbnb License Requirements & STR Laws in Lancaster (2025)
While Lancaster, England, United Kingdom currently shows low STR regulations, specific Airbnb license requirements might still exist or change. Always verify the latest short term rental regulations and Airbnb license requirements directly with local government authorities for Lancaster to ensure full compliance before hosting.
(Source: AirROI data, 2025, finding no licensed listings among those analyzed)
Top Performing Airbnb Properties in Lancaster (2025)
Benchmark your potential! Explore examples of top-performing Airbnb properties in Lancasterbased on Trailing Twelve Month (TTM) revenue. Analyze their characteristics, revenue, occupancy rate, and ADR to understand what drives success in this market.
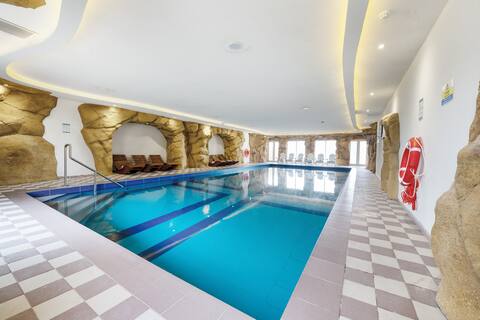
6* Manor, Beach Pool Club Casino
Entire Place • 7 bedrooms
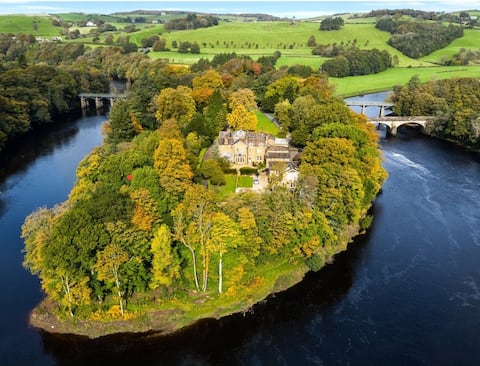
6* Lux Manor House Private Island By LakeDistrict
Entire Place • 9 bedrooms
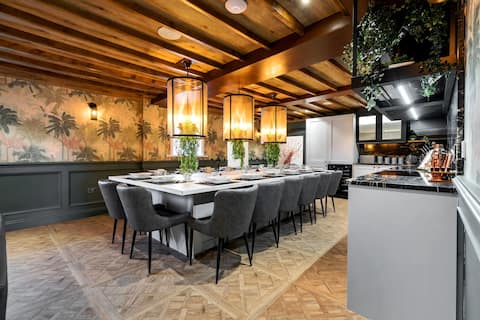
6* Private Beach Pool & Towers
Entire Place • 5 bedrooms
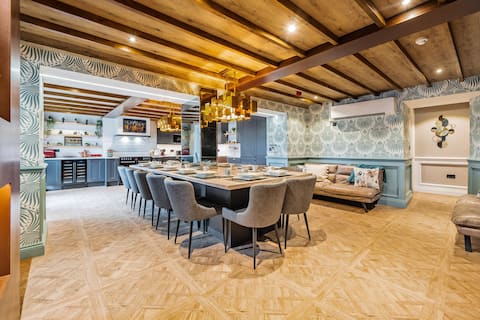
6* Lux Private Beach Manor, Pool
Entire Place • 5 bedrooms
Waterside - a lakeside house - hot tub/sauna/views
Entire Place • 3 bedrooms

Clearwater - lakeside house with hot tub and views
Entire Place • 3 bedrooms
Note: Performance varies based on location, size, amenities, seasonality, and management quality. Data reflects the past 12 months.
Top Performing Airbnb Hosts in Lancaster (2025)
Learn from the best! This table showcases top-performing Airbnb hosts in Lancaster based on the number of properties managed and estimated total revenue over the past year. Analyze their scale and performance metrics.
| Host Name | Properties | Grossing Revenue | Stay Reviews | Avg Rating |
|---|---|---|---|---|
| Jerry | 8 | $1,589,844 | 697 | 4.95/5.0 |
| Cottages | 31 | $1,009,849 | 180 | 2.78/5.0 |
| Luan | 2 | $346,337 | 255 | 5.00/5.0 |
| Jenny | 14 | $306,302 | 211 | 4.13/5.0 |
| Sleep Inn Group | 17 | $299,627 | 170 | 3.69/5.0 |
| BayStay | 13 | $276,927 | 1380 | 4.81/5.0 |
| Michelle | 10 | $251,197 | 341 | 4.91/5.0 |
| Sam | 4 | $225,807 | 1227 | 4.98/5.0 |
| Sally | 13 | $203,627 | 283 | 4.51/5.0 |
| Richard & Lee-Anne | 5 | $195,169 | 500 | 4.75/5.0 |
Analyzing the strategies of top hosts, such as their property selection, pricing, and guest communication, can offer valuable lessons for optimizing your own Airbnb operations in Lancaster.
Dive Deeper: Advanced Lancaster STR Market Data (2025)
Ready to unlock more insights? AirROI provides access to advanced metrics and comprehensive Airbnb data for Lancaster. Explore detailed analytics beyond this report to refine your investment strategy, optimize pricing, and maximize your vacation rental profits.
Explore Advanced MetricsLancaster Short-Term Rental Market Composition (2025): Property & Room Types
Room Type Distribution
Property Type Distribution
Market Composition Insights for Lancaster
- The Lancaster Airbnb market composition is heavily skewed towards Entire Home/Apt listings, which make up 84.7% of the 649 active rentals. This indicates strong guest preference for privacy and space.
- Looking at the property type distribution in Lancaster, House properties are the most common (49.6%), reflecting the local real estate landscape.
- Houses represent a significant 49.6% portion, catering likely to families or larger groups.
- The presence of 5.4% Hotel/Boutique listings indicates integration with traditional hospitality.
- Smaller segments like unique stays (combined 0.8%) offer potential for unique stay experiences.
Lancaster Airbnb Room Capacity Analysis (2025): Bedroom Distribution
Distribution of Listings by Number of Bedrooms
Room Capacity Insights for Lancaster
- The dominant room capacity in Lancaster is 2 bedrooms listings, making up 39.3% of the market. This suggests a strong demand for properties suitable for couples or solo travelers.
- Together, 2 bedrooms and 1 bedroom properties represent 65.2% of the active Airbnb listings in Lancaster, indicating a high concentration in these sizes.
- A significant 27.3% of listings offer 3+ bedrooms, catering to larger groups and families seeking more space in Lancaster.
Lancaster Vacation Rental Guest Capacity Trends (2025)
Distribution of Listings by Guest Capacity
Guest Capacity Insights for Lancaster
- The most common guest capacity trend in Lancaster vacation rentals is listings accommodating 4 guests (28.7%). This suggests the primary traveler segment is likely small families or groups.
- Properties designed for 4 guests and 2 guests dominate the Lancaster STR market, accounting for 49.5% of listings.
- 30.1% of properties accommodate 6+ guests, serving the market segment for larger families or group travel in Lancaster.
- On average, properties in Lancaster are equipped to host 4.1 guests.
Lancaster Airbnb Booking Patterns (2025): Available vs. Booked Days
Available Days Distribution
Booked Days Distribution
Booking Pattern Insights for Lancaster
- The most common availability pattern in Lancaster falls within the 271-366 days range, representing 38.8% of listings. This suggests many properties have significant open periods on their calendars.
- Approximately 72.2% of listings show high availability (181+ days open annually), indicating potential for increased bookings or specific owner usage patterns.
- For booked days, the 91-180 days range is most frequent in Lancaster (33.6%), reflecting common guest stay durations or potential owner blocking patterns.
- A notable 28.8% of properties secure long booking periods (181+ days booked per year), highlighting successful long-term rental strategies or significant owner usage.
Lancaster Airbnb Minimum Stay Requirements Analysis
Distribution of Listings by Minimum Night Requirement
1 Night
155 listings
26.2% of total
2 Nights
213 listings
36% of total
3 Nights
97 listings
16.4% of total
4-6 Nights
26 listings
4.4% of total
7-29 Nights
8 listings
1.4% of total
30+ Nights
92 listings
15.6% of total
Key Insights
- The most prevalent minimum stay requirement in Lancaster is 2 Nights, adopted by 36% of listings. This highlights the market's preference for shorter, flexible bookings.
- A strong majority (62.2%) of the Lancaster Airbnb data shows acceptance of very short stays (1-2 nights), indicating a dynamic, high-turnover market.
- A significant segment (15.6%) caters to monthly stays (30+ nights) in Lancaster, pointing to opportunities in the extended-stay market.
Recommendations
- Align with the market by considering a 2 Nights minimum stay, as 36% of Lancaster hosts use this setting.
- If feasible, allowing 1-night stays, especially midweek or during low season, could capture last-minute bookings, as only 26.2% currently do.
- Explore offering discounts for stays of 30+ nights to attract the 15.6% of the market seeking extended stays.
- Adjust minimum nights based on seasonality – potentially shorter during low season and longer during peak demand periods in Lancaster.
Lancaster Airbnb Cancellation Policy Trends Analysis (2025)
Super Strict 60 Days
24 listings
4.4% of total
Super Strict 30 Days
7 listings
1.3% of total
Non-refundable
2 listings
0.4% of total
Flexible
124 listings
22.8% of total
Moderate
174 listings
32% of total
Firm
82 listings
15.1% of total
Strict
130 listings
23.9% of total
Cancellation Policy Insights for Lancaster
- The prevailing Airbnb cancellation policy trend in Lancaster is Moderate, used by 32% of listings.
- There's a relatively balanced mix between guest-friendly (54.8%) and stricter (39.0%) policies, offering choices for different guest needs.
Recommendations for Hosts
- Consider adopting a Moderate policy to align with the 32% market standard in Lancaster.
- Regularly review your cancellation policy against competitors and market demand shifts in Lancaster.
Lancaster STR Booking Lead Time Analysis (2025)
Average Booking Lead Time by Month
Booking Lead Time Insights for Lancaster
- The overall average booking lead time for vacation rentals in Lancaster is 51 days.
- Guests book furthest in advance for stays during June (average 75 days), likely coinciding with peak travel demand or local events.
- The shortest booking windows occur for stays in March (average 43 days), indicating more last-minute travel plans during this time.
- Seasonally, Summer (68 days avg.) sees the longest lead times, while Winter (55 days avg.) has the shortest, reflecting typical travel planning cycles.
Recommendations for Hosts
- Use the overall average lead time (51 days) as a baseline for your pricing and availability strategy in Lancaster.
- For June stays, consider implementing length-of-stay discounts or slightly higher rates for bookings made less than 75 days out to capitalize on advance planning.
- Target marketing efforts for the Summer season well in advance (at least 68 days) to capture early planners.
- Monitor your own booking lead times against these Lancaster averages to identify opportunities for dynamic pricing adjustments.
Popular & Essential Airbnb Amenities in Lancaster (2025)
Amenity Prevalence
Amenity Insights for Lancaster
- Essential amenities in Lancaster that guests expect include: Smoke alarm, TV, Heating. Lacking these (any) could significantly impact bookings.
- Popular amenities like Wifi, Kitchen, Hot water are common but not universal. Offering these can provide a competitive edge.
- Warning: Wifi is not universally provided but is considered essential globally. Ensure reliable Wifi is offered.
Recommendations for Hosts
- Ensure your listing includes all essential amenities for Lancaster: Smoke alarm, TV, Heating.
- Prioritize adding missing essentials: Smoke alarm, TV, Heating.
- Consider adding popular differentiators like Wifi or Kitchen to increase appeal.
- Highlight unique or less common amenities you offer (e.g., hot tub, dedicated workspace, EV charger) in your listing description and photos.
- Regularly check competitor amenities in Lancaster to stay competitive.
Lancaster Airbnb Guest Demographics & Profile Analysis (2025)
Guest Profile Summary for Lancaster
- The typical guest profile for Airbnb in Lancaster consists of primarily domestic travelers (89%), often arriving from nearby England, typically belonging to the Post-2000s (Gen Z/Alpha) group (50%), primarily speaking English or French.
- Domestic travelers account for 88.7% of guests.
- Key international markets include United Kingdom (88.7%) and United States (2.4%).
- Top languages spoken are English (68.4%) followed by French (6.8%).
- A significant demographic segment is the Post-2000s (Gen Z/Alpha) group, representing 50% of guests.
Recommendations for Hosts
- Target domestic marketing efforts towards travelers from England and London.
- Tailor amenities and listing descriptions to appeal to the dominant Post-2000s (Gen Z/Alpha) demographic (e.g., highlight fast WiFi, smart home features, local guides).
- Highlight unique local experiences or amenities relevant to the primary guest profile.
- Consider seasonal promotions aligned with peak travel times for key origin markets.
Nearby Short-Term Rental Market Comparison
How does the Lancaster Airbnb market stack up against its neighbors? Compare key performance metrics like average monthly revenue, ADR, and occupancy rates in surrounding areas to understand the broader regional STR landscape.
| Market | Active Properties | Monthly Revenue | Daily Rate | Avg. Occupancy |
|---|---|---|---|---|
| Gorebridge | 12 | $6,209 | $493.62 | 54% |
| Grinton | 14 | $5,456 | $365.05 | 51% |
| Cartmel Fell | 17 | $4,719 | $331.68 | 52% |
| Casterton | 11 | $4,578 | $300.82 | 51% |
| Cark | 11 | $4,540 | $885.21 | 31% |
| City of Edinburgh | 4,312 | $4,528 | $274.67 | 61% |
| Eglwys-bach | 16 | $4,413 | $315.23 | 52% |
| Waverton | 16 | $4,358 | $444.20 | 33% |
| Hayton | 13 | $4,333 | $239.53 | 60% |
| Watermillock | 16 | $4,281 | $274.03 | 50% |