Lamplugh Airbnb Market Analysis 2025: Short Term Rental Data & Vacation Rental Statistics in England, United Kingdom
Is Airbnb profitable in Lamplugh in 2025? Explore comprehensive Airbnb analytics for Lamplugh, England, United Kingdom to uncover income potential. This 2025 STR market report for Lamplugh, based on AirROI data from April 2024 to March 2025, reveals key trends in the niche market of 19 active listings.
Whether you're considering an Airbnb investment in Lamplugh, optimizing your existing vacation rental, or exploring rental arbitrage opportunities, understanding the Lamplugh Airbnb data is crucial. Leveraging the low regulation environment is key to maximizing your short term rental income potential. Let's dive into the specifics.
Key Lamplugh Airbnb Performance Metrics Overview
Monthly Airbnb Revenue Variations & Income Potential in Lamplugh (2025)
Understanding the monthly revenue variations for Airbnb listings in Lamplugh is key to maximizing your short term rental income potential. Seasonality significantly impacts earnings. Our analysis, based on data from the past 12 months, shows that the peak revenue month for STRs in Lamplugh is typically August, while January often presents the lowest earnings, highlighting opportunities for strategic pricing adjustments during shoulder and low seasons. Explore the typical Airbnb income in Lamplugh across different performance tiers:
- Best-in-class properties (Top 10%) achieve $6,153+ monthly, often utilizing dynamic pricing and superior guest experiences.
- Strong performing properties (Top 25%) earn $3,212 or more, indicating effective management and desirable locations/amenities.
- Typical properties (Median) generate around $1,963 per month, representing the average market performance.
- Entry-level properties (Bottom 25%) see earnings around $1,210, often with potential for optimization.
Average Monthly Airbnb Earnings Trend in Lamplugh
Lamplugh Airbnb Occupancy Rate Trends (2025)
Maximize your bookings by understanding the Lamplugh STR occupancy trends. Seasonal demand shifts significantly influence how often properties are booked. Typically, Augustsees the highest demand (peak season occupancy), while January experiences the lowest (low season). Effective strategies, like adjusting minimum stays or offering promotions, can boost occupancy during slower periods. Here's how different property tiers perform in Lamplugh:
- Best-in-class properties (Top 10%) achieve 82%+ occupancy, indicating high desirability and potentially optimized availability.
- Strong performing properties (Top 25%) maintain 64% or higher occupancy, suggesting good market fit and guest satisfaction.
- Typical properties (Median) have an occupancy rate around 43%.
- Entry-level properties (Bottom 25%) average 23% occupancy, potentially facing higher vacancy.
Average Monthly Occupancy Rate Trend in Lamplugh
Average Daily Rate (ADR) Airbnb Trends in Lamplugh (2025)
Effective short term rental pricing strategy in Lamplugh involves understanding monthly ADR fluctuations. The Average Daily Rate (ADR) for Airbnb in Lamplugh typically peaks in December and dips lowest during November. Leveraging Airbnb dynamic pricing tools or strategies based on this seasonality can significantly boost revenue. Here's a look at the typical nightly rates achieved:
- Best-in-class properties (Top 10%) command rates of $530+ per night, often due to premium features or locations.
- Strong performing properties (Top 25%) achieve nightly rates of $206 or more.
- Typical properties (Median) charge around $126 per night.
- Entry-level properties (Bottom 25%) earn around $103 per night.
Average Daily Rate (ADR) Trend by Month in Lamplugh
Get Live Lamplugh Market Intelligence 👇

Explore Real-time Analytics
Airbnb Seasonality Analysis & Trends in Lamplugh (2025)
Peak Season (August, June, May)
- Revenue averages $3,331 per month
- Occupancy rates average 54.6%
- Daily rates average $271
Shoulder Season
- Revenue averages $2,594 per month
- Occupancy maintains around 47.3%
- Daily rates hold near $271
Low Season (January, February, March)
- Revenue drops to average $2,129 per month
- Occupancy decreases to average 36.0%
- Daily rates adjust to average $263
Seasonality Insights for Lamplugh
- The Airbnb seasonality in Lamplugh shows moderate seasonality with distinct peak and low periods. While the sections above show seasonal averages, it's also insightful to look at the extremes:
- During the high season, the absolute peak month showcases Lamplugh's highest earning potential, with monthly revenues capable of climbing to $3,614, occupancy reaching a high of 67.7%, and ADRs peaking at $307.
- Conversely, the slowest single month of the year, typically falling within the low season, marks the market's lowest point. In this month, revenue might dip to $1,758, occupancy could drop to 29.9%, and ADRs may adjust down to $239.
- Understanding both the seasonal averages and these monthly peaks and troughs in revenue, occupancy, and ADR is crucial for maximizing your Airbnb profit potential in Lamplugh.
Seasonal Strategies for Maximizing Profit
- Peak Season: Maximize revenue through premium pricing and potentially longer minimum stays. Ensure high availability.
- Low Season: Offer competitive pricing, special promotions (e.g., extended stay discounts), and flexible cancellation policies. Target off-season travelers like remote workers or budget-conscious guests.
- Shoulder Seasons: Implement dynamic pricing that balances peak and low rates. Target weekend travelers or specific events. Offer slightly more flexible terms than peak season.
- Regularly analyze your own performance against these Lamplugh seasonality benchmarks and adjust your pricing and availability strategy accordingly.
Best Areas for Airbnb Investment in Lamplugh (2025)
Exploring the top neighborhoods for short-term rentals in Lamplugh? This section highlights key areas, outlining why they are attractive for hosts and guests, along with notable local attractions. Consider these locations based on your target guest profile and investment strategy.
| Neighborhood / Area | Why Host Here? (Target Guests & Appeal) | Key Attractions & Landmarks |
|---|---|---|
| Lamplugh Village | A charming rural village with historic character and picturesque views, ideal for relaxation and rural tourism. | St. John's Church, Scenic walking trails, Local pubs, Fishing spots, Wildlife watching |
| Loweswater | Known for its stunning lake and surrounding hills, this area attracts nature lovers and hikers, making it a popular retreat for outdoor enthusiasts. | Loweswater Lake, Walking trails, Local cafes, Wildlife spotting, Dramatic scenery |
| Buttermere | A beautiful, tranquil village surrounded by mountains and lakes, ideal for travelers seeking breathtaking natural landscapes and outdoor activities. | Buttermere Lake, Haystacks mountain, Rowing boat rentals, Scenic walks, Photography spots |
| Cockermouth | A historic market town with a vibrant culture, offering a mix of shopping, dining, and cultural attractions, appealing to a diverse range of visitors. | Wordsworth House, Cockermouth Castle, Local markets, Historic pubs, Art galleries |
| Keswick | A lively town at the heart of the Lake District, known for its outdoor adventures and beautiful landscapes, making it a hotspot for tourists. | Derwentwater, Theatre by the Lake, Local shops, Walking and hiking trails, Museums |
| Ennerdale Water | A secluded spot favored by hikers and nature lovers, offering stunning views and a peaceful environment, perfect for those looking to escape the hustle. | Ennerdale Water, Walking trails, Cycling routes, Scenic picnic spots, Nature reserves |
| Workington | A coastal town with a rich industrial history and access to amenities, appealing to families and those looking for convenient lodging options. | Workington Harbour, Local parks, Shopping centers, Historical sites, Cinque Ports Association |
| Whitehaven | A picturesque harbor town with historical significance and stunning coastal scenery, attracting visitors interested in heritage and natural beauty. | Whitehaven Harbour, The Beacon Museum, Haig Colliery Mining Museum, Coastal walks, Historic buildings |
Understanding Airbnb License Requirements & STR Laws in Lamplugh (2025)
While Lamplugh, England, United Kingdom currently shows low STR regulations, specific Airbnb license requirements might still exist or change. Always verify the latest short term rental regulations and Airbnb license requirements directly with local government authorities for Lamplugh to ensure full compliance before hosting.
(Source: AirROI data, 2025, finding no licensed listings among those analyzed)
Top Performing Airbnb Properties in Lamplugh (2025)
Benchmark your potential! Explore examples of top-performing Airbnb properties in Lamplughbased on Trailing Twelve Month (TTM) revenue. Analyze their characteristics, revenue, occupancy rate, and ADR to understand what drives success in this market.
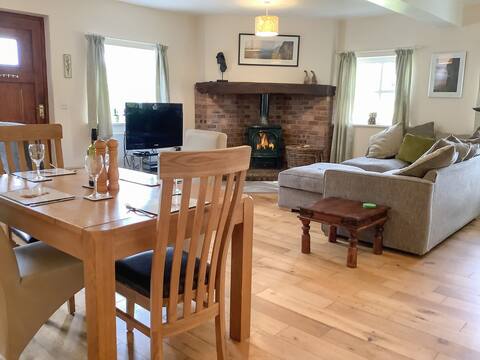
Pussywillow Cottage
Entire Place • 2 bedrooms
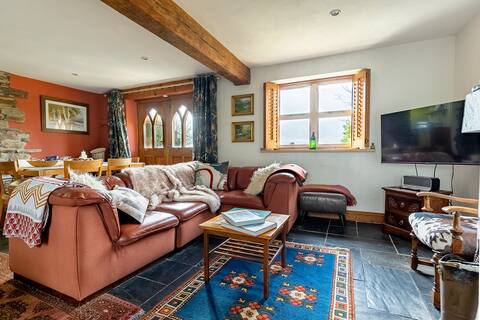
Luxury Lake District Retreat above Ennerdale
Entire Place • 2 bedrooms
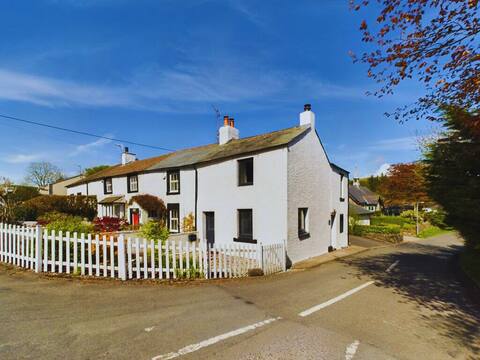
Two bed Cottage with Log Burner & Incredible Views
Entire Place • 2 bedrooms
Stream Side View
Entire Place • 2 bedrooms
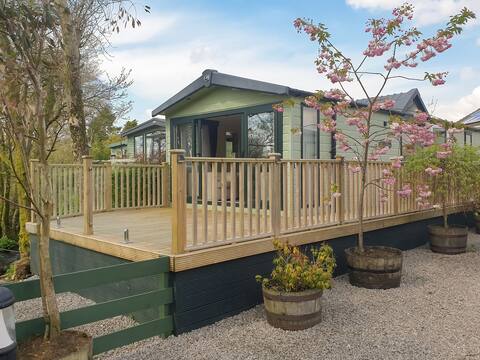
Caravan No.15 - Lamplugh- Lake District
Entire Place • 2 bedrooms

Luxury cottage between Loweswater and Ennerdale
Entire Place • 2 bedrooms
Note: Performance varies based on location, size, amenities, seasonality, and management quality. Data reflects the past 12 months.
Top Performing Airbnb Hosts in Lamplugh (2025)
Learn from the best! This table showcases top-performing Airbnb hosts in Lamplugh based on the number of properties managed and estimated total revenue over the past year. Analyze their scale and performance metrics.
| Host Name | Properties | Grossing Revenue | Stay Reviews | Avg Rating |
|---|---|---|---|---|
| Cottages | 3 | $134,976 | 37 | 1.59/5.0 |
| Mich | 1 | $71,655 | 25 | 4.84/5.0 |
| Ben | 1 | $46,128 | 17 | 4.76/5.0 |
| Louise | 2 | $38,176 | 150 | 4.95/5.0 |
| Dawn | 4 | $30,580 | 263 | 4.17/5.0 |
| Sophie | 1 | $30,448 | 104 | 4.92/5.0 |
| Sinead | 1 | $27,562 | 66 | 5.00/5.0 |
| Helen | 1 | $21,984 | 83 | 4.89/5.0 |
| Anne | 1 | $18,034 | 125 | 4.99/5.0 |
| Kerrie | 1 | $16,513 | 75 | 4.95/5.0 |
Analyzing the strategies of top hosts, such as their property selection, pricing, and guest communication, can offer valuable lessons for optimizing your own Airbnb operations in Lamplugh.
Dive Deeper: Advanced Lamplugh STR Market Data (2025)
Ready to unlock more insights? AirROI provides access to advanced metrics and comprehensive Airbnb data for Lamplugh. Explore detailed analytics beyond this report to refine your investment strategy, optimize pricing, and maximize your vacation rental profits.
Explore Advanced MetricsLamplugh Short-Term Rental Market Composition (2025): Property & Room Types
Room Type Distribution
Property Type Distribution
Market Composition Insights for Lamplugh
- The Lamplugh Airbnb market composition is heavily skewed towards Entire Home/Apt listings, which make up 94.7% of the 19 active rentals. This indicates strong guest preference for privacy and space.
- Looking at the property type distribution in Lamplugh, House properties are the most common (84.2%), reflecting the local real estate landscape.
- Houses represent a significant 84.2% portion, catering likely to families or larger groups.
Lamplugh Airbnb Room Capacity Analysis (2025): Bedroom Distribution
Distribution of Listings by Number of Bedrooms
Room Capacity Insights for Lamplugh
- The dominant room capacity in Lamplugh is 2 bedrooms listings, making up 78.9% of the market. This suggests a strong demand for properties suitable for couples or solo travelers.
- Together, 2 bedrooms and 1 bedroom properties represent 89.4% of the active Airbnb listings in Lamplugh, indicating a high concentration in these sizes.
- Listings with 3+ bedrooms (5.3%) represent a smaller niche, potentially indicating an underserved market for larger group accommodations in Lamplugh.
Lamplugh Vacation Rental Guest Capacity Trends (2025)
Distribution of Listings by Guest Capacity
Guest Capacity Insights for Lamplugh
- The most common guest capacity trend in Lamplugh vacation rentals is listings accommodating 4 guests (47.4%). This suggests the primary traveler segment is likely small families or groups.
- Properties designed for 4 guests and 6 guests dominate the Lamplugh STR market, accounting for 84.2% of listings.
- 36.8% of properties accommodate 6+ guests, serving the market segment for larger families or group travel in Lamplugh.
- On average, properties in Lamplugh are equipped to host 4.5 guests.
Lamplugh Airbnb Booking Patterns (2025): Available vs. Booked Days
Available Days Distribution
Booked Days Distribution
Booking Pattern Insights for Lamplugh
- The most common availability pattern in Lamplugh falls within the 181-270 days range, representing 36.8% of listings. This suggests many properties have significant open periods on their calendars.
- Approximately 63.1% of listings show high availability (181+ days open annually), indicating potential for increased bookings or specific owner usage patterns.
- For booked days, the 91-180 days range is most frequent in Lamplugh (36.8%), reflecting common guest stay durations or potential owner blocking patterns.
- A notable 36.9% of properties secure long booking periods (181+ days booked per year), highlighting successful long-term rental strategies or significant owner usage.
Lamplugh Airbnb Minimum Stay Requirements Analysis
Distribution of Listings by Minimum Night Requirement
1 Night
2 listings
11.1% of total
2 Nights
10 listings
55.6% of total
3 Nights
2 listings
11.1% of total
30+ Nights
4 listings
22.2% of total
Key Insights
- The most prevalent minimum stay requirement in Lamplugh is 2 Nights, adopted by 55.6% of listings. This highlights the market's preference for shorter, flexible bookings.
- A strong majority (66.7%) of the Lamplugh Airbnb data shows acceptance of very short stays (1-2 nights), indicating a dynamic, high-turnover market.
- A significant segment (22.2%) caters to monthly stays (30+ nights) in Lamplugh, pointing to opportunities in the extended-stay market.
Recommendations
- Align with the market by considering a 2 Nights minimum stay, as 55.6% of Lamplugh hosts use this setting.
- If feasible, allowing 1-night stays, especially midweek or during low season, could capture last-minute bookings, as only 11.1% currently do.
- A 2-night minimum appears standard (55.6%). Consider this for weekends or peak periods.
- Explore offering discounts for stays of 30+ nights to attract the 22.2% of the market seeking extended stays.
- Adjust minimum nights based on seasonality – potentially shorter during low season and longer during peak demand periods in Lamplugh.
Lamplugh Airbnb Cancellation Policy Trends Analysis (2025)
Super Strict 60 Days
1 listings
5.9% of total
Flexible
10 listings
58.8% of total
Moderate
5 listings
29.4% of total
Strict
1 listings
5.9% of total
Cancellation Policy Insights for Lamplugh
- The prevailing Airbnb cancellation policy trend in Lamplugh is Flexible, used by 58.8% of listings.
- The market strongly favors guest-friendly terms, with 88.2% of listings offering Flexible or Moderate policies. This suggests guests in Lamplugh may expect booking flexibility.
- Strict cancellation policies are quite rare (5.9%), potentially making listings with this policy less competitive unless justified by high demand or property type.
Recommendations for Hosts
- Consider adopting a Flexible policy to align with the 58.8% market standard in Lamplugh.
- Given the high prevalence of Flexible policies (58.8%), offering this can enhance booking appeal, especially during shoulder seasons.
- Using a Strict policy might deter some guests, as only 5.9% of listings use it. Evaluate if potential revenue protection outweighs possible lower booking rates.
- Regularly review your cancellation policy against competitors and market demand shifts in Lamplugh.
Lamplugh STR Booking Lead Time Analysis (2025)
Average Booking Lead Time by Month
Booking Lead Time Insights for Lamplugh
- The overall average booking lead time for vacation rentals in Lamplugh is 70 days.
- Guests book furthest in advance for stays during July (average 113 days), likely coinciding with peak travel demand or local events.
- The shortest booking windows occur for stays in February (average 27 days), indicating more last-minute travel plans during this time.
- Seasonally, Summer (104 days avg.) sees the longest lead times, while Winter (38 days avg.) has the shortest, reflecting typical travel planning cycles.
Recommendations for Hosts
- Use the overall average lead time (70 days) as a baseline for your pricing and availability strategy in Lamplugh.
- For July stays, consider implementing length-of-stay discounts or slightly higher rates for bookings made less than 113 days out to capitalize on advance planning.
- Target marketing efforts for the Summer season well in advance (at least 104 days) to capture early planners.
- Monitor your own booking lead times against these Lamplugh averages to identify opportunities for dynamic pricing adjustments.
Popular & Essential Airbnb Amenities in Lamplugh (2025)
Amenity Prevalence
Amenity Insights for Lamplugh
- Essential amenities in Lamplugh that guests expect include: Free parking on premises, TV, Smoke alarm. Lacking these (any) could significantly impact bookings.
- Popular amenities like Kitchen, Heating, Hot water are common but not universal. Offering these can provide a competitive edge.
Recommendations for Hosts
- Ensure your listing includes all essential amenities for Lamplugh: Free parking on premises, TV, Smoke alarm.
- Consider adding popular differentiators like Kitchen or Heating to increase appeal.
- Highlight unique or less common amenities you offer (e.g., hot tub, dedicated workspace, EV charger) in your listing description and photos.
- Regularly check competitor amenities in Lamplugh to stay competitive.
Lamplugh Airbnb Guest Demographics & Profile Analysis (2025)
Guest Profile Summary for Lamplugh
- The typical guest profile for Airbnb in Lamplugh consists of primarily domestic travelers (93%), often arriving from nearby England, typically belonging to the Post-2000s (Gen Z/Alpha) group (50%), primarily speaking English or French.
- Domestic travelers account for 93.4% of guests.
- Key international markets include United Kingdom (93.4%) and United States (2.7%).
- Top languages spoken are English (64.2%) followed by French (7.5%).
- A significant demographic segment is the Post-2000s (Gen Z/Alpha) group, representing 50% of guests.
Recommendations for Hosts
- Target domestic marketing efforts towards travelers from England and London.
- Tailor amenities and listing descriptions to appeal to the dominant Post-2000s (Gen Z/Alpha) demographic (e.g., highlight fast WiFi, smart home features, local guides).
- Highlight unique local experiences or amenities relevant to the primary guest profile.
- Consider seasonal promotions aligned with peak travel times for key origin markets.
Nearby Short-Term Rental Market Comparison
How does the Lamplugh Airbnb market stack up against its neighbors? Compare key performance metrics like average monthly revenue, ADR, and occupancy rates in surrounding areas to understand the broader regional STR landscape.
| Market | Active Properties | Monthly Revenue | Daily Rate | Avg. Occupancy |
|---|---|---|---|---|
| Galston | 11 | $7,951 | $676.77 | 46% |
| Gorebridge | 12 | $6,209 | $493.62 | 54% |
| Cartmel Fell | 17 | $4,719 | $331.68 | 52% |
| Casterton | 11 | $4,578 | $300.82 | 51% |
| Cark | 11 | $4,540 | $885.21 | 31% |
| City of Edinburgh | 4,312 | $4,528 | $274.67 | 61% |
| Eglwys-bach | 16 | $4,413 | $315.23 | 52% |
| Waverton | 16 | $4,358 | $444.20 | 33% |
| Watermillock | 16 | $4,281 | $274.03 | 50% |
| Kielder | 12 | $4,215 | $329.21 | 53% |