Kirklees Airbnb Market Analysis 2025: Short Term Rental Data & Vacation Rental Statistics in England, United Kingdom
Is Airbnb profitable in Kirklees in 2025? Explore comprehensive Airbnb analytics for Kirklees, England, United Kingdom to uncover income potential. This 2025 STR market report for Kirklees, based on AirROI data from April 2024 to March 2025, reveals key trends in the market of 437 active listings.
Whether you're considering an Airbnb investment in Kirklees, optimizing your existing vacation rental, or exploring rental arbitrage opportunities, understanding the Kirklees Airbnb data is crucial. Leveraging the low regulation environment is key to maximizing your short term rental income potential. Let's dive into the specifics.
Key Kirklees Airbnb Performance Metrics Overview
Monthly Airbnb Revenue Variations & Income Potential in Kirklees (2025)
Understanding the monthly revenue variations for Airbnb listings in Kirklees is key to maximizing your short term rental income potential. Seasonality significantly impacts earnings. Our analysis, based on data from the past 12 months, shows that the peak revenue month for STRs in Kirklees is typically August, while January often presents the lowest earnings, highlighting opportunities for strategic pricing adjustments during shoulder and low seasons. Explore the typical Airbnb income in Kirklees across different performance tiers:
- Best-in-class properties (Top 10%) achieve $4,003+ monthly, often utilizing dynamic pricing and superior guest experiences.
- Strong performing properties (Top 25%) earn $2,637 or more, indicating effective management and desirable locations/amenities.
- Typical properties (Median) generate around $1,624 per month, representing the average market performance.
- Entry-level properties (Bottom 25%) see earnings around $801, often with potential for optimization.
Average Monthly Airbnb Earnings Trend in Kirklees
Kirklees Airbnb Occupancy Rate Trends (2025)
Maximize your bookings by understanding the Kirklees STR occupancy trends. Seasonal demand shifts significantly influence how often properties are booked. Typically, Augustsees the highest demand (peak season occupancy), while January experiences the lowest (low season). Effective strategies, like adjusting minimum stays or offering promotions, can boost occupancy during slower periods. Here's how different property tiers perform in Kirklees:
- Best-in-class properties (Top 10%) achieve 81%+ occupancy, indicating high desirability and potentially optimized availability.
- Strong performing properties (Top 25%) maintain 64% or higher occupancy, suggesting good market fit and guest satisfaction.
- Typical properties (Median) have an occupancy rate around 42%.
- Entry-level properties (Bottom 25%) average 20% occupancy, potentially facing higher vacancy.
Average Monthly Occupancy Rate Trend in Kirklees
Average Daily Rate (ADR) Airbnb Trends in Kirklees (2025)
Effective short term rental pricing strategy in Kirklees involves understanding monthly ADR fluctuations. The Average Daily Rate (ADR) for Airbnb in Kirklees typically peaks in August and dips lowest during November. Leveraging Airbnb dynamic pricing tools or strategies based on this seasonality can significantly boost revenue. Here's a look at the typical nightly rates achieved:
- Best-in-class properties (Top 10%) command rates of $265+ per night, often due to premium features or locations.
- Strong performing properties (Top 25%) achieve nightly rates of $164 or more.
- Typical properties (Median) charge around $117 per night.
- Entry-level properties (Bottom 25%) earn around $83 per night.
Average Daily Rate (ADR) Trend by Month in Kirklees
Get Live Kirklees Market Intelligence 👇

Explore Real-time Analytics
Airbnb Seasonality Analysis & Trends in Kirklees (2025)
Peak Season (August, July, December)
- Revenue averages $2,561 per month
- Occupancy rates average 49.9%
- Daily rates average $166
Shoulder Season
- Revenue averages $2,204 per month
- Occupancy maintains around 43.1%
- Daily rates hold near $162
Low Season (January, February, March)
- Revenue drops to average $1,703 per month
- Occupancy decreases to average 36.6%
- Daily rates adjust to average $156
Seasonality Insights for Kirklees
- The Airbnb seasonality in Kirklees shows moderate seasonality with distinct peak and low periods. While the sections above show seasonal averages, it's also insightful to look at the extremes:
- During the high season, the absolute peak month showcases Kirklees's highest earning potential, with monthly revenues capable of climbing to $2,634, occupancy reaching a high of 53.2%, and ADRs peaking at $168.
- Conversely, the slowest single month of the year, typically falling within the low season, marks the market's lowest point. In this month, revenue might dip to $1,669, occupancy could drop to 34.2%, and ADRs may adjust down to $154.
- Understanding both the seasonal averages and these monthly peaks and troughs in revenue, occupancy, and ADR is crucial for maximizing your Airbnb profit potential in Kirklees.
Seasonal Strategies for Maximizing Profit
- Peak Season: Maximize revenue through premium pricing and potentially longer minimum stays. Ensure high availability.
- Low Season: Offer competitive pricing, special promotions (e.g., extended stay discounts), and flexible cancellation policies. Target off-season travelers like remote workers or budget-conscious guests.
- Shoulder Seasons: Implement dynamic pricing that balances peak and low rates. Target weekend travelers or specific events. Offer slightly more flexible terms than peak season.
- Regularly analyze your own performance against these Kirklees seasonality benchmarks and adjust your pricing and availability strategy accordingly.
Best Areas for Airbnb Investment in Kirklees (2025)
Exploring the top neighborhoods for short-term rentals in Kirklees? This section highlights key areas, outlining why they are attractive for hosts and guests, along with notable local attractions. Consider these locations based on your target guest profile and investment strategy.
| Neighborhood / Area | Why Host Here? (Target Guests & Appeal) | Key Attractions & Landmarks |
|---|---|---|
| Huddersfield Town Centre | The bustling heart of Kirklees, ideal for visitors seeking culture, shopping, and nightlife. Close to local attractions and excellent transportation links. | The Lawrence Batley Theatre, Huddersfield Art Gallery, Kirklees Museum and Galleries, University of Huddersfield, Greenhead Park |
| Holmfirth | Famous for its charming village atmosphere and connections to the TV show 'Last of the Summer Wine'. Attracts those looking for picturesque scenery and local charm. | The Peak District National Park, Holmfirth Vineyard, Last of the Summer Wine Exhibition, Picturedrome, Mountain Biking Trails |
| Mirfield | A quaint town with a strong community feel, perfect for families and those seeking a quieter stay. Close to natural attractions and historical sites. | Mirfield Railway Station, The Historic Chantry Bridge, Ponds Forge International Sports Centre, Caringly Crafted Distillery, Local Parks |
| Brighouse | A growing market town with a good mix of local amenities and access to countryside walks. Popular for short breaks and family visits. | Brighouse Canal, Crown Flatt Sports Ground, The Elphabha At The Crown, Local restaurants and cafes, Nearby nature reserves |
| Dewsbury | Rich in history and heritage, Dewsbury offers unique attractions and traditional markets. A good location for those interested in local culture. | Dewsbury Minster, The Thornhill Cemetery, Market Place, Dewsbury Town Hall, Local festivals and events |
| Batley | Known for its rich textile history and vibrant community spirit. Offers a diverse range of activities and local attractions. | Dewsbury Moor Golf Club, Batley Wingate Theatre, Local breweries, Shopping areas, Parks and recreation grounds |
| Colne Valley | Scenic valley offering outdoor activities and beautiful landscapes. Ideal for nature lovers and those looking to unwind. | Scammonden Water, Local walking trails, Historical landmarks, Nature reserves, Nearby village pubs |
| Slaithwaite | A picturesque village with a canal running through it. Perfect for those looking for a serene countryside experience close to urban amenities. | Slaithwaite Millenium Green, The Huddersfield Narrow Canal, Local artisan shops, Annual festivals, Nearby hiking paths |
Understanding Airbnb License Requirements & STR Laws in Kirklees (2025)
While Kirklees, England, United Kingdom currently shows low STR regulations, specific Airbnb license requirements might still exist or change. Always verify the latest short term rental regulations and Airbnb license requirements directly with local government authorities for Kirklees to ensure full compliance before hosting.
(Source: AirROI data, 2025, based on 0% licensed listings)
Top Performing Airbnb Properties in Kirklees (2025)
Benchmark your potential! Explore examples of top-performing Airbnb properties in Kirkleesbased on Trailing Twelve Month (TTM) revenue. Analyze their characteristics, revenue, occupancy rate, and ADR to understand what drives success in this market.
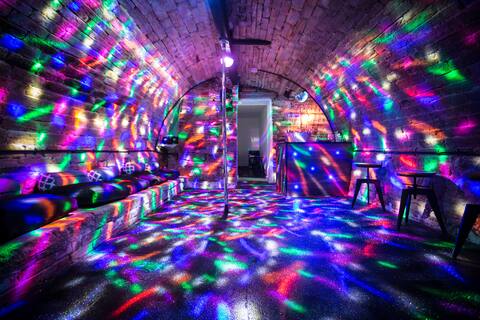
THE ULTIMATE HOLIDAY HOME!
Entire Place • 9 bedrooms
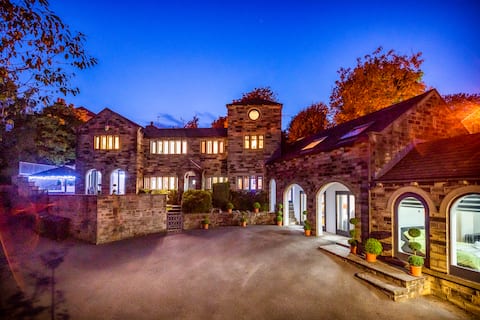
Oaklands Spa Retreat luxury simply stunning
Entire Place • 7 bedrooms
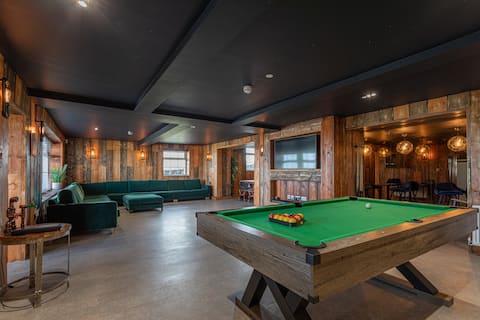
The Moorland
Entire Place • 5 bedrooms
Perfect for large families & luxury pamper stays!
Entire Place • 5 bedrooms

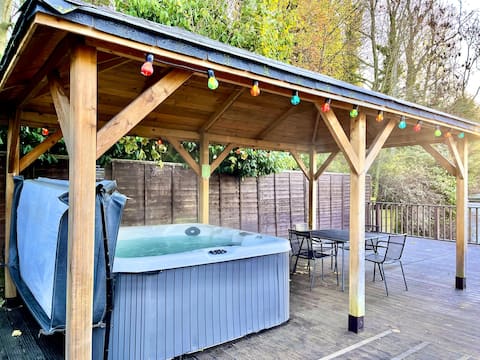
Bradley Manor, Cosy Retreat For Families & Friends
Entire Place • 5 bedrooms
OAK TREE FARM
Entire Place • 6 bedrooms
Note: Performance varies based on location, size, amenities, seasonality, and management quality. Data reflects the past 12 months.
Top Performing Airbnb Hosts in Kirklees (2025)
Learn from the best! This table showcases top-performing Airbnb hosts in Kirklees based on the number of properties managed and estimated total revenue over the past year. Analyze their scale and performance metrics.
| Host Name | Properties | Grossing Revenue | Stay Reviews | Avg Rating |
|---|---|---|---|---|
| Nont | 4 | $504,251 | 160 | 4.81/5.0 |
| Cottages | 15 | $391,617 | 115 | 3.38/5.0 |
| Angela Louise | 6 | $302,809 | 404 | 4.89/5.0 |
| Andrew | 2 | $294,670 | 28 | 4.86/5.0 |
| Modou | 31 | $193,653 | 454 | 3.77/5.0 |
| Infinity | 8 | $137,354 | 113 | 4.56/5.0 |
| Ben | 4 | $129,236 | 250 | 4.88/5.0 |
| Casey | 4 | $118,494 | 118 | 4.93/5.0 |
| Woodsome | 1 | $111,763 | 59 | 4.97/5.0 |
| Meryl | 1 | $109,023 | 29 | 4.90/5.0 |
Analyzing the strategies of top hosts, such as their property selection, pricing, and guest communication, can offer valuable lessons for optimizing your own Airbnb operations in Kirklees.
Dive Deeper: Advanced Kirklees STR Market Data (2025)
Ready to unlock more insights? AirROI provides access to advanced metrics and comprehensive Airbnb data for Kirklees. Explore detailed analytics beyond this report to refine your investment strategy, optimize pricing, and maximize your vacation rental profits.
Explore Advanced MetricsKirklees Short-Term Rental Market Composition (2025): Property & Room Types
Room Type Distribution
Property Type Distribution
Market Composition Insights for Kirklees
- The Kirklees Airbnb market composition is heavily skewed towards Entire Home/Apt listings, which make up 84% of the 437 active rentals. This indicates strong guest preference for privacy and space.
- Looking at the property type distribution in Kirklees, House properties are the most common (56.8%), reflecting the local real estate landscape.
- Houses represent a significant 56.8% portion, catering likely to families or larger groups.
- The presence of 6.6% Hotel/Boutique listings indicates integration with traditional hospitality.
- Smaller segments like others, unique stays, outdoor/unique (combined 7.6%) offer potential for unique stay experiences.
Kirklees Airbnb Room Capacity Analysis (2025): Bedroom Distribution
Distribution of Listings by Number of Bedrooms
Room Capacity Insights for Kirklees
- The dominant room capacity in Kirklees is 1 bedroom listings, making up 44.4% of the market. This suggests a strong demand for properties suitable for couples or solo travelers.
- Together, 1 bedroom and 2 bedrooms properties represent 72.5% of the active Airbnb listings in Kirklees, indicating a high concentration in these sizes.
Kirklees Vacation Rental Guest Capacity Trends (2025)
Distribution of Listings by Guest Capacity
Guest Capacity Insights for Kirklees
- The most common guest capacity trend in Kirklees vacation rentals is listings accommodating 2 guests (35.7%). This suggests the primary traveler segment is likely couples or solo travelers.
- Properties designed for 2 guests and 4 guests dominate the Kirklees STR market, accounting for 56.5% of listings.
- 17.7% of properties accommodate 6+ guests, serving the market segment for larger families or group travel in Kirklees.
- On average, properties in Kirklees are equipped to host 3.4 guests.
Kirklees Airbnb Booking Patterns (2025): Available vs. Booked Days
Available Days Distribution
Booked Days Distribution
Booking Pattern Insights for Kirklees
- The most common availability pattern in Kirklees falls within the 271-366 days range, representing 36.6% of listings. This suggests many properties have significant open periods on their calendars.
- Approximately 66.3% of listings show high availability (181+ days open annually), indicating potential for increased bookings or specific owner usage patterns.
- For booked days, the 91-180 days range is most frequent in Kirklees (31.6%), reflecting common guest stay durations or potential owner blocking patterns.
- A notable 34.1% of properties secure long booking periods (181+ days booked per year), highlighting successful long-term rental strategies or significant owner usage.
Kirklees Airbnb Minimum Stay Requirements Analysis
Distribution of Listings by Minimum Night Requirement
1 Night
137 listings
33.9% of total
2 Nights
140 listings
34.7% of total
3 Nights
47 listings
11.6% of total
4-6 Nights
22 listings
5.4% of total
7-29 Nights
4 listings
1% of total
30+ Nights
54 listings
13.4% of total
Key Insights
- The most prevalent minimum stay requirement in Kirklees is 2 Nights, adopted by 34.7% of listings. This highlights the market's preference for shorter, flexible bookings.
- A strong majority (68.6%) of the Kirklees Airbnb data shows acceptance of very short stays (1-2 nights), indicating a dynamic, high-turnover market.
- A significant segment (13.4%) caters to monthly stays (30+ nights) in Kirklees, pointing to opportunities in the extended-stay market.
Recommendations
- Align with the market by considering a 2 Nights minimum stay, as 34.7% of Kirklees hosts use this setting.
- Explore offering discounts for stays of 30+ nights to attract the 13.4% of the market seeking extended stays.
- Adjust minimum nights based on seasonality – potentially shorter during low season and longer during peak demand periods in Kirklees.
Kirklees Airbnb Cancellation Policy Trends Analysis (2025)
Refundable
17 listings
4.4% of total
Non-refundable
10 listings
2.6% of total
Super Strict 30 Days
4 listings
1% of total
Super Strict 60 Days
14 listings
3.6% of total
Flexible
89 listings
22.8% of total
Moderate
107 listings
27.4% of total
Firm
67 listings
17.2% of total
Strict
82 listings
21% of total
Cancellation Policy Insights for Kirklees
- The prevailing Airbnb cancellation policy trend in Kirklees is Moderate, used by 27.4% of listings.
- There's a relatively balanced mix between guest-friendly (50.2%) and stricter (38.2%) policies, offering choices for different guest needs.
Recommendations for Hosts
- Consider adopting a Moderate policy to align with the 27.4% market standard in Kirklees.
- Regularly review your cancellation policy against competitors and market demand shifts in Kirklees.
Kirklees STR Booking Lead Time Analysis (2025)
Average Booking Lead Time by Month
Booking Lead Time Insights for Kirklees
- The overall average booking lead time for vacation rentals in Kirklees is 54 days.
- Guests book furthest in advance for stays during May (average 79 days), likely coinciding with peak travel demand or local events.
- The shortest booking windows occur for stays in March (average 43 days), indicating more last-minute travel plans during this time.
- Seasonally, Summer (70 days avg.) sees the longest lead times, while Winter (50 days avg.) has the shortest, reflecting typical travel planning cycles.
Recommendations for Hosts
- Use the overall average lead time (54 days) as a baseline for your pricing and availability strategy in Kirklees.
- For May stays, consider implementing length-of-stay discounts or slightly higher rates for bookings made less than 79 days out to capitalize on advance planning.
- Target marketing efforts for the Summer season well in advance (at least 70 days) to capture early planners.
- Monitor your own booking lead times against these Kirklees averages to identify opportunities for dynamic pricing adjustments.
Popular & Essential Airbnb Amenities in Kirklees (2025)
Amenity Prevalence
Amenity Insights for Kirklees
- Essential amenities in Kirklees that guests expect include: Wifi, Heating, Smoke alarm. Lacking these (any) could significantly impact bookings.
- Popular amenities like TV, Kitchen, Hangers are common but not universal. Offering these can provide a competitive edge.
Recommendations for Hosts
- Ensure your listing includes all essential amenities for Kirklees: Wifi, Heating, Smoke alarm.
- Prioritize adding missing essentials: Wifi, Heating, Smoke alarm.
- Consider adding popular differentiators like TV or Kitchen to increase appeal.
- Highlight unique or less common amenities you offer (e.g., hot tub, dedicated workspace, EV charger) in your listing description and photos.
- Regularly check competitor amenities in Kirklees to stay competitive.
Kirklees Airbnb Guest Demographics & Profile Analysis (2025)
Guest Profile Summary for Kirklees
- The typical guest profile for Airbnb in Kirklees consists of primarily domestic travelers (91%), often arriving from nearby England, typically belonging to the Post-2000s (Gen Z/Alpha) group (50%), primarily speaking English or French.
- Domestic travelers account for 91.4% of guests.
- Key international markets include United Kingdom (91.4%) and United States (1.8%).
- Top languages spoken are English (70.6%) followed by French (7.3%).
- A significant demographic segment is the Post-2000s (Gen Z/Alpha) group, representing 50% of guests.
Recommendations for Hosts
- Target domestic marketing efforts towards travelers from England and London.
- Tailor amenities and listing descriptions to appeal to the dominant Post-2000s (Gen Z/Alpha) demographic (e.g., highlight fast WiFi, smart home features, local guides).
- Highlight unique local experiences or amenities relevant to the primary guest profile.
- Consider seasonal promotions aligned with peak travel times for key origin markets.
Nearby Short-Term Rental Market Comparison
How does the Kirklees Airbnb market stack up against its neighbors? Compare key performance metrics like average monthly revenue, ADR, and occupancy rates in surrounding areas to understand the broader regional STR landscape.
| Market | Active Properties | Monthly Revenue | Daily Rate | Avg. Occupancy |
|---|---|---|---|---|
| Grinton | 14 | $5,456 | $365.05 | 51% |
| Cartmel Fell | 17 | $4,719 | $331.68 | 52% |
| Stamford Bridge | 11 | $4,669 | $410.14 | 38% |
| Casterton | 11 | $4,578 | $300.82 | 51% |
| Appleby | 10 | $4,577 | $332.39 | 44% |
| Cark | 11 | $4,540 | $885.21 | 31% |
| Flore | 10 | $4,534 | $347.03 | 40% |
| Craven Arms | 10 | $4,487 | $292.69 | 50% |
| Hayton | 13 | $4,333 | $239.53 | 60% |
| Watermillock | 16 | $4,281 | $274.03 | 50% |