Hyndburn Airbnb Market Analysis 2025: Short Term Rental Data & Vacation Rental Statistics in England, United Kingdom
Is Airbnb profitable in Hyndburn in 2025? Explore comprehensive Airbnb analytics for Hyndburn, England, United Kingdom to uncover income potential. This 2025 STR market report for Hyndburn, based on AirROI data from April 2024 to March 2025, reveals key trends in the niche market of 49 active listings.
Whether you're considering an Airbnb investment in Hyndburn, optimizing your existing vacation rental, or exploring rental arbitrage opportunities, understanding the Hyndburn Airbnb data is crucial. Leveraging the low regulation environment is key to maximizing your short term rental income potential. Let's dive into the specifics.
Key Hyndburn Airbnb Performance Metrics Overview
Monthly Airbnb Revenue Variations & Income Potential in Hyndburn (2025)
Understanding the monthly revenue variations for Airbnb listings in Hyndburn is key to maximizing your short term rental income potential. Seasonality significantly impacts earnings. Our analysis, based on data from the past 12 months, shows that the peak revenue month for STRs in Hyndburn is typically May, while November often presents the lowest earnings, highlighting opportunities for strategic pricing adjustments during shoulder and low seasons. Explore the typical Airbnb income in Hyndburn across different performance tiers:
- Best-in-class properties (Top 10%) achieve $3,595+ monthly, often utilizing dynamic pricing and superior guest experiences.
- Strong performing properties (Top 25%) earn $2,595 or more, indicating effective management and desirable locations/amenities.
- Typical properties (Median) generate around $1,936 per month, representing the average market performance.
- Entry-level properties (Bottom 25%) see earnings around $1,085, often with potential for optimization.
Average Monthly Airbnb Earnings Trend in Hyndburn
Hyndburn Airbnb Occupancy Rate Trends (2025)
Maximize your bookings by understanding the Hyndburn STR occupancy trends. Seasonal demand shifts significantly influence how often properties are booked. Typically, Augustsees the highest demand (peak season occupancy), while March experiences the lowest (low season). Effective strategies, like adjusting minimum stays or offering promotions, can boost occupancy during slower periods. Here's how different property tiers perform in Hyndburn:
- Best-in-class properties (Top 10%) achieve 84%+ occupancy, indicating high desirability and potentially optimized availability.
- Strong performing properties (Top 25%) maintain 71% or higher occupancy, suggesting good market fit and guest satisfaction.
- Typical properties (Median) have an occupancy rate around 48%.
- Entry-level properties (Bottom 25%) average 25% occupancy, potentially facing higher vacancy.
Average Monthly Occupancy Rate Trend in Hyndburn
Average Daily Rate (ADR) Airbnb Trends in Hyndburn (2025)
Effective short term rental pricing strategy in Hyndburn involves understanding monthly ADR fluctuations. The Average Daily Rate (ADR) for Airbnb in Hyndburn typically peaks in December and dips lowest during September. Leveraging Airbnb dynamic pricing tools or strategies based on this seasonality can significantly boost revenue. Here's a look at the typical nightly rates achieved:
- Best-in-class properties (Top 10%) command rates of $263+ per night, often due to premium features or locations.
- Strong performing properties (Top 25%) achieve nightly rates of $155 or more.
- Typical properties (Median) charge around $109 per night.
- Entry-level properties (Bottom 25%) earn around $85 per night.
Average Daily Rate (ADR) Trend by Month in Hyndburn
Get Live Hyndburn Market Intelligence 👇

Explore Real-time Analytics
Airbnb Seasonality Analysis & Trends in Hyndburn (2025)
Peak Season (May, June, July)
- Revenue averages $2,947 per month
- Occupancy rates average 51.2%
- Daily rates average $138
Shoulder Season
- Revenue averages $2,287 per month
- Occupancy maintains around 49.7%
- Daily rates hold near $138
Low Season (February, March, November)
- Revenue drops to average $1,887 per month
- Occupancy decreases to average 44.0%
- Daily rates adjust to average $139
Seasonality Insights for Hyndburn
- The Airbnb seasonality in Hyndburn shows moderate seasonality with distinct peak and low periods. While the sections above show seasonal averages, it's also insightful to look at the extremes:
- During the high season, the absolute peak month showcases Hyndburn's highest earning potential, with monthly revenues capable of climbing to $3,171, occupancy reaching a high of 60.4%, and ADRs peaking at $150.
- Conversely, the slowest single month of the year, typically falling within the low season, marks the market's lowest point. In this month, revenue might dip to $1,883, occupancy could drop to 39.2%, and ADRs may adjust down to $134.
- Understanding both the seasonal averages and these monthly peaks and troughs in revenue, occupancy, and ADR is crucial for maximizing your Airbnb profit potential in Hyndburn.
Seasonal Strategies for Maximizing Profit
- Peak Season: Maximize revenue through premium pricing and potentially longer minimum stays. Ensure high availability.
- Low Season: Offer competitive pricing, special promotions (e.g., extended stay discounts), and flexible cancellation policies. Target off-season travelers like remote workers or budget-conscious guests.
- Shoulder Seasons: Implement dynamic pricing that balances peak and low rates. Target weekend travelers or specific events. Offer slightly more flexible terms than peak season.
- Regularly analyze your own performance against these Hyndburn seasonality benchmarks and adjust your pricing and availability strategy accordingly.
Best Areas for Airbnb Investment in Hyndburn (2025)
Exploring the top neighborhoods for short-term rentals in Hyndburn? This section highlights key areas, outlining why they are attractive for hosts and guests, along with notable local attractions. Consider these locations based on your target guest profile and investment strategy.
| Neighborhood / Area | Why Host Here? (Target Guests & Appeal) | Key Attractions & Landmarks |
|---|---|---|
| Accrington | The largest town in the Hyndburn borough, known for its historic buildings and close-knit community. It's a great place for families and those looking for local amenities while being accessible to larger cities. | Accrington Market, Oak Hill Park, Accrington Stanley Football Club, Church and Oswaldtwistle Cricket Club, The Weavers' Triangle |
| Great Harwood | A charming market town with a rich history and beautiful countryside surroundings. Attracts visitors looking for a peaceful retreat with local charm and amenities. | Great Harwood Park, The Calderstones, Starlings Cafe, Local shops and boutiques, Great Harwood Town Centre |
| Rishton | A small town with a warm community vibe, ideal for those wanting a quieter stay. It's located near beautiful nature parks and walking trails. | Rishton Park, The Peak District, Walking trails, Local eateries, Historic buildings |
| Clayton-le-Moors | Known for its scenic beauty and rich industrial history, this area appeals to those looking for a rural experience while still being close to urban conveniences. | Clayton Green Playing Fields, The River Hyndburn, Local heritage sites, Nature walks, Nearby markets |
| Church | A former mill town with picturesque views and a welcoming community. Great for those interested in local history and nature. | St. James' Church, The Church and Oswaldtwistle, Nature parks, Hyndburn Greenway, Local pubs and restaurants |
| Oswaldtwistle | A town rich in textile history, perfect for culture enthusiasts and families. Offers a range of local amenities and attractions. | Oswaldtwistle Mills, Local heritage walks, Parks, Shopping outlets, Community events |
| Baxenden | A quieter residential area with beautiful views of the countryside. Suitable for those looking to enjoy nature while being near commercial hubs. | Hyndburn Greenway, Baxenden Gardens, Local hiking trails, Community parks, The River Hyndburn |
| Altham | A small village with a quaint atmosphere, ideal for those seeking a serene environment close to the larger towns of Hyndburn. | The Altham Hall, Local countryside, Walking paths, Historic sites, Community events |
Understanding Airbnb License Requirements & STR Laws in Hyndburn (2025)
While Hyndburn, England, United Kingdom currently shows low STR regulations, specific Airbnb license requirements might still exist or change. Always verify the latest short term rental regulations and Airbnb license requirements directly with local government authorities for Hyndburn to ensure full compliance before hosting.
(Source: AirROI data, 2025, finding no licensed listings among those analyzed)
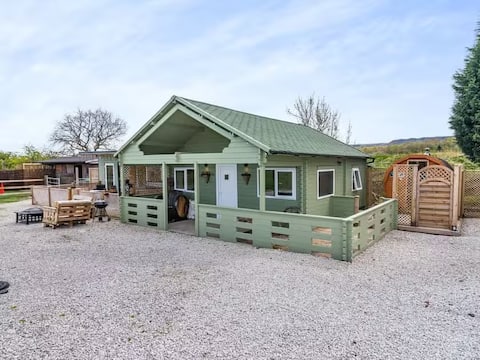
Top Performing Airbnb Properties in Hyndburn (2025)
Benchmark your potential! Explore examples of top-performing Airbnb properties in Hyndburnbased on Trailing Twelve Month (TTM) revenue. Analyze their characteristics, revenue, occupancy rate, and ADR to understand what drives success in this market.

The Octagon, cabin in 2 acres of private woodland.
Entire Place • 4 bedrooms
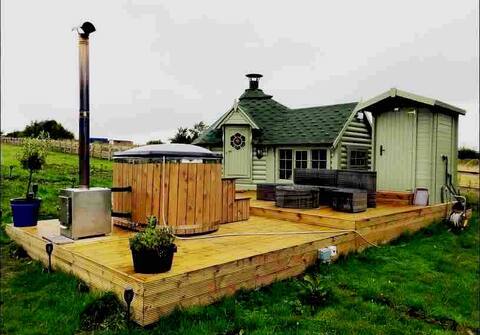
1Bed Cabin Logburner & Wood burner Hot Tub
Entire Place • 1 bedroom
Luxury & Modern Holiday Home
Entire Place • 3 bedrooms

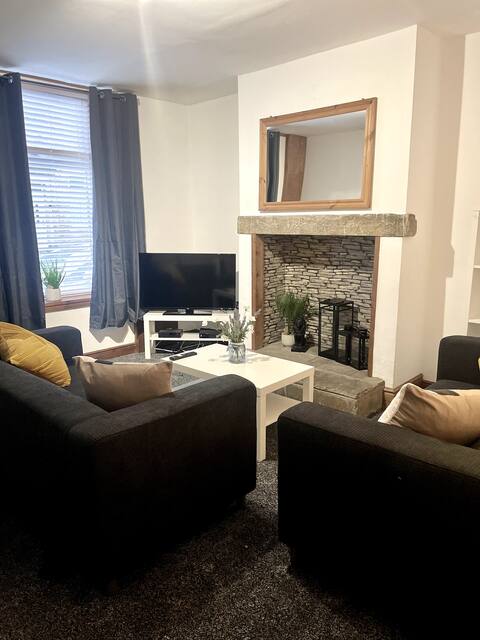
Cosy 2 bed Cottage (EV charger) - 7 Day Discount!
Entire Place • 2 bedrooms
Hobbit Hut Wood Burning Hot Tub BBQ Cozy Ambiance
Entire Place • 1 bedroom
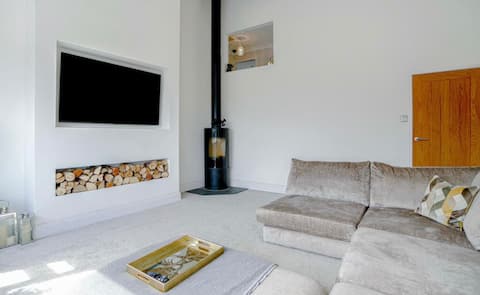
The Home Away From Home
Entire Place • 3 bedrooms
Note: Performance varies based on location, size, amenities, seasonality, and management quality. Data reflects the past 12 months.
Top Performing Airbnb Hosts in Hyndburn (2025)
Learn from the best! This table showcases top-performing Airbnb hosts in Hyndburn based on the number of properties managed and estimated total revenue over the past year. Analyze their scale and performance metrics.
| Host Name | Properties | Grossing Revenue | Stay Reviews | Avg Rating |
|---|---|---|---|---|
| Ian And Donna | 1 | $201,190 | 212 | 4.95/5.0 |
| Maria | 4 | $124,552 | 535 | 4.96/5.0 |
| Ava | 4 | $93,404 | 37 | 4.15/5.0 |
| Alistair | 5 | $78,040 | 93 | 4.64/5.0 |
| Marcus | 2 | $61,171 | 181 | 4.80/5.0 |
| Anne | 3 | $54,916 | 251 | 4.83/5.0 |
| David | 2 | $44,888 | 73 | 4.77/5.0 |
| Chelsey | 1 | $34,630 | 146 | 4.99/5.0 |
| Victoria | 1 | $29,640 | 15 | 4.73/5.0 |
| Lindsay | 1 | $27,719 | 100 | 4.99/5.0 |
Analyzing the strategies of top hosts, such as their property selection, pricing, and guest communication, can offer valuable lessons for optimizing your own Airbnb operations in Hyndburn.
Dive Deeper: Advanced Hyndburn STR Market Data (2025)
Ready to unlock more insights? AirROI provides access to advanced metrics and comprehensive Airbnb data for Hyndburn. Explore detailed analytics beyond this report to refine your investment strategy, optimize pricing, and maximize your vacation rental profits.
Explore Advanced MetricsHyndburn Short-Term Rental Market Composition (2025): Property & Room Types
Room Type Distribution
Property Type Distribution
Market Composition Insights for Hyndburn
- The Hyndburn Airbnb market composition is heavily skewed towards Entire Home/Apt listings, which make up 87.8% of the 49 active rentals. This indicates strong guest preference for privacy and space.
- Looking at the property type distribution in Hyndburn, House properties are the most common (71.4%), reflecting the local real estate landscape.
- Houses represent a significant 71.4% portion, catering likely to families or larger groups.
- Smaller segments like unique stays, others, hotel/boutique (combined 6.0%) offer potential for unique stay experiences.
Hyndburn Airbnb Room Capacity Analysis (2025): Bedroom Distribution
Distribution of Listings by Number of Bedrooms
Room Capacity Insights for Hyndburn
- The dominant room capacity in Hyndburn is 3 bedrooms listings, making up 34.7% of the market. This suggests a strong demand for properties suitable for families or small groups.
- Together, 3 bedrooms and 2 bedrooms properties represent 61.2% of the active Airbnb listings in Hyndburn, indicating a high concentration in these sizes.
- A significant 44.9% of listings offer 3+ bedrooms, catering to larger groups and families seeking more space in Hyndburn.
Hyndburn Vacation Rental Guest Capacity Trends (2025)
Distribution of Listings by Guest Capacity
Guest Capacity Insights for Hyndburn
- The most common guest capacity trend in Hyndburn vacation rentals is listings accommodating 6 guests (32.7%). This suggests the primary traveler segment is likely larger groups.
- Properties designed for 6 guests and 4 guests dominate the Hyndburn STR market, accounting for 49.0% of listings.
- 42.9% of properties accommodate 6+ guests, serving the market segment for larger families or group travel in Hyndburn.
- On average, properties in Hyndburn are equipped to host 4.4 guests.
Hyndburn Airbnb Booking Patterns (2025): Available vs. Booked Days
Available Days Distribution
Booked Days Distribution
Booking Pattern Insights for Hyndburn
- The most common availability pattern in Hyndburn falls within the 271-366 days range, representing 32.7% of listings. This suggests many properties have significant open periods on their calendars.
- Approximately 61.3% of listings show high availability (181+ days open annually), indicating potential for increased bookings or specific owner usage patterns.
- For booked days, the 91-180 days range is most frequent in Hyndburn (30.6%), reflecting common guest stay durations or potential owner blocking patterns.
- A notable 38.7% of properties secure long booking periods (181+ days booked per year), highlighting successful long-term rental strategies or significant owner usage.
Hyndburn Airbnb Minimum Stay Requirements Analysis
Distribution of Listings by Minimum Night Requirement
1 Night
21 listings
47.7% of total
2 Nights
13 listings
29.5% of total
3 Nights
6 listings
13.6% of total
30+ Nights
4 listings
9.1% of total
Key Insights
- The most prevalent minimum stay requirement in Hyndburn is 1 Night, adopted by 47.7% of listings. This highlights the market's preference for shorter, flexible bookings.
- A strong majority (77.2%) of the Hyndburn Airbnb data shows acceptance of very short stays (1-2 nights), indicating a dynamic, high-turnover market.
Recommendations
- Align with the market by considering a 1 Night minimum stay, as 47.7% of Hyndburn hosts use this setting.
- Explore offering discounts for stays of 30+ nights to attract the 9.1% of the market seeking extended stays.
- Adjust minimum nights based on seasonality – potentially shorter during low season and longer during peak demand periods in Hyndburn.
Hyndburn Airbnb Cancellation Policy Trends Analysis (2025)
Flexible
18 listings
43.9% of total
Moderate
8 listings
19.5% of total
Firm
4 listings
9.8% of total
Strict
11 listings
26.8% of total
Cancellation Policy Insights for Hyndburn
- The prevailing Airbnb cancellation policy trend in Hyndburn is Flexible, used by 43.9% of listings.
- There's a relatively balanced mix between guest-friendly (63.4%) and stricter (36.6%) policies, offering choices for different guest needs.
Recommendations for Hosts
- Consider adopting a Flexible policy to align with the 43.9% market standard in Hyndburn.
- Regularly review your cancellation policy against competitors and market demand shifts in Hyndburn.
Hyndburn STR Booking Lead Time Analysis (2025)
Average Booking Lead Time by Month
Booking Lead Time Insights for Hyndburn
- The overall average booking lead time for vacation rentals in Hyndburn is 35 days.
- Guests book furthest in advance for stays during December (average 57 days), likely coinciding with peak travel demand or local events.
- The shortest booking windows occur for stays in October (average 29 days), indicating more last-minute travel plans during this time.
- Seasonally, Summer (48 days avg.) sees the longest lead times, while Fall (34 days avg.) has the shortest, reflecting typical travel planning cycles.
Recommendations for Hosts
- Use the overall average lead time (35 days) as a baseline for your pricing and availability strategy in Hyndburn.
- For December stays, consider implementing length-of-stay discounts or slightly higher rates for bookings made less than 57 days out to capitalize on advance planning.
- Target marketing efforts for the Summer season well in advance (at least 48 days) to capture early planners.
- Monitor your own booking lead times against these Hyndburn averages to identify opportunities for dynamic pricing adjustments.
Popular & Essential Airbnb Amenities in Hyndburn (2025)
Amenity Prevalence
Amenity Insights for Hyndburn
- Essential amenities in Hyndburn that guests expect include: Smoke alarm. Lacking these (this) could significantly impact bookings.
- Popular amenities like Heating, Dishes and silverware, Kitchen are common but not universal. Offering these can provide a competitive edge.
- Warning: Wifi is not universally provided but is considered essential globally. Ensure reliable Wifi is offered.
Recommendations for Hosts
- Ensure your listing includes all essential amenities for Hyndburn: Smoke alarm.
- Prioritize adding missing essentials: Smoke alarm.
- Consider adding popular differentiators like Heating or Dishes and silverware to increase appeal.
- Highlight unique or less common amenities you offer (e.g., hot tub, dedicated workspace, EV charger) in your listing description and photos.
- Regularly check competitor amenities in Hyndburn to stay competitive.
Hyndburn Airbnb Guest Demographics & Profile Analysis (2025)
Guest Profile Summary for Hyndburn
- The typical guest profile for Airbnb in Hyndburn consists of primarily domestic travelers (91%), often arriving from nearby England, typically belonging to the Post-2000s (Gen Z/Alpha) group (50%), primarily speaking English or Spanish.
- Domestic travelers account for 90.6% of guests.
- Key international markets include United Kingdom (90.6%) and Australia (2.8%).
- Top languages spoken are English (69.2%) followed by Spanish (4.2%).
- A significant demographic segment is the Post-2000s (Gen Z/Alpha) group, representing 50% of guests.
Recommendations for Hosts
- Target domestic marketing efforts towards travelers from England and Manchester.
- Tailor amenities and listing descriptions to appeal to the dominant Post-2000s (Gen Z/Alpha) demographic (e.g., highlight fast WiFi, smart home features, local guides).
- Highlight unique local experiences or amenities relevant to the primary guest profile.
- Consider seasonal promotions aligned with peak travel times for key origin markets.
Nearby Short-Term Rental Market Comparison
How does the Hyndburn Airbnb market stack up against its neighbors? Compare key performance metrics like average monthly revenue, ADR, and occupancy rates in surrounding areas to understand the broader regional STR landscape.
| Market | Active Properties | Monthly Revenue | Daily Rate | Avg. Occupancy |
|---|---|---|---|---|
| Grinton | 14 | $5,456 | $365.05 | 51% |
| Cartmel Fell | 17 | $4,719 | $331.68 | 52% |
| Casterton | 11 | $4,578 | $300.82 | 51% |
| Cark | 11 | $4,540 | $885.21 | 31% |
| Flore | 10 | $4,534 | $347.03 | 40% |
| Abbeycwmhir | 10 | $4,502 | $259.18 | 49% |
| Craven Arms | 10 | $4,487 | $292.69 | 50% |
| Eglwys-bach | 16 | $4,413 | $315.23 | 52% |
| Waverton | 16 | $4,358 | $444.20 | 33% |
| Hayton | 13 | $4,333 | $239.53 | 60% |