Hove Airbnb Market Analysis 2025: Short Term Rental Data & Vacation Rental Statistics in England, United Kingdom
Is Airbnb profitable in Hove in 2025? Explore comprehensive Airbnb analytics for Hove, England, United Kingdom to uncover income potential. This 2025 STR market report for Hove, based on AirROI data from April 2024 to March 2025, reveals key trends in the market of 434 active listings.
Whether you're considering an Airbnb investment in Hove, optimizing your existing vacation rental, or exploring rental arbitrage opportunities, understanding the Hove Airbnb data is crucial. Leveraging the low regulation environment is key to maximizing your short term rental income potential. Let's dive into the specifics.
Key Hove Airbnb Performance Metrics Overview
Monthly Airbnb Revenue Variations & Income Potential in Hove (2025)
Understanding the monthly revenue variations for Airbnb listings in Hove is key to maximizing your short term rental income potential. Seasonality significantly impacts earnings. Our analysis, based on data from the past 12 months, shows that the peak revenue month for STRs in Hove is typically July, while February often presents the lowest earnings, highlighting opportunities for strategic pricing adjustments during shoulder and low seasons. Explore the typical Airbnb income in Hove across different performance tiers:
- Best-in-class properties (Top 10%) achieve $6,256+ monthly, often utilizing dynamic pricing and superior guest experiences.
- Strong performing properties (Top 25%) earn $3,794 or more, indicating effective management and desirable locations/amenities.
- Typical properties (Median) generate around $2,243 per month, representing the average market performance.
- Entry-level properties (Bottom 25%) see earnings around $1,114, often with potential for optimization.
Average Monthly Airbnb Earnings Trend in Hove
Hove Airbnb Occupancy Rate Trends (2025)
Maximize your bookings by understanding the Hove STR occupancy trends. Seasonal demand shifts significantly influence how often properties are booked. Typically, Julysees the highest demand (peak season occupancy), while January experiences the lowest (low season). Effective strategies, like adjusting minimum stays or offering promotions, can boost occupancy during slower periods. Here's how different property tiers perform in Hove:
- Best-in-class properties (Top 10%) achieve 85%+ occupancy, indicating high desirability and potentially optimized availability.
- Strong performing properties (Top 25%) maintain 68% or higher occupancy, suggesting good market fit and guest satisfaction.
- Typical properties (Median) have an occupancy rate around 45%.
- Entry-level properties (Bottom 25%) average 23% occupancy, potentially facing higher vacancy.
Average Monthly Occupancy Rate Trend in Hove
Average Daily Rate (ADR) Airbnb Trends in Hove (2025)
Effective short term rental pricing strategy in Hove involves understanding monthly ADR fluctuations. The Average Daily Rate (ADR) for Airbnb in Hove typically peaks in November and dips lowest during March. Leveraging Airbnb dynamic pricing tools or strategies based on this seasonality can significantly boost revenue. Here's a look at the typical nightly rates achieved:
- Best-in-class properties (Top 10%) command rates of $391+ per night, often due to premium features or locations.
- Strong performing properties (Top 25%) achieve nightly rates of $237 or more.
- Typical properties (Median) charge around $152 per night.
- Entry-level properties (Bottom 25%) earn around $103 per night.
Average Daily Rate (ADR) Trend by Month in Hove
Get Live Hove Market Intelligence 👇

Explore Real-time Analytics
Airbnb Seasonality Analysis & Trends in Hove (2025)
Peak Season (July, June, August)
- Revenue averages $4,116 per month
- Occupancy rates average 57.3%
- Daily rates average $212
Shoulder Season
- Revenue averages $2,982 per month
- Occupancy maintains around 45.8%
- Daily rates hold near $210
Low Season (January, February, March)
- Revenue drops to average $1,982 per month
- Occupancy decreases to average 36.0%
- Daily rates adjust to average $203
Seasonality Insights for Hove
- The Airbnb seasonality in Hove shows highly seasonal trends requiring careful strategy. While the sections above show seasonal averages, it's also insightful to look at the extremes:
- During the high season, the absolute peak month showcases Hove's highest earning potential, with monthly revenues capable of climbing to $4,406, occupancy reaching a high of 63.1%, and ADRs peaking at $216.
- Conversely, the slowest single month of the year, typically falling within the low season, marks the market's lowest point. In this month, revenue might dip to $1,857, occupancy could drop to 34.8%, and ADRs may adjust down to $202.
- Understanding both the seasonal averages and these monthly peaks and troughs in revenue, occupancy, and ADR is crucial for maximizing your Airbnb profit potential in Hove.
Seasonal Strategies for Maximizing Profit
- Peak Season: Maximize revenue through premium pricing and potentially longer minimum stays. Ensure high availability.
- Low Season: Offer competitive pricing, special promotions (e.g., extended stay discounts), and flexible cancellation policies. Target off-season travelers like remote workers or budget-conscious guests.
- Shoulder Seasons: Implement dynamic pricing that balances peak and low rates. Target weekend travelers or specific events. Offer slightly more flexible terms than peak season.
- Regularly analyze your own performance against these Hove seasonality benchmarks and adjust your pricing and availability strategy accordingly.
Best Areas for Airbnb Investment in Hove (2025)
Exploring the top neighborhoods for short-term rentals in Hove? This section highlights key areas, outlining why they are attractive for hosts and guests, along with notable local attractions. Consider these locations based on your target guest profile and investment strategy.
| Neighborhood / Area | Why Host Here? (Target Guests & Appeal) | Key Attractions & Landmarks |
|---|---|---|
| Hove Beach | A popular coastal area known for its beautiful pebble beach, attracting tourists during the summer months. It's a great place for water sports, sunbathing, and beach-side cafes. | Hove Lawns, King Alfred Leisure Centre, Hove Museum and Art Gallery, Brighton Marina, Café des Amis, Hove Beach Volleyball |
| Church Road | A vibrant shopping street in Hove, offering a mix of boutique shops, cafes, and restaurants. It's close to the beach and attracts both locals and visitors alike. | George Street, Hove Museum and Art Gallery, Hove Lawns, The Old Market, Local shops and cafes, The Regent |
| Hove Station | A key transport hub providing easy access to Brighton and London, making it attractive for business travelers and those looking to explore the surrounding areas. | Hove Railway Station, Local eateries, Access to Brighton, Centrally located parks, Quiet residential areas |
| Portslade | A charming area just west of Hove, known for its community feel and proximity to the South Downs National Park, appealing to outdoor enthusiasts. | South Downs National Park, Portslade Village, The Old Village, Lovely parks, Local markets, Portslade Railway Station |
| Sussex County Cricket Ground | Home to many sporting events, this area draws sports fans and visitors looking to enjoy cricket matches and other events throughout the year. | County Cricket matches, Sussex Cricket Club, Nearby amenities, Marina attractions, Cafes and restaurants, St. Andrew's Church |
| Western Road | A major thoroughfare lined with shops and restaurants, making it a popular area for visitors who want easy access to dining and retail experiences. | Diverse restaurants, High street shopping, Cafes, Street performances, Cinemas |
| Kingsway | This area offers stunning sea views and is popular with those looking for a quieter beach experience, perfect for relaxation near the coast. | The beach promenade, Scenic views, Nearby parks, Local cafes and pubs, Walking paths |
| Hove Lagoon | A family-friendly area with water sports facilities, playgrounds, and picnic areas. Attracts families and those looking for fun activities by the water. | Hove Lagoon Water Sports, Kids playgrounds, Picnic areas, Scenic spots, Local cafes |
Understanding Airbnb License Requirements & STR Laws in Hove (2025)
While Hove, England, United Kingdom currently shows low STR regulations, specific Airbnb license requirements might still exist or change. Always verify the latest short term rental regulations and Airbnb license requirements directly with local government authorities for Hove to ensure full compliance before hosting.
(Source: AirROI data, 2025, finding no licensed listings among those analyzed)
Top Performing Airbnb Properties in Hove (2025)
Benchmark your potential! Explore examples of top-performing Airbnb properties in Hovebased on Trailing Twelve Month (TTM) revenue. Analyze their characteristics, revenue, occupancy rate, and ADR to understand what drives success in this market.
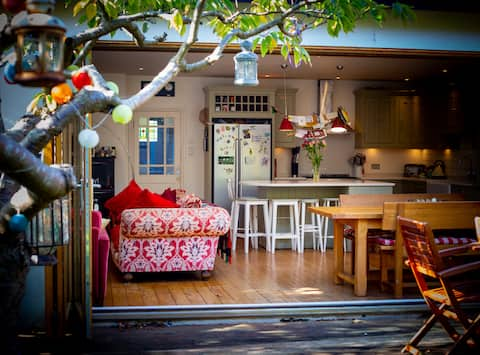
Beautiful, sociable open plan house 5 mins to sea
Entire Place • 4 bedrooms
Vallance House
Entire Place • 5 bedrooms

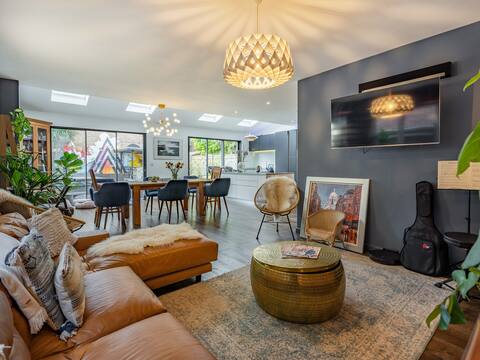
Beautiful Edwardian Home by the Sea
Entire Place • 5 bedrooms
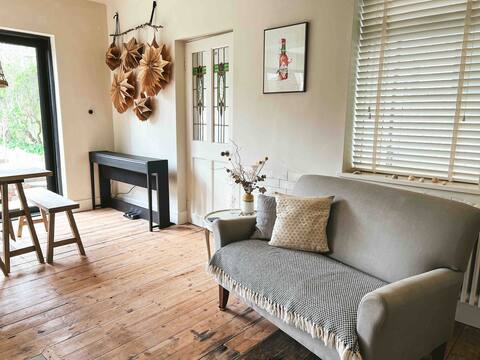
Rustic Family Beach Home|Free Parking|5min 2 Beach
Entire Place • 4 bedrooms
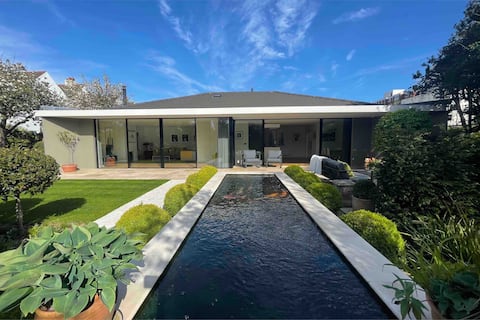
Beautiful modern house 500m from the beach
Entire Place • 3 bedrooms
NEW SEA VIEW 3 bedrooms next to the beach!
Entire Place • 3 bedrooms
Note: Performance varies based on location, size, amenities, seasonality, and management quality. Data reflects the past 12 months.
Top Performing Airbnb Hosts in Hove (2025)
Learn from the best! This table showcases top-performing Airbnb hosts in Hove based on the number of properties managed and estimated total revenue over the past year. Analyze their scale and performance metrics.
| Host Name | Properties | Grossing Revenue | Stay Reviews | Avg Rating |
|---|---|---|---|---|
| My Getaways | 7 | $462,096 | 164 | 4.49/5.0 |
| SoBo House | 13 | $339,021 | 309 | 4.76/5.0 |
| Luke | 8 | $222,913 | 687 | 4.57/5.0 |
| Catherine | 3 | $209,915 | 1206 | 4.92/5.0 |
| Nick | 3 | $195,276 | 146 | 4.91/5.0 |
| Cottages | 1 | $167,202 | 18 | 4.89/5.0 |
| Dale | 5 | $156,033 | 116 | 2.79/5.0 |
| The Ginger Pig | 2 | $151,569 | 17 | 4.86/5.0 |
| Westbeach | 5 | $137,532 | 168 | 2.80/5.0 |
| Joanne | 1 | $136,689 | 127 | 4.93/5.0 |
Analyzing the strategies of top hosts, such as their property selection, pricing, and guest communication, can offer valuable lessons for optimizing your own Airbnb operations in Hove.
Dive Deeper: Advanced Hove STR Market Data (2025)
Ready to unlock more insights? AirROI provides access to advanced metrics and comprehensive Airbnb data for Hove. Explore detailed analytics beyond this report to refine your investment strategy, optimize pricing, and maximize your vacation rental profits.
Explore Advanced MetricsHove Short-Term Rental Market Composition (2025): Property & Room Types
Room Type Distribution
Property Type Distribution
Market Composition Insights for Hove
- The Hove Airbnb market composition is heavily skewed towards Entire Home/Apt listings, which make up 76% of the 434 active rentals. This indicates strong guest preference for privacy and space.
- Looking at the property type distribution in Hove, Apartment/Condo properties are the most common (62.7%), reflecting the local real estate landscape.
- Houses represent a significant 34.3% portion, catering likely to families or larger groups.
- Smaller segments like hotel/boutique, others, outdoor/unique (combined 3.0%) offer potential for unique stay experiences.
Hove Airbnb Room Capacity Analysis (2025): Bedroom Distribution
Distribution of Listings by Number of Bedrooms
Room Capacity Insights for Hove
- The dominant room capacity in Hove is 1 bedroom listings, making up 41% of the market. This suggests a strong demand for properties suitable for couples or solo travelers.
- Together, 1 bedroom and 2 bedrooms properties represent 66.6% of the active Airbnb listings in Hove, indicating a high concentration in these sizes.
Hove Vacation Rental Guest Capacity Trends (2025)
Distribution of Listings by Guest Capacity
Guest Capacity Insights for Hove
- The most common guest capacity trend in Hove vacation rentals is listings accommodating 2 guests (28.3%). This suggests the primary traveler segment is likely couples or solo travelers.
- Properties designed for 2 guests and 4 guests dominate the Hove STR market, accounting for 49.0% of listings.
- 21.4% of properties accommodate 6+ guests, serving the market segment for larger families or group travel in Hove.
- On average, properties in Hove are equipped to host 3.3 guests.
Hove Airbnb Booking Patterns (2025): Available vs. Booked Days
Available Days Distribution
Booked Days Distribution
Booking Pattern Insights for Hove
- The most common availability pattern in Hove falls within the 271-366 days range, representing 35.7% of listings. This suggests many properties have significant open periods on their calendars.
- Approximately 69.3% of listings show high availability (181+ days open annually), indicating potential for increased bookings or specific owner usage patterns.
- For booked days, the 91-180 days range is most frequent in Hove (35.3%), reflecting common guest stay durations or potential owner blocking patterns.
- A notable 31.3% of properties secure long booking periods (181+ days booked per year), highlighting successful long-term rental strategies or significant owner usage.
Hove Airbnb Minimum Stay Requirements Analysis
Distribution of Listings by Minimum Night Requirement
1 Night
89 listings
23.3% of total
2 Nights
149 listings
39% of total
3 Nights
45 listings
11.8% of total
4-6 Nights
23 listings
6% of total
7-29 Nights
20 listings
5.2% of total
30+ Nights
56 listings
14.7% of total
Key Insights
- The most prevalent minimum stay requirement in Hove is 2 Nights, adopted by 39% of listings. This highlights the market's preference for shorter, flexible bookings.
- A strong majority (62.3%) of the Hove Airbnb data shows acceptance of very short stays (1-2 nights), indicating a dynamic, high-turnover market.
- A significant segment (14.7%) caters to monthly stays (30+ nights) in Hove, pointing to opportunities in the extended-stay market.
Recommendations
- Align with the market by considering a 2 Nights minimum stay, as 39% of Hove hosts use this setting.
- If feasible, allowing 1-night stays, especially midweek or during low season, could capture last-minute bookings, as only 23.3% currently do.
- Explore offering discounts for stays of 30+ nights to attract the 14.7% of the market seeking extended stays.
- Adjust minimum nights based on seasonality – potentially shorter during low season and longer during peak demand periods in Hove.
Hove Airbnb Cancellation Policy Trends Analysis (2025)
Super Strict 60 Days
1 listings
0.3% of total
Super Strict 30 Days
3 listings
0.9% of total
Flexible
63 listings
17.9% of total
Moderate
137 listings
39% of total
Firm
74 listings
21.1% of total
Strict
73 listings
20.8% of total
Cancellation Policy Insights for Hove
- The prevailing Airbnb cancellation policy trend in Hove is Moderate, used by 39% of listings.
- There's a relatively balanced mix between guest-friendly (56.9%) and stricter (41.9%) policies, offering choices for different guest needs.
Recommendations for Hosts
- Consider adopting a Moderate policy to align with the 39% market standard in Hove.
- Regularly review your cancellation policy against competitors and market demand shifts in Hove.
Hove STR Booking Lead Time Analysis (2025)
Average Booking Lead Time by Month
Booking Lead Time Insights for Hove
- The overall average booking lead time for vacation rentals in Hove is 55 days.
- Guests book furthest in advance for stays during July (average 82 days), likely coinciding with peak travel demand or local events.
- The shortest booking windows occur for stays in February (average 42 days), indicating more last-minute travel plans during this time.
- Seasonally, Summer (75 days avg.) sees the longest lead times, while Fall (51 days avg.) has the shortest, reflecting typical travel planning cycles.
Recommendations for Hosts
- Use the overall average lead time (55 days) as a baseline for your pricing and availability strategy in Hove.
- For July stays, consider implementing length-of-stay discounts or slightly higher rates for bookings made less than 82 days out to capitalize on advance planning.
- Target marketing efforts for the Summer season well in advance (at least 75 days) to capture early planners.
- Monitor your own booking lead times against these Hove averages to identify opportunities for dynamic pricing adjustments.
Popular & Essential Airbnb Amenities in Hove (2025)
Amenity Prevalence
Amenity Insights for Hove
- Essential amenities in Hove that guests expect include: Wifi, Smoke alarm, Heating. Lacking these (any) could significantly impact bookings.
- Popular amenities like Hot water, Essentials, Kitchen are common but not universal. Offering these can provide a competitive edge.
Recommendations for Hosts
- Ensure your listing includes all essential amenities for Hove: Wifi, Smoke alarm, Heating.
- Prioritize adding missing essentials: Wifi, Smoke alarm, Heating.
- Consider adding popular differentiators like Hot water or Essentials to increase appeal.
- Highlight unique or less common amenities you offer (e.g., hot tub, dedicated workspace, EV charger) in your listing description and photos.
- Regularly check competitor amenities in Hove to stay competitive.
Hove Airbnb Guest Demographics & Profile Analysis (2025)
Guest Profile Summary for Hove
- The typical guest profile for Airbnb in Hove consists of primarily domestic travelers (78%), often arriving from nearby England, typically belonging to the Post-2000s (Gen Z/Alpha) group (50%), primarily speaking English or French.
- Domestic travelers account for 78.1% of guests.
- Key international markets include United Kingdom (78.1%) and United States (3.9%).
- Top languages spoken are English (57.5%) followed by French (10.5%).
- A significant demographic segment is the Post-2000s (Gen Z/Alpha) group, representing 50% of guests.
Recommendations for Hosts
- Target domestic marketing efforts towards travelers from England and London.
- Tailor amenities and listing descriptions to appeal to the dominant Post-2000s (Gen Z/Alpha) demographic (e.g., highlight fast WiFi, smart home features, local guides).
- Highlight unique local experiences or amenities relevant to the primary guest profile.
- Consider seasonal promotions aligned with peak travel times for key origin markets.
Nearby Short-Term Rental Market Comparison
How does the Hove Airbnb market stack up against its neighbors? Compare key performance metrics like average monthly revenue, ADR, and occupancy rates in surrounding areas to understand the broader regional STR landscape.
| Market | Active Properties | Monthly Revenue | Daily Rate | Avg. Occupancy |
|---|---|---|---|---|
| Dorney | 12 | $8,335 | $622.48 | 45% |
| Lambourn | 11 | $6,081 | $669.47 | 28% |
| City of Westminster | 1,327 | $6,043 | $486.66 | 52% |
| La Poterie-Cap-d'Antifer | 11 | $5,076 | $293.95 | 55% |
| Wraysbury | 14 | $4,719 | $396.18 | 46% |
| Old Windsor | 22 | $4,655 | $347.12 | 54% |
| Dinton | 11 | $4,637 | $242.16 | 58% |
| Kintbury | 12 | $4,015 | $250.13 | 54% |
| Nettlestone | 26 | $3,980 | $391.99 | 42% |
| Cotswold District | 1,829 | $3,905 | $362.83 | 44% |