Holt Airbnb Market Analysis 2025: Short Term Rental Data & Vacation Rental Statistics in England, United Kingdom
Is Airbnb profitable in Holt in 2025? Explore comprehensive Airbnb analytics for Holt, England, United Kingdom to uncover income potential. This 2025 STR market report for Holt, based on AirROI data from April 2024 to March 2025, reveals key trends in the niche market of 21 active listings.
Whether you're considering an Airbnb investment in Holt, optimizing your existing vacation rental, or exploring rental arbitrage opportunities, understanding the Holt Airbnb data is crucial. Leveraging the low regulation environment is key to maximizing your short term rental income potential. Let's dive into the specifics.
Key Holt Airbnb Performance Metrics Overview
Monthly Airbnb Revenue Variations & Income Potential in Holt (2025)
Understanding the monthly revenue variations for Airbnb listings in Holt is key to maximizing your short term rental income potential. Seasonality significantly impacts earnings. Our analysis, based on data from the past 12 months, shows that the peak revenue month for STRs in Holt is typically August, while January often presents the lowest earnings, highlighting opportunities for strategic pricing adjustments during shoulder and low seasons. Explore the typical Airbnb income in Holt across different performance tiers:
- Best-in-class properties (Top 10%) achieve $5,609+ monthly, often utilizing dynamic pricing and superior guest experiences.
- Strong performing properties (Top 25%) earn $3,515 or more, indicating effective management and desirable locations/amenities.
- Typical properties (Median) generate around $2,245 per month, representing the average market performance.
- Entry-level properties (Bottom 25%) see earnings around $1,060, often with potential for optimization.
Average Monthly Airbnb Earnings Trend in Holt
Holt Airbnb Occupancy Rate Trends (2025)
Maximize your bookings by understanding the Holt STR occupancy trends. Seasonal demand shifts significantly influence how often properties are booked. Typically, Augustsees the highest demand (peak season occupancy), while January experiences the lowest (low season). Effective strategies, like adjusting minimum stays or offering promotions, can boost occupancy during slower periods. Here's how different property tiers perform in Holt:
- Best-in-class properties (Top 10%) achieve 85%+ occupancy, indicating high desirability and potentially optimized availability.
- Strong performing properties (Top 25%) maintain 71% or higher occupancy, suggesting good market fit and guest satisfaction.
- Typical properties (Median) have an occupancy rate around 52%.
- Entry-level properties (Bottom 25%) average 23% occupancy, potentially facing higher vacancy.
Average Monthly Occupancy Rate Trend in Holt
Average Daily Rate (ADR) Airbnb Trends in Holt (2025)
Effective short term rental pricing strategy in Holt involves understanding monthly ADR fluctuations. The Average Daily Rate (ADR) for Airbnb in Holt typically peaks in December and dips lowest during April. Leveraging Airbnb dynamic pricing tools or strategies based on this seasonality can significantly boost revenue. Here's a look at the typical nightly rates achieved:
- Best-in-class properties (Top 10%) command rates of $249+ per night, often due to premium features or locations.
- Strong performing properties (Top 25%) achieve nightly rates of $180 or more.
- Typical properties (Median) charge around $144 per night.
- Entry-level properties (Bottom 25%) earn around $96 per night.
Average Daily Rate (ADR) Trend by Month in Holt
Get Live Holt Market Intelligence 👇

Explore Real-time Analytics
Airbnb Seasonality Analysis & Trends in Holt (2025)
Peak Season (August, July, April)
- Revenue averages $3,108 per month
- Occupancy rates average 57.0%
- Daily rates average $158
Shoulder Season
- Revenue averages $2,752 per month
- Occupancy maintains around 51.1%
- Daily rates hold near $158
Low Season (January, February, November)
- Revenue drops to average $2,017 per month
- Occupancy decreases to average 40.2%
- Daily rates adjust to average $158
Seasonality Insights for Holt
- The Airbnb seasonality in Holt shows moderate seasonality with distinct peak and low periods. While the sections above show seasonal averages, it's also insightful to look at the extremes:
- During the high season, the absolute peak month showcases Holt's highest earning potential, with monthly revenues capable of climbing to $3,312, occupancy reaching a high of 62.7%, and ADRs peaking at $164.
- Conversely, the slowest single month of the year, typically falling within the low season, marks the market's lowest point. In this month, revenue might dip to $1,749, occupancy could drop to 36.6%, and ADRs may adjust down to $155.
- Understanding both the seasonal averages and these monthly peaks and troughs in revenue, occupancy, and ADR is crucial for maximizing your Airbnb profit potential in Holt.
Seasonal Strategies for Maximizing Profit
- Peak Season: Maximize revenue through premium pricing and potentially longer minimum stays. Ensure high availability.
- Low Season: Offer competitive pricing, special promotions (e.g., extended stay discounts), and flexible cancellation policies. Target off-season travelers like remote workers or budget-conscious guests.
- Shoulder Seasons: Implement dynamic pricing that balances peak and low rates. Target weekend travelers or specific events. Offer slightly more flexible terms than peak season.
- Regularly analyze your own performance against these Holt seasonality benchmarks and adjust your pricing and availability strategy accordingly.
Best Areas for Airbnb Investment in Holt (2025)
Exploring the top neighborhoods for short-term rentals in Holt? This section highlights key areas, outlining why they are attractive for hosts and guests, along with notable local attractions. Consider these locations based on your target guest profile and investment strategy.
| Neighborhood / Area | Why Host Here? (Target Guests & Appeal) | Key Attractions & Landmarks |
|---|---|---|
| Holt Town Centre | The heart of Holt with charming shops, cafes, and historical significance. Attracts visitors looking for a quintessential English market town experience with easy access to local amenities. | Holt Market Place, The Holt Country Park, St. Andrew's Church, Gresham's School, Holt Owl Trail |
| Cromer | Famous for its sandy beaches and Victorian pier, Cromer offers coastal charm and is a popular holiday destination, drawing families and tourists seeking seaside relaxation. | Cromer Pier, Cromer Beach, RNLI Henry Blogg Museum, Cromer Golf Club, North Norfolk Railway |
| Sheringham | A picturesque seaside town with beautiful beaches and a scenic railway. Ideal for visitors who enjoy outdoor activities and coastal walks. | Sheringham Beach, North Norfolk Railway, Sheringham Park, The Mo Museum, Sheringham Little Theatre |
| Blakeney | A quaint coastal village known for its stunning natural beauty and wildlife. Perfect for those interested in nature and exploring the Norfolk coast. | Blakeney National Nature Reserve, Blakeney Point, St. Nicholas' Church, Blakeney Harbour, The Blakeney Hotel |
| Wiveton | A small village close to famous attractions like Blakeney and the North Norfolk coast, appealing for visitors seeking a quiet retreat near nature. | Wiveton Hall, Wiveton Downs, St. Mary's Church, Cley Marshes, Nearby Beaches |
| Fakenham | Home to Fakenham Racecourse and close to local attractions, making it appealing for tourists looking for entertainment and leisure activities. | Fakenham Racecourse, Fakenham Museum of Gas and Local History, Fakenham Golf Club, Langham Glass, River Wensum |
| Burnham Market | A charming village with boutique shops and a lively atmosphere. Popular with tourists looking for unique shopping experiences and local cuisine. | Burnham Market Village Green, The Hoste, Local Art Galleries, Burnham Overy Staithe, Nearby Beaches |
| Norwich | The vibrant city with rich history, architecture, and cultural attractions. Ideal for those wanting to explore urban life along with historical elements within Norfolk. | Norwich Cathedral, Norwich Castle, The Forum, Elm Hill, Eaton Park |
Understanding Airbnb License Requirements & STR Laws in Holt (2025)
While Holt, England, United Kingdom currently shows low STR regulations, specific Airbnb license requirements might still exist or change. Always verify the latest short term rental regulations and Airbnb license requirements directly with local government authorities for Holt to ensure full compliance before hosting.
(Source: AirROI data, 2025, finding no licensed listings among those analyzed)
Top Performing Airbnb Properties in Holt (2025)
Benchmark your potential! Explore examples of top-performing Airbnb properties in Holtbased on Trailing Twelve Month (TTM) revenue. Analyze their characteristics, revenue, occupancy rate, and ADR to understand what drives success in this market.
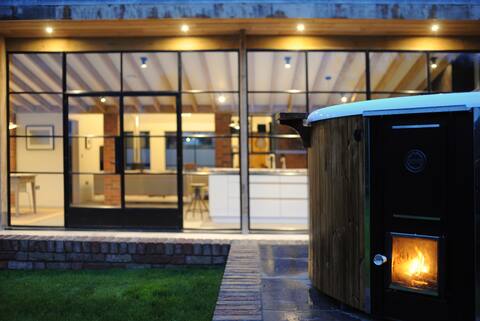
Artist's Retreat - Style, tennis and hot-tub for 4
Entire Place • 2 bedrooms
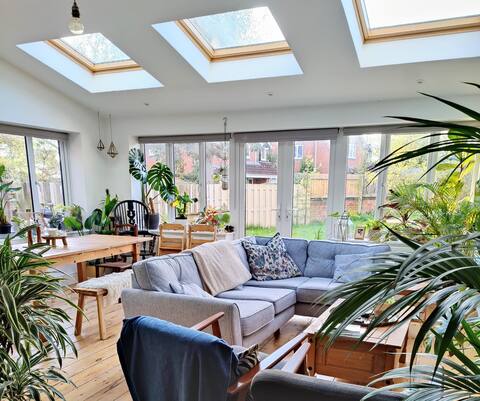
Country home in Wiltshire
Entire Place • 3 bedrooms
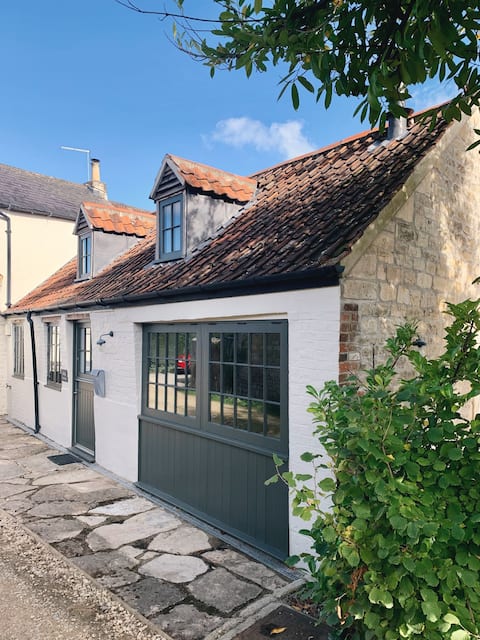
Cosy one bedroom barn conversion
Entire Place • 1 bedroom
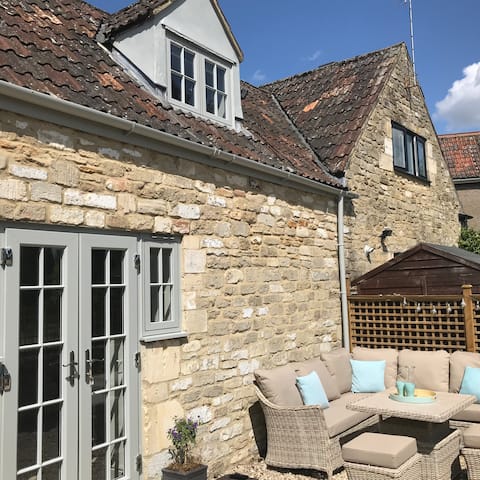
Stables - village charm, fresh air & near Bath
Entire Place • 1 bedroom

Delightful Garden Cottage, Holt, Bradford on Avon
Entire Place • 2 bedrooms

The Mews, Holt. near Bath EV charger & parking
Entire Place • 1 bedroom
Note: Performance varies based on location, size, amenities, seasonality, and management quality. Data reflects the past 12 months.
Top Performing Airbnb Hosts in Holt (2025)
Learn from the best! This table showcases top-performing Airbnb hosts in Holt based on the number of properties managed and estimated total revenue over the past year. Analyze their scale and performance metrics.
| Host Name | Properties | Grossing Revenue | Stay Reviews | Avg Rating |
|---|---|---|---|---|
| Kate | 1 | $84,916 | 151 | 4.99/5.0 |
| Annika | 1 | $48,999 | 11 | 5.00/5.0 |
| Jessica | 1 | $44,912 | 154 | 4.99/5.0 |
| Deborah | 2 | $42,880 | 225 | 4.96/5.0 |
| Ray And Katy | 1 | $41,311 | 290 | 4.94/5.0 |
| Claire | 1 | $36,285 | 103 | 4.98/5.0 |
| Jo | 1 | $34,701 | 507 | 4.94/5.0 |
| Laura | 1 | $34,583 | 31 | 4.81/5.0 |
| Julie | 1 | $34,324 | 13 | 4.92/5.0 |
| Gary | 1 | $31,367 | 73 | 4.97/5.0 |
Analyzing the strategies of top hosts, such as their property selection, pricing, and guest communication, can offer valuable lessons for optimizing your own Airbnb operations in Holt.
Dive Deeper: Advanced Holt STR Market Data (2025)
Ready to unlock more insights? AirROI provides access to advanced metrics and comprehensive Airbnb data for Holt. Explore detailed analytics beyond this report to refine your investment strategy, optimize pricing, and maximize your vacation rental profits.
Explore Advanced MetricsHolt Short-Term Rental Market Composition (2025): Property & Room Types
Room Type Distribution
Property Type Distribution
Market Composition Insights for Holt
- The Holt Airbnb market composition is heavily skewed towards Entire Home/Apt listings, which make up 85.7% of the 21 active rentals. This indicates strong guest preference for privacy and space.
- Looking at the property type distribution in Holt, House properties are the most common (57.1%), reflecting the local real estate landscape.
- Houses represent a significant 57.1% portion, catering likely to families or larger groups.
- The presence of 19% Hotel/Boutique listings indicates integration with traditional hospitality.
- Smaller segments like outdoor/unique (combined 4.8%) offer potential for unique stay experiences.
Holt Airbnb Room Capacity Analysis (2025): Bedroom Distribution
Distribution of Listings by Number of Bedrooms
Room Capacity Insights for Holt
- The dominant room capacity in Holt is 1 bedroom listings, making up 42.9% of the market. This suggests a strong demand for properties suitable for couples or solo travelers.
- Together, 1 bedroom and 2 bedrooms properties represent 71.5% of the active Airbnb listings in Holt, indicating a high concentration in these sizes.
- Listings with 3+ bedrooms (9.5%) represent a smaller niche, potentially indicating an underserved market for larger group accommodations in Holt.
Holt Vacation Rental Guest Capacity Trends (2025)
Distribution of Listings by Guest Capacity
Guest Capacity Insights for Holt
- The most common guest capacity trend in Holt vacation rentals is listings accommodating 2 guests (28.6%). This suggests the primary traveler segment is likely couples or solo travelers.
- Properties designed for 2 guests and 4 guests dominate the Holt STR market, accounting for 47.6% of listings.
- On average, properties in Holt are equipped to host 3.0 guests.
Holt Airbnb Booking Patterns (2025): Available vs. Booked Days
Available Days Distribution
Booked Days Distribution
Booking Pattern Insights for Holt
- The most common availability pattern in Holt falls within the 91-180 days range, representing 33.3% of listings. This suggests many properties have significant open periods on their calendars.
- Approximately 52.4% of listings show high availability (181+ days open annually), indicating potential for increased bookings or specific owner usage patterns.
- For booked days, the 181-270 days range is most frequent in Holt (33.3%), reflecting common guest stay durations or potential owner blocking patterns.
- A notable 47.6% of properties secure long booking periods (181+ days booked per year), highlighting successful long-term rental strategies or significant owner usage.
Holt Airbnb Minimum Stay Requirements Analysis
Distribution of Listings by Minimum Night Requirement
1 Night
4 listings
19% of total
2 Nights
9 listings
42.9% of total
3 Nights
4 listings
19% of total
30+ Nights
4 listings
19% of total
Key Insights
- The most prevalent minimum stay requirement in Holt is 2 Nights, adopted by 42.9% of listings. This highlights the market's preference for shorter, flexible bookings.
- A strong majority (61.9%) of the Holt Airbnb data shows acceptance of very short stays (1-2 nights), indicating a dynamic, high-turnover market.
- A significant segment (19%) caters to monthly stays (30+ nights) in Holt, pointing to opportunities in the extended-stay market.
Recommendations
- Align with the market by considering a 2 Nights minimum stay, as 42.9% of Holt hosts use this setting.
- If feasible, allowing 1-night stays, especially midweek or during low season, could capture last-minute bookings, as only 19% currently do.
- A 2-night minimum appears standard (42.9%). Consider this for weekends or peak periods.
- Explore offering discounts for stays of 30+ nights to attract the 19% of the market seeking extended stays.
- Adjust minimum nights based on seasonality – potentially shorter during low season and longer during peak demand periods in Holt.
Holt Airbnb Cancellation Policy Trends Analysis (2025)
Flexible
6 listings
28.6% of total
Moderate
10 listings
47.6% of total
Firm
3 listings
14.3% of total
Strict
2 listings
9.5% of total
Cancellation Policy Insights for Holt
- The prevailing Airbnb cancellation policy trend in Holt is Moderate, used by 47.6% of listings.
- The market strongly favors guest-friendly terms, with 76.2% of listings offering Flexible or Moderate policies. This suggests guests in Holt may expect booking flexibility.
- Strict cancellation policies are quite rare (9.5%), potentially making listings with this policy less competitive unless justified by high demand or property type.
Recommendations for Hosts
- Consider adopting a Moderate policy to align with the 47.6% market standard in Holt.
- Using a Strict policy might deter some guests, as only 9.5% of listings use it. Evaluate if potential revenue protection outweighs possible lower booking rates.
- Regularly review your cancellation policy against competitors and market demand shifts in Holt.
Holt STR Booking Lead Time Analysis (2025)
Average Booking Lead Time by Month
Booking Lead Time Insights for Holt
- The overall average booking lead time for vacation rentals in Holt is 41 days.
- Guests book furthest in advance for stays during May (average 67 days), likely coinciding with peak travel demand or local events.
- The shortest booking windows occur for stays in February (average 19 days), indicating more last-minute travel plans during this time.
- Seasonally, Summer (45 days avg.) sees the longest lead times, while Winter (37 days avg.) has the shortest, reflecting typical travel planning cycles.
Recommendations for Hosts
- Use the overall average lead time (41 days) as a baseline for your pricing and availability strategy in Holt.
- For May stays, consider implementing length-of-stay discounts or slightly higher rates for bookings made less than 67 days out to capitalize on advance planning.
- Target marketing efforts for the Summer season well in advance (at least 45 days) to capture early planners.
- Monitor your own booking lead times against these Holt averages to identify opportunities for dynamic pricing adjustments.
Popular & Essential Airbnb Amenities in Holt (2025)
Amenity Prevalence
Amenity Insights for Holt
- Popular amenities like Free parking on premises, Smoke alarm, Wifi are common but not universal. Offering these can provide a competitive edge.
- Warning: Wifi is not universally provided but is considered essential globally. Ensure reliable Wifi is offered.
Recommendations for Hosts
- Consider adding popular differentiators like Free parking on premises or Smoke alarm to increase appeal.
- Highlight unique or less common amenities you offer (e.g., hot tub, dedicated workspace, EV charger) in your listing description and photos.
- Regularly check competitor amenities in Holt to stay competitive.
Holt Airbnb Guest Demographics & Profile Analysis (2025)
Guest Profile Summary for Holt
- The typical guest profile for Airbnb in Holt consists of primarily domestic travelers (87%), often arriving from nearby England, typically belonging to the Post-2000s (Gen Z/Alpha) group (50%), primarily speaking English or French.
- Domestic travelers account for 86.6% of guests.
- Key international markets include United Kingdom (86.6%) and United States (3.5%).
- Top languages spoken are English (71.6%) followed by French (8.1%).
- A significant demographic segment is the Post-2000s (Gen Z/Alpha) group, representing 50% of guests.
Recommendations for Hosts
- Target domestic marketing efforts towards travelers from England and London.
- Tailor amenities and listing descriptions to appeal to the dominant Post-2000s (Gen Z/Alpha) demographic (e.g., highlight fast WiFi, smart home features, local guides).
- Highlight unique local experiences or amenities relevant to the primary guest profile.
- Consider seasonal promotions aligned with peak travel times for key origin markets.
Nearby Short-Term Rental Market Comparison
How does the Holt Airbnb market stack up against its neighbors? Compare key performance metrics like average monthly revenue, ADR, and occupancy rates in surrounding areas to understand the broader regional STR landscape.
| Market | Active Properties | Monthly Revenue | Daily Rate | Avg. Occupancy |
|---|---|---|---|---|
| Englishcombe | 13 | $8,558 | $573.69 | 49% |
| Chew Magna | 14 | $6,649 | $399.59 | 46% |
| Lambourn | 11 | $6,081 | $669.47 | 28% |
| Long Sutton | 17 | $5,726 | $383.88 | 46% |
| Stoke St. Michael | 10 | $5,277 | $424.04 | 42% |
| Winsham | 10 | $5,154 | $484.22 | 52% |
| Oldland Common | 13 | $5,093 | $355.47 | 43% |
| Crai | 20 | $4,799 | $371.85 | 46% |
| Dinton | 11 | $4,637 | $242.16 | 58% |
| Limpley Stoke | 10 | $4,598 | $523.47 | 52% |