Higher Crackington Airbnb Market Analysis 2025: Short Term Rental Data & Vacation Rental Statistics in England, United Kingdom
Is Airbnb profitable in Higher Crackington in 2025? Explore comprehensive Airbnb analytics for Higher Crackington, England, United Kingdom to uncover income potential. This 2025 STR market report for Higher Crackington, based on AirROI data from April 2024 to March 2025, reveals key trends in the niche market of 17 active listings.
Whether you're considering an Airbnb investment in Higher Crackington, optimizing your existing vacation rental, or exploring rental arbitrage opportunities, understanding the Higher Crackington Airbnb data is crucial. Leveraging the low regulation environment is key to maximizing your short term rental income potential. Let's dive into the specifics.
Key Higher Crackington Airbnb Performance Metrics Overview
Monthly Airbnb Revenue Variations & Income Potential in Higher Crackington (2025)
Understanding the monthly revenue variations for Airbnb listings in Higher Crackington is key to maximizing your short term rental income potential. Seasonality significantly impacts earnings. Our analysis, based on data from the past 12 months, shows that the peak revenue month for STRs in Higher Crackington is typically May, while January often presents the lowest earnings, highlighting opportunities for strategic pricing adjustments during shoulder and low seasons. Explore the typical Airbnb income in Higher Crackington across different performance tiers:
- Best-in-class properties (Top 10%) achieve $10,395+ monthly, often utilizing dynamic pricing and superior guest experiences.
- Strong performing properties (Top 25%) earn $4,949 or more, indicating effective management and desirable locations/amenities.
- Typical properties (Median) generate around $2,982 per month, representing the average market performance.
- Entry-level properties (Bottom 25%) see earnings around $1,030, often with potential for optimization.
Average Monthly Airbnb Earnings Trend in Higher Crackington
Higher Crackington Airbnb Occupancy Rate Trends (2025)
Maximize your bookings by understanding the Higher Crackington STR occupancy trends. Seasonal demand shifts significantly influence how often properties are booked. Typically, Augustsees the highest demand (peak season occupancy), while January experiences the lowest (low season). Effective strategies, like adjusting minimum stays or offering promotions, can boost occupancy during slower periods. Here's how different property tiers perform in Higher Crackington:
- Best-in-class properties (Top 10%) achieve 69%+ occupancy, indicating high desirability and potentially optimized availability.
- Strong performing properties (Top 25%) maintain 52% or higher occupancy, suggesting good market fit and guest satisfaction.
- Typical properties (Median) have an occupancy rate around 34%.
- Entry-level properties (Bottom 25%) average 18% occupancy, potentially facing higher vacancy.
Average Monthly Occupancy Rate Trend in Higher Crackington
Average Daily Rate (ADR) Airbnb Trends in Higher Crackington (2025)
Effective short term rental pricing strategy in Higher Crackington involves understanding monthly ADR fluctuations. The Average Daily Rate (ADR) for Airbnb in Higher Crackington typically peaks in November and dips lowest during August. Leveraging Airbnb dynamic pricing tools or strategies based on this seasonality can significantly boost revenue. Here's a look at the typical nightly rates achieved:
- Best-in-class properties (Top 10%) command rates of $512+ per night, often due to premium features or locations.
- Strong performing properties (Top 25%) achieve nightly rates of $322 or more.
- Typical properties (Median) charge around $187 per night.
- Entry-level properties (Bottom 25%) earn around $144 per night.
Average Daily Rate (ADR) Trend by Month in Higher Crackington
Get Live Higher Crackington Market Intelligence 👇

Explore Real-time Analytics
Airbnb Seasonality Analysis & Trends in Higher Crackington (2025)
Peak Season (May, August, October)
- Revenue averages $5,132 per month
- Occupancy rates average 42.9%
- Daily rates average $285
Shoulder Season
- Revenue averages $4,448 per month
- Occupancy maintains around 40.3%
- Daily rates hold near $310
Low Season (January, February, December)
- Revenue drops to average $2,969 per month
- Occupancy decreases to average 28.5%
- Daily rates adjust to average $314
Seasonality Insights for Higher Crackington
- The Airbnb seasonality in Higher Crackington shows moderate seasonality with distinct peak and low periods. While the sections above show seasonal averages, it's also insightful to look at the extremes:
- During the high season, the absolute peak month showcases Higher Crackington's highest earning potential, with monthly revenues capable of climbing to $5,366, occupancy reaching a high of 55.5%, and ADRs peaking at $360.
- Conversely, the slowest single month of the year, typically falling within the low season, marks the market's lowest point. In this month, revenue might dip to $2,577, occupancy could drop to 24.5%, and ADRs may adjust down to $252.
- Understanding both the seasonal averages and these monthly peaks and troughs in revenue, occupancy, and ADR is crucial for maximizing your Airbnb profit potential in Higher Crackington.
Seasonal Strategies for Maximizing Profit
- Peak Season: Maximize revenue through premium pricing and potentially longer minimum stays. Ensure high availability.
- Low Season: Offer competitive pricing, special promotions (e.g., extended stay discounts), and flexible cancellation policies. Target off-season travelers like remote workers or budget-conscious guests.
- Shoulder Seasons: Implement dynamic pricing that balances peak and low rates. Target weekend travelers or specific events. Offer slightly more flexible terms than peak season.
- Regularly analyze your own performance against these Higher Crackington seasonality benchmarks and adjust your pricing and availability strategy accordingly.
Best Areas for Airbnb Investment in Higher Crackington (2025)
Exploring the top neighborhoods for short-term rentals in Higher Crackington? This section highlights key areas, outlining why they are attractive for hosts and guests, along with notable local attractions. Consider these locations based on your target guest profile and investment strategy.
| Neighborhood / Area | Why Host Here? (Target Guests & Appeal) | Key Attractions & Landmarks |
|---|---|---|
| Crackington Haven | A charming coastal village with stunning beach access and a family-friendly atmosphere, making it popular for vacationers seeking relaxation and outdoor activities. | Crackington Haven Beach, Coastal hiking paths, Local cafes and shops, Rock pooling and tide pools, The Mill House Inn |
| St Gennys | A picturesque rural village offering a tranquil retreat, ideal for those who enjoy exploring the surrounding countryside and coastline. | St Gennys Church, Wildlife and nature walks, Nearby cliffs and beaches, Peaceful countryside, Access to the South West Coast Path |
| Boscastle | A historic fishing village with stunning cliffs and association with folklore, attracting visitors interested in heritage, scenic views, and maritime history. | Boscastle Harbour, The Museum of Witchcraft and Magic, Clifftop walks, The Old Mill, Boscastle to Minster Church walk |
| Bude | A popular seaside resort town known for its beautiful beaches and surfing, combining a lively atmosphere with family-friendly activities and amenities. | Bude Sea Pool, Summerleaze Beach, Crooklets Beach, Bude Castle, Widemouth Bay |
| Tintagel | Famous for its links to the King Arthur legend and stunning castle ruins, Tintagel attracts tourists interested in history and mythology, along with beautiful coastal scenery. | Tintagel Castle, Merlin's Cave, King Arthur's Great Halls, Tintagel Old Post Office, St. Materiana's Church |
| Widemouth Bay | A scenic beach area ideal for surfers and families, offering a laid-back vibe and abundant recreational activities in a stunning coastal setting. | Widemouth Beach, Surf schools, Coastal walks, Beachfront cafes, Nature reserves |
| North Cornish Coast | Known for its rugged landscapes and hidden coves, this area is perfect for outdoor enthusiasts and those looking to escape into nature. | Surfing and beach activities, Walking trails, Stunning coastal views, Wildlife spotting, Local pubs and restaurants |
| Launceston | A historic market town with rich heritage, featuring local attractions, shops, and easy access to both countryside and coastal areas, appealing for varied interests. | Launceston Castle, Lawrence House Museum, Local markets, River Kensey walks, The South West Coast Path |
Understanding Airbnb License Requirements & STR Laws in Higher Crackington (2025)
While Higher Crackington, England, United Kingdom currently shows low STR regulations, specific Airbnb license requirements might still exist or change. Always verify the latest short term rental regulations and Airbnb license requirements directly with local government authorities for Higher Crackington to ensure full compliance before hosting.
(Source: AirROI data, 2025, finding no licensed listings among those analyzed)
Top Performing Airbnb Properties in Higher Crackington (2025)
Benchmark your potential! Explore examples of top-performing Airbnb properties in Higher Crackingtonbased on Trailing Twelve Month (TTM) revenue. Analyze their characteristics, revenue, occupancy rate, and ADR to understand what drives success in this market.
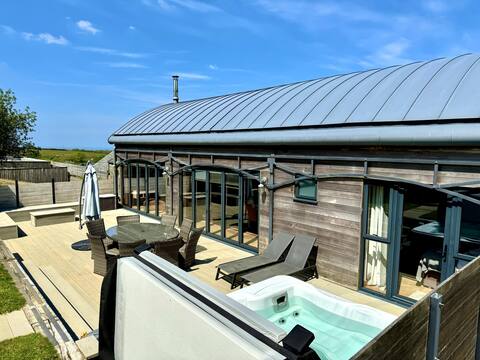
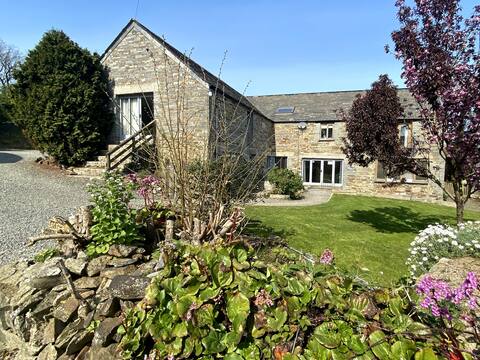
Luxury Dutch barn | Hot Tub | Alpacas | Near Beach
Entire Place • 4 bedrooms
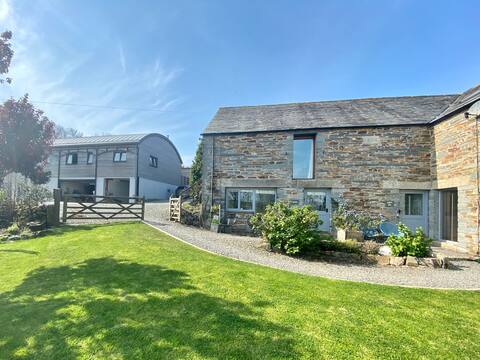
Skyber | Farm | Alpacas | Wi-Fi | Near the sea
Entire Place • 3 bedrooms
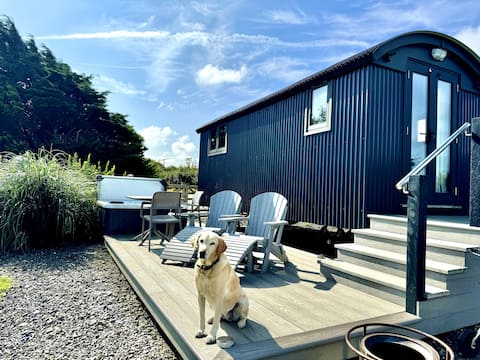
Cambeak Shepherds hut | Hot tub | Alpacas
Entire Place • 1 bedroom
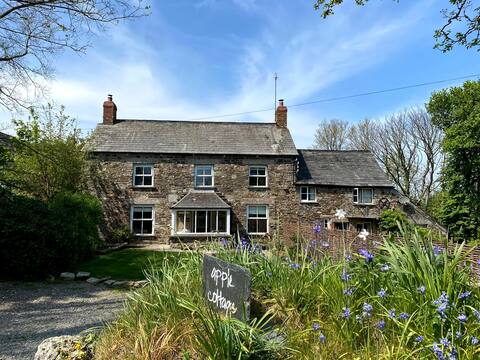
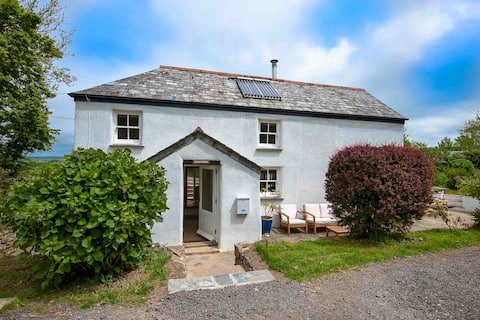
Lovely coastal home with hot tub, dogs welcome
Entire Place • 4 bedrooms
Darzona | Near the sea | Superking | EV Charger
Entire Place • 1 bedroom
Glentruan Holiday Cottage
Entire Place • 3 bedrooms
Note: Performance varies based on location, size, amenities, seasonality, and management quality. Data reflects the past 12 months.
Top Performing Airbnb Hosts in Higher Crackington (2025)
Learn from the best! This table showcases top-performing Airbnb hosts in Higher Crackington based on the number of properties managed and estimated total revenue over the past year. Analyze their scale and performance metrics.
| Host Name | Properties | Grossing Revenue | Stay Reviews | Avg Rating |
|---|---|---|---|---|
| Ross And Becky | 5 | $476,377 | 490 | 4.97/5.0 |
| Roger | 1 | $56,719 | 195 | 4.91/5.0 |
| Hazel | 1 | $47,091 | 68 | 4.96/5.0 |
| Cathy | 2 | $40,623 | 70 | 5.00/5.0 |
| Carole | 3 | $37,180 | 179 | 4.94/5.0 |
| Annabel | 1 | $36,101 | 293 | 4.93/5.0 |
| Breakwater Holidays | 1 | $34,923 | 4 | 4.00/5.0 |
| Host #47058870 | 1 | $16,812 | 15 | 4.67/5.0 |
| Tony | 1 | $11,401 | 85 | 5.00/5.0 |
| Host #97966133 | 1 | $3,899 | 1 | 0.00/5.0 |
Analyzing the strategies of top hosts, such as their property selection, pricing, and guest communication, can offer valuable lessons for optimizing your own Airbnb operations in Higher Crackington.
Dive Deeper: Advanced Higher Crackington STR Market Data (2025)
Ready to unlock more insights? AirROI provides access to advanced metrics and comprehensive Airbnb data for Higher Crackington. Explore detailed analytics beyond this report to refine your investment strategy, optimize pricing, and maximize your vacation rental profits.
Explore Advanced MetricsHigher Crackington Short-Term Rental Market Composition (2025): Property & Room Types
Room Type Distribution
Property Type Distribution
Market Composition Insights for Higher Crackington
- The Higher Crackington Airbnb market composition is heavily skewed towards Entire Home/Apt listings, which make up 100% of the 17 active rentals. This indicates strong guest preference for privacy and space.
- Looking at the property type distribution in Higher Crackington, House properties are the most common (41.2%), reflecting the local real estate landscape.
- Houses represent a significant 41.2% portion, catering likely to families or larger groups.
- The presence of 5.9% Hotel/Boutique listings indicates integration with traditional hospitality.
Higher Crackington Airbnb Room Capacity Analysis (2025): Bedroom Distribution
Distribution of Listings by Number of Bedrooms
Room Capacity Insights for Higher Crackington
- The dominant room capacity in Higher Crackington is 3 bedrooms listings, making up 29.4% of the market. This suggests a strong demand for properties suitable for families or small groups.
- Together, 3 bedrooms and 1 bedroom properties represent 52.9% of the active Airbnb listings in Higher Crackington, indicating a high concentration in these sizes.
- A significant 47.1% of listings offer 3+ bedrooms, catering to larger groups and families seeking more space in Higher Crackington.
Higher Crackington Vacation Rental Guest Capacity Trends (2025)
Distribution of Listings by Guest Capacity
Guest Capacity Insights for Higher Crackington
- The most common guest capacity trend in Higher Crackington vacation rentals is listings accommodating 2 guests (29.4%). This suggests the primary traveler segment is likely couples or solo travelers.
- Properties designed for 2 guests and 8+ guests dominate the Higher Crackington STR market, accounting for 52.9% of listings.
- 41.1% of properties accommodate 6+ guests, serving the market segment for larger families or group travel in Higher Crackington.
- On average, properties in Higher Crackington are equipped to host 4.7 guests.
Higher Crackington Airbnb Booking Patterns (2025): Available vs. Booked Days
Available Days Distribution
Booked Days Distribution
Booking Pattern Insights for Higher Crackington
- The most common availability pattern in Higher Crackington falls within the 181-270 days range, representing 52.9% of listings. This suggests many properties have significant open periods on their calendars.
- Approximately 82.3% of listings show high availability (181+ days open annually), indicating potential for increased bookings or specific owner usage patterns.
- For booked days, the 91-180 days range is most frequent in Higher Crackington (52.9%), reflecting common guest stay durations or potential owner blocking patterns.
- A notable 17.6% of properties secure long booking periods (181+ days booked per year), highlighting successful long-term rental strategies or significant owner usage.
Higher Crackington Airbnb Minimum Stay Requirements Analysis
Distribution of Listings by Minimum Night Requirement
1 Night
4 listings
25% of total
2 Nights
4 listings
25% of total
3 Nights
2 listings
12.5% of total
4-6 Nights
2 listings
12.5% of total
7-29 Nights
1 listings
6.3% of total
30+ Nights
3 listings
18.8% of total
Key Insights
- The most prevalent minimum stay requirement in Higher Crackington is 1 Night, adopted by 25% of listings. This highlights the market's preference for shorter, flexible bookings.
- A significant segment (18.8%) caters to monthly stays (30+ nights) in Higher Crackington, pointing to opportunities in the extended-stay market.
Recommendations
- Align with the market by considering a 1 Night minimum stay, as 25% of Higher Crackington hosts use this setting.
- If feasible, allowing 1-night stays, especially midweek or during low season, could capture last-minute bookings, as only 25% currently do.
- Explore offering discounts for stays of 30+ nights to attract the 18.8% of the market seeking extended stays.
- Adjust minimum nights based on seasonality – potentially shorter during low season and longer during peak demand periods in Higher Crackington.
Higher Crackington Airbnb Cancellation Policy Trends Analysis (2025)
Flexible
1 listings
6.3% of total
Moderate
4 listings
25% of total
Firm
8 listings
50% of total
Strict
3 listings
18.8% of total
Cancellation Policy Insights for Higher Crackington
- The prevailing Airbnb cancellation policy trend in Higher Crackington is Firm, used by 50% of listings.
- A majority (68.8%) of hosts in Higher Crackington utilize Firm or Strict policies, indicating a market where hosts prioritize booking security.
Recommendations for Hosts
- Consider adopting a Firm policy to align with the 50% market standard in Higher Crackington.
- Regularly review your cancellation policy against competitors and market demand shifts in Higher Crackington.
Higher Crackington STR Booking Lead Time Analysis (2025)
Average Booking Lead Time by Month
Booking Lead Time Insights for Higher Crackington
- The overall average booking lead time for vacation rentals in Higher Crackington is 63 days.
- Guests book furthest in advance for stays during June (average 121 days), likely coinciding with peak travel demand or local events.
- The shortest booking windows occur for stays in March (average 20 days), indicating more last-minute travel plans during this time.
- Seasonally, Summer (100 days avg.) sees the longest lead times, while Winter (41 days avg.) has the shortest, reflecting typical travel planning cycles.
Recommendations for Hosts
- Use the overall average lead time (63 days) as a baseline for your pricing and availability strategy in Higher Crackington.
- For June stays, consider implementing length-of-stay discounts or slightly higher rates for bookings made less than 121 days out to capitalize on advance planning.
- Target marketing efforts for the Summer season well in advance (at least 100 days) to capture early planners.
- Monitor your own booking lead times against these Higher Crackington averages to identify opportunities for dynamic pricing adjustments.
Popular & Essential Airbnb Amenities in Higher Crackington (2025)
Amenity Prevalence
Amenity Insights for Higher Crackington
- Popular amenities like Smoke alarm, Free parking on premises, Dishes and silverware are common but not universal. Offering these can provide a competitive edge.
Recommendations for Hosts
- Consider adding popular differentiators like Smoke alarm or Free parking on premises to increase appeal.
- Highlight unique or less common amenities you offer (e.g., hot tub, dedicated workspace, EV charger) in your listing description and photos.
- Regularly check competitor amenities in Higher Crackington to stay competitive.
Higher Crackington Airbnb Guest Demographics & Profile Analysis (2025)
Guest Profile Summary for Higher Crackington
- The typical guest profile for Airbnb in Higher Crackington consists of primarily domestic travelers (89%), often arriving from nearby England, typically belonging to the Post-2000s (Gen Z/Alpha) group (50%), primarily speaking English or French.
- Domestic travelers account for 88.8% of guests.
- Key international markets include United Kingdom (88.8%) and United States (3.3%).
- Top languages spoken are English (67.6%) followed by French (5.9%).
- A significant demographic segment is the Post-2000s (Gen Z/Alpha) group, representing 50% of guests.
Recommendations for Hosts
- Target domestic marketing efforts towards travelers from England and London.
- Tailor amenities and listing descriptions to appeal to the dominant Post-2000s (Gen Z/Alpha) demographic (e.g., highlight fast WiFi, smart home features, local guides).
- Highlight unique local experiences or amenities relevant to the primary guest profile.
- Consider seasonal promotions aligned with peak travel times for key origin markets.
Nearby Short-Term Rental Market Comparison
How does the Higher Crackington Airbnb market stack up against its neighbors? Compare key performance metrics like average monthly revenue, ADR, and occupancy rates in surrounding areas to understand the broader regional STR landscape.
| Market | Active Properties | Monthly Revenue | Daily Rate | Avg. Occupancy |
|---|---|---|---|---|
| Llanrhidian | 15 | $4,842 | $386.18 | 53% |
| Crai | 20 | $4,799 | $371.85 | 46% |
| Trenance | 19 | $4,795 | $428.63 | 43% |
| Angle | 13 | $4,602 | $384.81 | 42% |
| Ludchurch | 15 | $4,354 | $291.87 | 43% |
| Redberth | 29 | $4,103 | $223.37 | 59% |
| Milverton | 11 | $3,675 | $393.89 | 37% |
| Pennorth | 13 | $3,595 | $417.69 | 37% |
| Gilwern | 22 | $3,505 | $193.56 | 53% |
| Pontsticill | 11 | $3,447 | $225.81 | 53% |