Helford Airbnb Market Analysis 2025: Short Term Rental Data & Vacation Rental Statistics in England, United Kingdom
Is Airbnb profitable in Helford in 2025? Explore comprehensive Airbnb analytics for Helford, England, United Kingdom to uncover income potential. This 2025 STR market report for Helford, based on AirROI data from April 2024 to March 2025, reveals key trends in the niche market of 19 active listings.
Whether you're considering an Airbnb investment in Helford, optimizing your existing vacation rental, or exploring rental arbitrage opportunities, understanding the Helford Airbnb data is crucial. Leveraging the low regulation environment is key to maximizing your short term rental income potential. Let's dive into the specifics.
Key Helford Airbnb Performance Metrics Overview
Monthly Airbnb Revenue Variations & Income Potential in Helford (2025)
Understanding the monthly revenue variations for Airbnb listings in Helford is key to maximizing your short term rental income potential. Seasonality significantly impacts earnings. Our analysis, based on data from the past 12 months, shows that the peak revenue month for STRs in Helford is typically August, while November often presents the lowest earnings, highlighting opportunities for strategic pricing adjustments during shoulder and low seasons. Explore the typical Airbnb income in Helford across different performance tiers:
- Best-in-class properties (Top 10%) achieve $6,405+ monthly, often utilizing dynamic pricing and superior guest experiences.
- Strong performing properties (Top 25%) earn $3,216 or more, indicating effective management and desirable locations/amenities.
- Typical properties (Median) generate around $1,775 per month, representing the average market performance.
- Entry-level properties (Bottom 25%) see earnings around $922, often with potential for optimization.
Average Monthly Airbnb Earnings Trend in Helford
Helford Airbnb Occupancy Rate Trends (2025)
Maximize your bookings by understanding the Helford STR occupancy trends. Seasonal demand shifts significantly influence how often properties are booked. Typically, Augustsees the highest demand (peak season occupancy), while February experiences the lowest (low season). Effective strategies, like adjusting minimum stays or offering promotions, can boost occupancy during slower periods. Here's how different property tiers perform in Helford:
- Best-in-class properties (Top 10%) achieve 59%+ occupancy, indicating high desirability and potentially optimized availability.
- Strong performing properties (Top 25%) maintain 38% or higher occupancy, suggesting good market fit and guest satisfaction.
- Typical properties (Median) have an occupancy rate around 20%.
- Entry-level properties (Bottom 25%) average 14% occupancy, potentially facing higher vacancy.
Average Monthly Occupancy Rate Trend in Helford
Average Daily Rate (ADR) Airbnb Trends in Helford (2025)
Effective short term rental pricing strategy in Helford involves understanding monthly ADR fluctuations. The Average Daily Rate (ADR) for Airbnb in Helford typically peaks in August and dips lowest during November. Leveraging Airbnb dynamic pricing tools or strategies based on this seasonality can significantly boost revenue. Here's a look at the typical nightly rates achieved:
- Best-in-class properties (Top 10%) command rates of $386+ per night, often due to premium features or locations.
- Strong performing properties (Top 25%) achieve nightly rates of $278 or more.
- Typical properties (Median) charge around $228 per night.
- Entry-level properties (Bottom 25%) earn around $175 per night.
Average Daily Rate (ADR) Trend by Month in Helford
Get Live Helford Market Intelligence 👇

Explore Real-time Analytics
Airbnb Seasonality Analysis & Trends in Helford (2025)
Peak Season (August, July, September)
- Revenue averages $4,187 per month
- Occupancy rates average 40.8%
- Daily rates average $273
Shoulder Season
- Revenue averages $2,469 per month
- Occupancy maintains around 29.3%
- Daily rates hold near $240
Low Season (February, March, November)
- Revenue drops to average $856 per month
- Occupancy decreases to average 14.9%
- Daily rates adjust to average $217
Seasonality Insights for Helford
- The Airbnb seasonality in Helford shows highly seasonal trends requiring careful strategy. While the sections above show seasonal averages, it's also insightful to look at the extremes:
- During the high season, the absolute peak month showcases Helford's highest earning potential, with monthly revenues capable of climbing to $5,272, occupancy reaching a high of 44.4%, and ADRs peaking at $293.
- Conversely, the slowest single month of the year, typically falling within the low season, marks the market's lowest point. In this month, revenue might dip to $744, occupancy could drop to 12.5%, and ADRs may adjust down to $210.
- Understanding both the seasonal averages and these monthly peaks and troughs in revenue, occupancy, and ADR is crucial for maximizing your Airbnb profit potential in Helford.
Seasonal Strategies for Maximizing Profit
- Peak Season: Maximize revenue through premium pricing and potentially longer minimum stays. Ensure high availability.
- Low Season: Offer competitive pricing, special promotions (e.g., extended stay discounts), and flexible cancellation policies. Target off-season travelers like remote workers or budget-conscious guests.
- Shoulder Seasons: Implement dynamic pricing that balances peak and low rates. Target weekend travelers or specific events. Offer slightly more flexible terms than peak season.
- Regularly analyze your own performance against these Helford seasonality benchmarks and adjust your pricing and availability strategy accordingly.
Best Areas for Airbnb Investment in Helford (2025)
Exploring the top neighborhoods for short-term rentals in Helford? This section highlights key areas, outlining why they are attractive for hosts and guests, along with notable local attractions. Consider these locations based on your target guest profile and investment strategy.
| Neighborhood / Area | Why Host Here? (Target Guests & Appeal) | Key Attractions & Landmarks |
|---|---|---|
| Helford Village | Charming and picturesque village located by the river that is perfect for guests looking for a tranquil and scenic getaway. The village offers great local dining and easy access to nature trails. | Helford River, St. Anthony's Lighthouse, Helford Passage Beach, The Ferry, Helford Village Water Sports |
| Helford Passage | A beautiful coastal area known for its sandy beach and stunning views, ideal for beach lovers and water sports enthusiasts. A favorite among families and couples looking to unwind. | Helford Passage Beach, Maenporth Beach, Helford River Cruises, Restaurants at Helford Passage, Coastal walks |
| Bodmin Moor | A historic and scenic area known for its rugged landscape and rich history. Attracts nature lovers and hikers looking for a peaceful retreat further inland, away from the coast. | Bodmin Moor, Rough Tor, Hiking Trails, Dramatic Scenery, Cornish Piskies |
| Falmouth | Close to Helford and a vibrant town with a bustling harbor and a range of attractions. Ideal for visitors wanting cultural experiences, shopping, and nightlife. | National Maritime Museum, Falmouth Harbour, Gyllyngvase Beach, Falmouth Art Gallery, Shopping in Falmouth |
| The Lizard | The southernmost point of mainland Britain, known for its stunning coastal views and unique flora and fauna. Perfect for eco-tourists and nature walks. | Lizard Point, Kynance Cove, Lizard Lighthouse, Walking Trails, Unique Wildlife |
| Penryn | A historic town with a rich maritime history, located near Falmouth. Offers a mix of local culture and access to the coast, appealing to those looking for a quaint atmosphere. | Penryn Heritage Centre, Penryn River, Local Pubs and Cafes, Historic Buildings, Coastal Access |
| Mawnan Smith | A charming village surrounded by beautiful countryside and close to the coast. It's perfect for those looking to explore both land and sea in a quieter setting. | Glendurgan Garden, Trelissick Gardens, Mawnan Smith Walks, Local pubs and shops, Access to Nature |
| Kynance Cove | Famous for its breathtaking beach and turquoise waters, this area draws visitors looking for stunning landscape photography and beach activities. | Kynance Cove Beach, Walking Trails, Stunning Coastal Views, Rock Pooling, Nearby Cafes |
Understanding Airbnb License Requirements & STR Laws in Helford (2025)
While Helford, England, United Kingdom currently shows low STR regulations, specific Airbnb license requirements might still exist or change. Always verify the latest short term rental regulations and Airbnb license requirements directly with local government authorities for Helford to ensure full compliance before hosting.
(Source: AirROI data, 2025, based on 5% licensed listings)
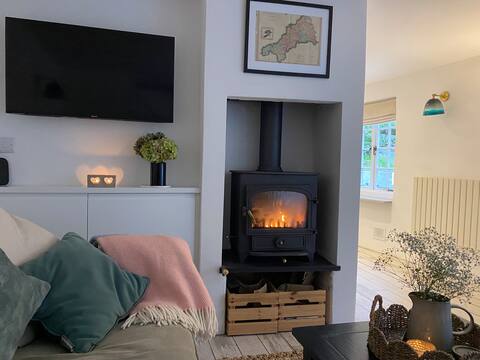
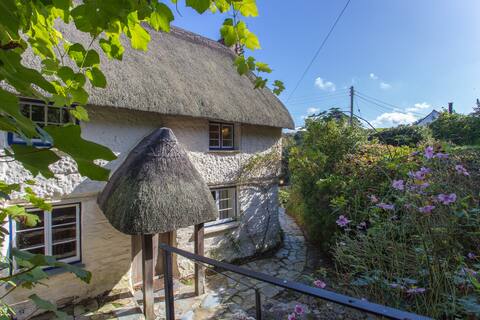
Top Performing Airbnb Properties in Helford (2025)
Benchmark your potential! Explore examples of top-performing Airbnb properties in Helfordbased on Trailing Twelve Month (TTM) revenue. Analyze their characteristics, revenue, occupancy rate, and ADR to understand what drives success in this market.

Charming cottage in amazing location by the sea
Entire Place • 3 bedrooms

Noah’s Ark Boatshed and Slipway
Entire Place • N/A

Luxury clapboard cottage with river views, Helford
Entire Place • 4 bedrooms
Cosy, coastal cottage - Helford, SW Cornwall
Entire Place • 2 bedrooms
Laloma Helford by Porthleven and Lizard Hoildays
Entire Place • 3 bedrooms
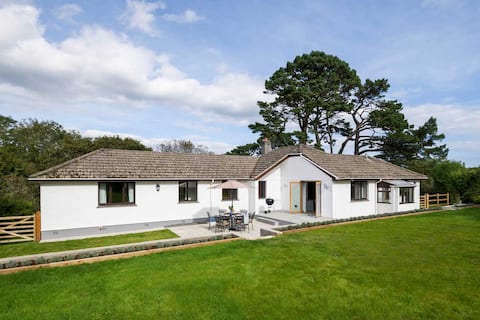
Spacious family home by the river
Entire Place • 3 bedrooms
Note: Performance varies based on location, size, amenities, seasonality, and management quality. Data reflects the past 12 months.
Top Performing Airbnb Hosts in Helford (2025)
Learn from the best! This table showcases top-performing Airbnb hosts in Helford based on the number of properties managed and estimated total revenue over the past year. Analyze their scale and performance metrics.
| Host Name | Properties | Grossing Revenue | Stay Reviews | Avg Rating |
|---|---|---|---|---|
| Piers | 1 | $62,404 | 56 | 4.82/5.0 |
| Rebecca | 1 | $62,281 | 22 | 5.00/5.0 |
| Cornish Horizons | 6 | $53,359 | 13 | 1.50/5.0 |
| Jay | 1 | $43,391 | 39 | 4.87/5.0 |
| Eleanor | 1 | $37,476 | 55 | 4.96/5.0 |
| Pickle | 2 | $32,955 | 192 | 4.67/5.0 |
| Host #484156756 | 1 | $32,834 | 2 | 0.00/5.0 |
| Host #59456360 | 1 | $21,140 | 0 | 0.00/5.0 |
| Linda | 1 | $19,608 | 59 | 4.80/5.0 |
| Klazina | 2 | $16,589 | 104 | 4.96/5.0 |
Analyzing the strategies of top hosts, such as their property selection, pricing, and guest communication, can offer valuable lessons for optimizing your own Airbnb operations in Helford.
Dive Deeper: Advanced Helford STR Market Data (2025)
Ready to unlock more insights? AirROI provides access to advanced metrics and comprehensive Airbnb data for Helford. Explore detailed analytics beyond this report to refine your investment strategy, optimize pricing, and maximize your vacation rental profits.
Explore Advanced MetricsHelford Short-Term Rental Market Composition (2025): Property & Room Types
Room Type Distribution
Property Type Distribution
Market Composition Insights for Helford
- The Helford Airbnb market composition is heavily skewed towards Entire Home/Apt listings, which make up 89.5% of the 19 active rentals. This indicates strong guest preference for privacy and space.
- Looking at the property type distribution in Helford, House properties are the most common (73.7%), reflecting the local real estate landscape.
- Houses represent a significant 73.7% portion, catering likely to families or larger groups.
- The presence of 10.5% Hotel/Boutique listings indicates integration with traditional hospitality.
Helford Airbnb Room Capacity Analysis (2025): Bedroom Distribution
Distribution of Listings by Number of Bedrooms
Room Capacity Insights for Helford
- The dominant room capacity in Helford is 3 bedrooms listings, making up 42.1% of the market. This suggests a strong demand for properties suitable for families or small groups.
- Together, 3 bedrooms and 2 bedrooms properties represent 57.9% of the active Airbnb listings in Helford, indicating a high concentration in these sizes.
- A significant 57.9% of listings offer 3+ bedrooms, catering to larger groups and families seeking more space in Helford.
Helford Vacation Rental Guest Capacity Trends (2025)
Distribution of Listings by Guest Capacity
Guest Capacity Insights for Helford
- The most common guest capacity trend in Helford vacation rentals is listings accommodating 6 guests (36.8%). This suggests the primary traveler segment is likely larger groups.
- Properties designed for 6 guests and 4 guests dominate the Helford STR market, accounting for 57.9% of listings.
- 52.6% of properties accommodate 6+ guests, serving the market segment for larger families or group travel in Helford.
- On average, properties in Helford are equipped to host 4.7 guests.
Helford Airbnb Booking Patterns (2025): Available vs. Booked Days
Available Days Distribution
Booked Days Distribution
Booking Pattern Insights for Helford
- The most common availability pattern in Helford falls within the 271-366 days range, representing 63.2% of listings. This suggests many properties have significant open periods on their calendars.
- Approximately 100.0% of listings show high availability (181+ days open annually), indicating potential for increased bookings or specific owner usage patterns.
- For booked days, the 31-90 days range is most frequent in Helford (57.9%), reflecting common guest stay durations or potential owner blocking patterns.
Helford Airbnb Minimum Stay Requirements Analysis
Distribution of Listings by Minimum Night Requirement
1 Night
6 listings
42.9% of total
2 Nights
1 listings
7.1% of total
3 Nights
5 listings
35.7% of total
4-6 Nights
1 listings
7.1% of total
7-29 Nights
1 listings
7.1% of total
Key Insights
- The most prevalent minimum stay requirement in Helford is 1 Night, adopted by 42.9% of listings. This highlights the market's preference for shorter, flexible bookings.
Recommendations
- Align with the market by considering a 1 Night minimum stay, as 42.9% of Helford hosts use this setting.
- Adjust minimum nights based on seasonality – potentially shorter during low season and longer during peak demand periods in Helford.
Helford Airbnb Cancellation Policy Trends Analysis (2025)
Super Strict 60 Days
6 listings
37.5% of total
Firm
6 listings
37.5% of total
Strict
4 listings
25% of total
Cancellation Policy Insights for Helford
- The prevailing Airbnb cancellation policy trend in Helford is Super Strict 60 Days, used by 37.5% of listings.
- A majority (62.5%) of hosts in Helford utilize Firm or Strict policies, indicating a market where hosts prioritize booking security.
Recommendations for Hosts
- Consider adopting a Super Strict 60 Days policy to align with the 37.5% market standard in Helford.
- Regularly review your cancellation policy against competitors and market demand shifts in Helford.
Helford STR Booking Lead Time Analysis (2025)
Average Booking Lead Time by Month
Booking Lead Time Insights for Helford
- The overall average booking lead time for vacation rentals in Helford is 120 days.
- Guests book furthest in advance for stays during May (average 152 days), likely coinciding with peak travel demand or local events.
- The shortest booking windows occur for stays in November (average 49 days), indicating more last-minute travel plans during this time.
- Seasonally, Summer (147 days avg.) sees the longest lead times, while Fall (90 days avg.) has the shortest, reflecting typical travel planning cycles.
Recommendations for Hosts
- Use the overall average lead time (120 days) as a baseline for your pricing and availability strategy in Helford.
- For May stays, consider implementing length-of-stay discounts or slightly higher rates for bookings made less than 152 days out to capitalize on advance planning.
- Target marketing efforts for the Summer season well in advance (at least 147 days) to capture early planners.
- Monitor your own booking lead times against these Helford averages to identify opportunities for dynamic pricing adjustments.
Popular & Essential Airbnb Amenities in Helford (2025)
Amenity Prevalence
Amenity Insights for Helford
- Essential amenities in Helford that guests expect include: Wifi, Smoke alarm. Lacking these (any) could significantly impact bookings.
- Popular amenities like Essentials, TV, Heating are common but not universal. Offering these can provide a competitive edge.
Recommendations for Hosts
- Ensure your listing includes all essential amenities for Helford: Wifi, Smoke alarm.
- Consider adding popular differentiators like Essentials or TV to increase appeal.
- Highlight unique or less common amenities you offer (e.g., hot tub, dedicated workspace, EV charger) in your listing description and photos.
- Regularly check competitor amenities in Helford to stay competitive.
Helford Airbnb Guest Demographics & Profile Analysis (2025)
Guest Profile Summary for Helford
- The typical guest profile for Airbnb in Helford consists of primarily domestic travelers (82%), often arriving from nearby England, typically belonging to the Post-2000s (Gen Z/Alpha) group (50%), primarily speaking English or French.
- Domestic travelers account for 81.8% of guests.
- Key international markets include United Kingdom (81.8%) and Germany (4.5%).
- Top languages spoken are English (71.4%) followed by French (10.7%).
- A significant demographic segment is the Post-2000s (Gen Z/Alpha) group, representing 50% of guests.
Recommendations for Hosts
- Target domestic marketing efforts towards travelers from England and London.
- Tailor amenities and listing descriptions to appeal to the dominant Post-2000s (Gen Z/Alpha) demographic (e.g., highlight fast WiFi, smart home features, local guides).
- Highlight unique local experiences or amenities relevant to the primary guest profile.
- Consider seasonal promotions aligned with peak travel times for key origin markets.
Nearby Short-Term Rental Market Comparison
How does the Helford Airbnb market stack up against its neighbors? Compare key performance metrics like average monthly revenue, ADR, and occupancy rates in surrounding areas to understand the broader regional STR landscape.
| Market | Active Properties | Monthly Revenue | Daily Rate | Avg. Occupancy |
|---|---|---|---|---|
| Llanrhidian | 15 | $4,842 | $386.18 | 53% |
| Trenance | 19 | $4,795 | $428.63 | 43% |
| Angle | 13 | $4,602 | $384.81 | 42% |
| Ludchurch | 15 | $4,354 | $291.87 | 43% |
| Redberth | 29 | $4,103 | $223.37 | 59% |
| Higher Crackington | 17 | $3,731 | $340.74 | 37% |
| Perranuthnoe | 24 | $3,421 | $352.15 | 37% |
| St. John | 44 | $3,354 | $233.49 | 50% |
| Llanboidy | 10 | $3,280 | $260.08 | 45% |
| Llangennith | 32 | $3,271 | $251.71 | 52% |