Harrogate Airbnb Market Analysis 2025: Short Term Rental Data & Vacation Rental Statistics in England, United Kingdom
Is Airbnb profitable in Harrogate in 2025? Explore comprehensive Airbnb analytics for Harrogate, England, United Kingdom to uncover income potential. This 2025 STR market report for Harrogate, based on AirROI data from April 2024 to March 2025, reveals key trends in the market of 398 active listings.
Whether you're considering an Airbnb investment in Harrogate, optimizing your existing vacation rental, or exploring rental arbitrage opportunities, understanding the Harrogate Airbnb data is crucial. Leveraging the low regulation environment is key to maximizing your short term rental income potential. Let's dive into the specifics.
Key Harrogate Airbnb Performance Metrics Overview
Monthly Airbnb Revenue Variations & Income Potential in Harrogate (2025)
Understanding the monthly revenue variations for Airbnb listings in Harrogate is key to maximizing your short term rental income potential. Seasonality significantly impacts earnings. Our analysis, based on data from the past 12 months, shows that the peak revenue month for STRs in Harrogate is typically July, while January often presents the lowest earnings, highlighting opportunities for strategic pricing adjustments during shoulder and low seasons. Explore the typical Airbnb income in Harrogate across different performance tiers:
- Best-in-class properties (Top 10%) achieve $5,505+ monthly, often utilizing dynamic pricing and superior guest experiences.
- Strong performing properties (Top 25%) earn $3,927 or more, indicating effective management and desirable locations/amenities.
- Typical properties (Median) generate around $2,398 per month, representing the average market performance.
- Entry-level properties (Bottom 25%) see earnings around $1,229, often with potential for optimization.
Average Monthly Airbnb Earnings Trend in Harrogate
Harrogate Airbnb Occupancy Rate Trends (2025)
Maximize your bookings by understanding the Harrogate STR occupancy trends. Seasonal demand shifts significantly influence how often properties are booked. Typically, Julysees the highest demand (peak season occupancy), while January experiences the lowest (low season). Effective strategies, like adjusting minimum stays or offering promotions, can boost occupancy during slower periods. Here's how different property tiers perform in Harrogate:
- Best-in-class properties (Top 10%) achieve 81%+ occupancy, indicating high desirability and potentially optimized availability.
- Strong performing properties (Top 25%) maintain 66% or higher occupancy, suggesting good market fit and guest satisfaction.
- Typical properties (Median) have an occupancy rate around 46%.
- Entry-level properties (Bottom 25%) average 25% occupancy, potentially facing higher vacancy.
Average Monthly Occupancy Rate Trend in Harrogate
Average Daily Rate (ADR) Airbnb Trends in Harrogate (2025)
Effective short term rental pricing strategy in Harrogate involves understanding monthly ADR fluctuations. The Average Daily Rate (ADR) for Airbnb in Harrogate typically peaks in July and dips lowest during February. Leveraging Airbnb dynamic pricing tools or strategies based on this seasonality can significantly boost revenue. Here's a look at the typical nightly rates achieved:
- Best-in-class properties (Top 10%) command rates of $361+ per night, often due to premium features or locations.
- Strong performing properties (Top 25%) achieve nightly rates of $245 or more.
- Typical properties (Median) charge around $175 per night.
- Entry-level properties (Bottom 25%) earn around $120 per night.
Average Daily Rate (ADR) Trend by Month in Harrogate
Get Live Harrogate Market Intelligence 👇

Explore Real-time Analytics
Airbnb Seasonality Analysis & Trends in Harrogate (2025)
Peak Season (July, May, June)
- Revenue averages $3,621 per month
- Occupancy rates average 49.5%
- Daily rates average $228
Shoulder Season
- Revenue averages $3,017 per month
- Occupancy maintains around 48.3%
- Daily rates hold near $221
Low Season (January, February, March)
- Revenue drops to average $2,261 per month
- Occupancy decreases to average 38.3%
- Daily rates adjust to average $208
Seasonality Insights for Harrogate
- The Airbnb seasonality in Harrogate shows moderate seasonality with distinct peak and low periods. While the sections above show seasonal averages, it's also insightful to look at the extremes:
- During the high season, the absolute peak month showcases Harrogate's highest earning potential, with monthly revenues capable of climbing to $3,672, occupancy reaching a high of 56.4%, and ADRs peaking at $231.
- Conversely, the slowest single month of the year, typically falling within the low season, marks the market's lowest point. In this month, revenue might dip to $2,230, occupancy could drop to 35.8%, and ADRs may adjust down to $206.
- Understanding both the seasonal averages and these monthly peaks and troughs in revenue, occupancy, and ADR is crucial for maximizing your Airbnb profit potential in Harrogate.
Seasonal Strategies for Maximizing Profit
- Peak Season: Maximize revenue through premium pricing and potentially longer minimum stays. Ensure high availability.
- Low Season: Offer competitive pricing, special promotions (e.g., extended stay discounts), and flexible cancellation policies. Target off-season travelers like remote workers or budget-conscious guests.
- Shoulder Seasons: Implement dynamic pricing that balances peak and low rates. Target weekend travelers or specific events. Offer slightly more flexible terms than peak season.
- Regularly analyze your own performance against these Harrogate seasonality benchmarks and adjust your pricing and availability strategy accordingly.
Best Areas for Airbnb Investment in Harrogate (2025)
Exploring the top neighborhoods for short-term rentals in Harrogate? This section highlights key areas, outlining why they are attractive for hosts and guests, along with notable local attractions. Consider these locations based on your target guest profile and investment strategy.
| Neighborhood / Area | Why Host Here? (Target Guests & Appeal) | Key Attractions & Landmarks |
|---|---|---|
| Valley Gardens | A beautiful public park in the center of Harrogate, popular with visitors for its stunning gardens and relaxing atmosphere. Ideal for hosting guests looking for leisure and nature. | Valley Gardens, Royal Pump Room Museum, The Stray, Harrogate Theatre, Harrogate Turkish Baths |
| Betty's Café Tea Rooms | Famous for its traditional afternoon tea, this iconic establishment attracts food lovers and tourists, making it a prime location for Airbnb. | Betty's Café Tea Rooms, Harrogate Convention Centre, Mercer Art Gallery, Harrogate Oval Gardens, The Old Bell Tavern |
| Harrogate Town Centre | The bustling heart of Harrogate, filled with shops, restaurants, and pubs, making it attractive for both short-term and long-term visitors. | Victoria Shopping Centre, Parade and Market Square, Royal Hall, Crescent Gardens, The Crown Hotel |
| Brimham Rocks | A unique and scenic destination just outside Harrogate, known for its natural rock formations, drawing adventure seekers and families alike. | Brimham Rocks, Fountains Abbey, Studley Royal Water Garden, Nidderdale AONB, Druid's Grove |
| Ripley Castle | A historic castle and beautiful village close to Harrogate, offering charm and insights into English heritage, ideal for history enthusiasts. | Ripley Castle, Ripley Village, The Stray, Pateley Bridge, Nidderdale Museum |
| Knaresborough | A picturesque market town near Harrogate, famous for its stunning views and rich history, appealing to tourists exploring the area. | Knaresborough Castle, Mother Shipton's Cave, The River Nidd, Knaresborough Market, Market Place |
| Great Yorkshire Showground | Home to the Great Yorkshire Show, this area hosts various events throughout the year, making it attractive for visitors and exhibitors. | Great Yorkshire Show, Harrogate Exhibition Centre, The Yorkshire Event Centre, Ripley Castle, Knaresborough |
| Harlow Carr Gardens | Part of the RHS, these beautiful gardens are a tranquil escape and attract visitors year-round for their horticultural displays and events. | Harlow Carr Gardens, Royal Horticultural Society, Valley Gardens, Brackenthwaite Falls, The Old Magnesia Well Spa |
Understanding Airbnb License Requirements & STR Laws in Harrogate (2025)
While Harrogate, England, United Kingdom currently shows low STR regulations, specific Airbnb license requirements might still exist or change. Always verify the latest short term rental regulations and Airbnb license requirements directly with local government authorities for Harrogate to ensure full compliance before hosting.
(Source: AirROI data, 2025, based on 0% licensed listings)
Top Performing Airbnb Properties in Harrogate (2025)
Benchmark your potential! Explore examples of top-performing Airbnb properties in Harrogatebased on Trailing Twelve Month (TTM) revenue. Analyze their characteristics, revenue, occupancy rate, and ADR to understand what drives success in this market.
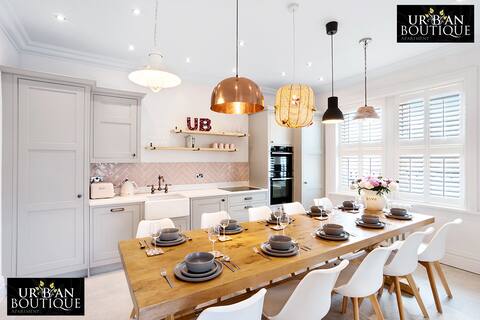
Luxurious Urban Boutique Apartment
Entire Place • 4 bedrooms
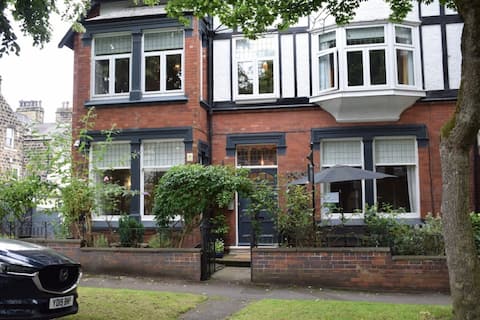
Whole House - Group Booking
Entire Place • 7 bedrooms
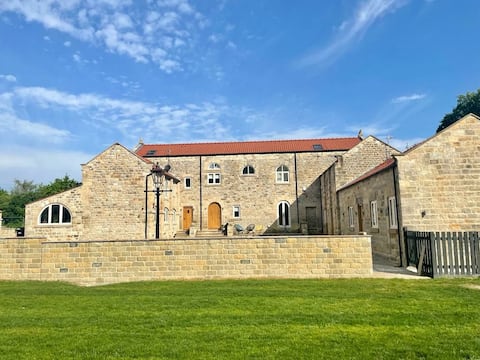
The Mill House, Harrogate
Entire Place • 4 bedrooms

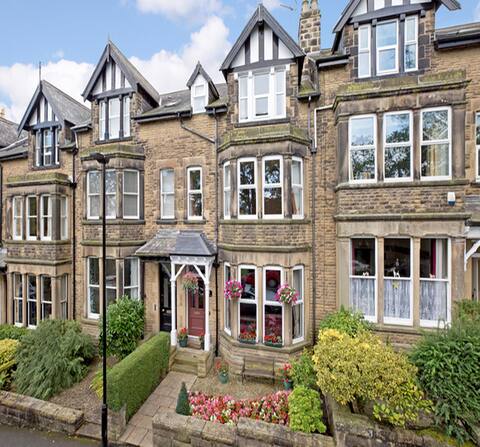
Host & Stay | Parkside Villa
Entire Place • 7 bedrooms
Harrogate centre overlooking valley gardens
Entire Place • 6 bedrooms
Beautiful 3 Bed Duplex Apartment Central Harrogate
Entire Place • 3 bedrooms
Note: Performance varies based on location, size, amenities, seasonality, and management quality. Data reflects the past 12 months.
Top Performing Airbnb Hosts in Harrogate (2025)
Learn from the best! This table showcases top-performing Airbnb hosts in Harrogate based on the number of properties managed and estimated total revenue over the past year. Analyze their scale and performance metrics.
| Host Name | Properties | Grossing Revenue | Stay Reviews | Avg Rating |
|---|---|---|---|---|
| Joe | 10 | $497,912 | 248 | 4.91/5.0 |
| Sarah | 11 | $376,266 | 231 | 4.10/5.0 |
| Claire | 25 | $358,157 | 700 | 4.50/5.0 |
| Dan | 14 | $350,072 | 36 | 2.06/5.0 |
| Dale | 6 | $284,953 | 164 | 4.62/5.0 |
| Youcef | 7 | $273,996 | 250 | 4.85/5.0 |
| The Marmot | 5 | $194,629 | 92 | 4.88/5.0 |
| Luke | 1 | $183,821 | 35 | 5.00/5.0 |
| Karen | 1 | $179,152 | 11 | 5.00/5.0 |
| Lydia | 5 | $169,850 | 103 | 4.91/5.0 |
Analyzing the strategies of top hosts, such as their property selection, pricing, and guest communication, can offer valuable lessons for optimizing your own Airbnb operations in Harrogate.
Dive Deeper: Advanced Harrogate STR Market Data (2025)
Ready to unlock more insights? AirROI provides access to advanced metrics and comprehensive Airbnb data for Harrogate. Explore detailed analytics beyond this report to refine your investment strategy, optimize pricing, and maximize your vacation rental profits.
Explore Advanced MetricsHarrogate Short-Term Rental Market Composition (2025): Property & Room Types
Room Type Distribution
Property Type Distribution
Market Composition Insights for Harrogate
- The Harrogate Airbnb market composition is heavily skewed towards Entire Home/Apt listings, which make up 84.7% of the 398 active rentals. This indicates strong guest preference for privacy and space.
- Looking at the property type distribution in Harrogate, Apartment/Condo properties are the most common (58.8%), reflecting the local real estate landscape.
- Houses represent a significant 38.9% portion, catering likely to families or larger groups.
- Smaller segments like hotel/boutique, others, outdoor/unique, unique stays (combined 2.4%) offer potential for unique stay experiences.
Harrogate Airbnb Room Capacity Analysis (2025): Bedroom Distribution
Distribution of Listings by Number of Bedrooms
Room Capacity Insights for Harrogate
- The dominant room capacity in Harrogate is 2 bedrooms listings, making up 35.2% of the market. This suggests a strong demand for properties suitable for couples or solo travelers.
- Together, 2 bedrooms and 1 bedroom properties represent 64.6% of the active Airbnb listings in Harrogate, indicating a high concentration in these sizes.
- A significant 22.6% of listings offer 3+ bedrooms, catering to larger groups and families seeking more space in Harrogate.
Harrogate Vacation Rental Guest Capacity Trends (2025)
Distribution of Listings by Guest Capacity
Guest Capacity Insights for Harrogate
- The most common guest capacity trend in Harrogate vacation rentals is listings accommodating 4 guests (30.4%). This suggests the primary traveler segment is likely small families or groups.
- Properties designed for 4 guests and 2 guests dominate the Harrogate STR market, accounting for 53.0% of listings.
- 25.1% of properties accommodate 6+ guests, serving the market segment for larger families or group travel in Harrogate.
- On average, properties in Harrogate are equipped to host 3.7 guests.
Harrogate Airbnb Booking Patterns (2025): Available vs. Booked Days
Available Days Distribution
Booked Days Distribution
Booking Pattern Insights for Harrogate
- The most common availability pattern in Harrogate falls within the 181-270 days range, representing 35.7% of listings. This suggests many properties have significant open periods on their calendars.
- Approximately 65.9% of listings show high availability (181+ days open annually), indicating potential for increased bookings or specific owner usage patterns.
- For booked days, the 91-180 days range is most frequent in Harrogate (33.4%), reflecting common guest stay durations or potential owner blocking patterns.
- A notable 36.4% of properties secure long booking periods (181+ days booked per year), highlighting successful long-term rental strategies or significant owner usage.
Harrogate Airbnb Minimum Stay Requirements Analysis
Distribution of Listings by Minimum Night Requirement
1 Night
84 listings
22.8% of total
2 Nights
164 listings
44.6% of total
3 Nights
34 listings
9.2% of total
4-6 Nights
3 listings
0.8% of total
7-29 Nights
22 listings
6% of total
30+ Nights
61 listings
16.6% of total
Key Insights
- The most prevalent minimum stay requirement in Harrogate is 2 Nights, adopted by 44.6% of listings. This highlights the market's preference for shorter, flexible bookings.
- A strong majority (67.4%) of the Harrogate Airbnb data shows acceptance of very short stays (1-2 nights), indicating a dynamic, high-turnover market.
- A significant segment (16.6%) caters to monthly stays (30+ nights) in Harrogate, pointing to opportunities in the extended-stay market.
Recommendations
- Align with the market by considering a 2 Nights minimum stay, as 44.6% of Harrogate hosts use this setting.
- If feasible, allowing 1-night stays, especially midweek or during low season, could capture last-minute bookings, as only 22.8% currently do.
- Explore offering discounts for stays of 30+ nights to attract the 16.6% of the market seeking extended stays.
- Adjust minimum nights based on seasonality – potentially shorter during low season and longer during peak demand periods in Harrogate.
Harrogate Airbnb Cancellation Policy Trends Analysis (2025)
Refundable
1 listings
0.3% of total
Super Strict 60 Days
2 listings
0.6% of total
Super Strict 30 Days
7 listings
2% of total
Flexible
67 listings
19% of total
Moderate
114 listings
32.4% of total
Firm
112 listings
31.8% of total
Strict
49 listings
13.9% of total
Cancellation Policy Insights for Harrogate
- The prevailing Airbnb cancellation policy trend in Harrogate is Moderate, used by 32.4% of listings.
- There's a relatively balanced mix between guest-friendly (51.4%) and stricter (45.7%) policies, offering choices for different guest needs.
Recommendations for Hosts
- Consider adopting a Moderate policy to align with the 32.4% market standard in Harrogate.
- Using a Strict policy might deter some guests, as only 13.9% of listings use it. Evaluate if potential revenue protection outweighs possible lower booking rates.
- Regularly review your cancellation policy against competitors and market demand shifts in Harrogate.
Harrogate STR Booking Lead Time Analysis (2025)
Average Booking Lead Time by Month
Booking Lead Time Insights for Harrogate
- The overall average booking lead time for vacation rentals in Harrogate is 59 days.
- Guests book furthest in advance for stays during July (average 109 days), likely coinciding with peak travel demand or local events.
- The shortest booking windows occur for stays in October (average 51 days), indicating more last-minute travel plans during this time.
- Seasonally, Summer (81 days avg.) sees the longest lead times, while Winter (58 days avg.) has the shortest, reflecting typical travel planning cycles.
Recommendations for Hosts
- Use the overall average lead time (59 days) as a baseline for your pricing and availability strategy in Harrogate.
- For July stays, consider implementing length-of-stay discounts or slightly higher rates for bookings made less than 109 days out to capitalize on advance planning.
- Target marketing efforts for the Summer season well in advance (at least 81 days) to capture early planners.
- Monitor your own booking lead times against these Harrogate averages to identify opportunities for dynamic pricing adjustments.
Popular & Essential Airbnb Amenities in Harrogate (2025)
Amenity Prevalence
Amenity Insights for Harrogate
- Essential amenities in Harrogate that guests expect include: Wifi, Smoke alarm, Heating. Lacking these (any) could significantly impact bookings.
- Popular amenities like TV, Essentials, Kitchen are common but not universal. Offering these can provide a competitive edge.
Recommendations for Hosts
- Ensure your listing includes all essential amenities for Harrogate: Wifi, Smoke alarm, Heating.
- Prioritize adding missing essentials: Wifi, Smoke alarm, Heating.
- Consider adding popular differentiators like TV or Essentials to increase appeal.
- Highlight unique or less common amenities you offer (e.g., hot tub, dedicated workspace, EV charger) in your listing description and photos.
- Regularly check competitor amenities in Harrogate to stay competitive.
Harrogate Airbnb Guest Demographics & Profile Analysis (2025)
Guest Profile Summary for Harrogate
- The typical guest profile for Airbnb in Harrogate consists of primarily domestic travelers (89%), often arriving from nearby England, typically belonging to the Post-2000s (Gen Z/Alpha) group (50%), primarily speaking English or French.
- Domestic travelers account for 88.9% of guests.
- Key international markets include United Kingdom (88.9%) and United States (3.9%).
- Top languages spoken are English (72.8%) followed by French (7.7%).
- A significant demographic segment is the Post-2000s (Gen Z/Alpha) group, representing 50% of guests.
Recommendations for Hosts
- Target domestic marketing efforts towards travelers from England and London.
- Tailor amenities and listing descriptions to appeal to the dominant Post-2000s (Gen Z/Alpha) demographic (e.g., highlight fast WiFi, smart home features, local guides).
- Highlight unique local experiences or amenities relevant to the primary guest profile.
- Consider seasonal promotions aligned with peak travel times for key origin markets.
Nearby Short-Term Rental Market Comparison
How does the Harrogate Airbnb market stack up against its neighbors? Compare key performance metrics like average monthly revenue, ADR, and occupancy rates in surrounding areas to understand the broader regional STR landscape.
| Market | Active Properties | Monthly Revenue | Daily Rate | Avg. Occupancy |
|---|---|---|---|---|
| Grinton | 14 | $5,456 | $365.05 | 51% |
| Cartmel Fell | 17 | $4,719 | $331.68 | 52% |
| Stamford Bridge | 11 | $4,669 | $410.14 | 38% |
| Casterton | 11 | $4,578 | $300.82 | 51% |
| Appleby | 10 | $4,577 | $332.39 | 44% |
| Cark | 11 | $4,540 | $885.21 | 31% |
| Flore | 10 | $4,534 | $347.03 | 40% |
| Craven Arms | 10 | $4,487 | $292.69 | 50% |
| Hayton | 13 | $4,333 | $239.53 | 60% |
| Watermillock | 16 | $4,281 | $274.03 | 50% |