Grimsby Airbnb Market Analysis 2025: Short Term Rental Data & Vacation Rental Statistics in England, United Kingdom
Is Airbnb profitable in Grimsby in 2025? Explore comprehensive Airbnb analytics for Grimsby, England, United Kingdom to uncover income potential. This 2025 STR market report for Grimsby, based on AirROI data from April 2024 to March 2025, reveals key trends in the niche market of 33 active listings.
Whether you're considering an Airbnb investment in Grimsby, optimizing your existing vacation rental, or exploring rental arbitrage opportunities, understanding the Grimsby Airbnb data is crucial. Leveraging the low regulation environment is key to maximizing your short term rental income potential. Let's dive into the specifics.
Key Grimsby Airbnb Performance Metrics Overview
Monthly Airbnb Revenue Variations & Income Potential in Grimsby (2025)
Understanding the monthly revenue variations for Airbnb listings in Grimsby is key to maximizing your short term rental income potential. Seasonality significantly impacts earnings. Our analysis, based on data from the past 12 months, shows that the peak revenue month for STRs in Grimsby is typically April, while November often presents the lowest earnings, highlighting opportunities for strategic pricing adjustments during shoulder and low seasons. Explore the typical Airbnb income in Grimsby across different performance tiers:
- Best-in-class properties (Top 10%) achieve $3,602+ monthly, often utilizing dynamic pricing and superior guest experiences.
- Strong performing properties (Top 25%) earn $2,796 or more, indicating effective management and desirable locations/amenities.
- Typical properties (Median) generate around $1,679 per month, representing the average market performance.
- Entry-level properties (Bottom 25%) see earnings around $521, often with potential for optimization.
Average Monthly Airbnb Earnings Trend in Grimsby
Grimsby Airbnb Occupancy Rate Trends (2025)
Maximize your bookings by understanding the Grimsby STR occupancy trends. Seasonal demand shifts significantly influence how often properties are booked. Typically, Julysees the highest demand (peak season occupancy), while May experiences the lowest (low season). Effective strategies, like adjusting minimum stays or offering promotions, can boost occupancy during slower periods. Here's how different property tiers perform in Grimsby:
- Best-in-class properties (Top 10%) achieve 75%+ occupancy, indicating high desirability and potentially optimized availability.
- Strong performing properties (Top 25%) maintain 57% or higher occupancy, suggesting good market fit and guest satisfaction.
- Typical properties (Median) have an occupancy rate around 30%.
- Entry-level properties (Bottom 25%) average 11% occupancy, potentially facing higher vacancy.
Average Monthly Occupancy Rate Trend in Grimsby
Average Daily Rate (ADR) Airbnb Trends in Grimsby (2025)
Effective short term rental pricing strategy in Grimsby involves understanding monthly ADR fluctuations. The Average Daily Rate (ADR) for Airbnb in Grimsby typically peaks in December and dips lowest during April. Leveraging Airbnb dynamic pricing tools or strategies based on this seasonality can significantly boost revenue. Here's a look at the typical nightly rates achieved:
- Best-in-class properties (Top 10%) command rates of $218+ per night, often due to premium features or locations.
- Strong performing properties (Top 25%) achieve nightly rates of $176 or more.
- Typical properties (Median) charge around $136 per night.
- Entry-level properties (Bottom 25%) earn around $86 per night.
Average Daily Rate (ADR) Trend by Month in Grimsby
Get Live Grimsby Market Intelligence 👇

Explore Real-time Analytics
Airbnb Seasonality Analysis & Trends in Grimsby (2025)
Peak Season (April, June, May)
- Revenue averages $2,863 per month
- Occupancy rates average 29.7%
- Daily rates average $145
Shoulder Season
- Revenue averages $1,732 per month
- Occupancy maintains around 38.0%
- Daily rates hold near $147
Low Season (January, February, November)
- Revenue drops to average $1,255 per month
- Occupancy decreases to average 34.9%
- Daily rates adjust to average $146
Seasonality Insights for Grimsby
- The Airbnb seasonality in Grimsby shows highly seasonal trends requiring careful strategy. While the sections above show seasonal averages, it's also insightful to look at the extremes:
- During the high season, the absolute peak month showcases Grimsby's highest earning potential, with monthly revenues capable of climbing to $2,904, occupancy reaching a high of 47.8%, and ADRs peaking at $159.
- Conversely, the slowest single month of the year, typically falling within the low season, marks the market's lowest point. In this month, revenue might dip to $1,087, occupancy could drop to 19.0%, and ADRs may adjust down to $141.
- Understanding both the seasonal averages and these monthly peaks and troughs in revenue, occupancy, and ADR is crucial for maximizing your Airbnb profit potential in Grimsby.
Seasonal Strategies for Maximizing Profit
- Peak Season: Maximize revenue through premium pricing and potentially longer minimum stays. Ensure high availability.
- Low Season: Offer competitive pricing, special promotions (e.g., extended stay discounts), and flexible cancellation policies. Target off-season travelers like remote workers or budget-conscious guests.
- Shoulder Seasons: Implement dynamic pricing that balances peak and low rates. Target weekend travelers or specific events. Offer slightly more flexible terms than peak season.
- Regularly analyze your own performance against these Grimsby seasonality benchmarks and adjust your pricing and availability strategy accordingly.
Best Areas for Airbnb Investment in Grimsby (2025)
Exploring the top neighborhoods for short-term rentals in Grimsby? This section highlights key areas, outlining why they are attractive for hosts and guests, along with notable local attractions. Consider these locations based on your target guest profile and investment strategy.
| Neighborhood / Area | Why Host Here? (Target Guests & Appeal) | Key Attractions & Landmarks |
|---|---|---|
| Cleethorpes | Popular seaside resort known for its sandy beaches, amusement parks, and family-friendly attractions. Ideal for attracting tourists during the summer months. | Cleethorpes Beach, Pleasure Island, Cleethorpes Pier, St Peter's Church, Seafront Promenade |
| Grimsby Town Centre | The heart of Grimsby with shops, restaurants, and local amenities. A convenient base for visitors to explore Grimsby and its surroundings. | Freshney Place Shopping Centre, Grimsby Minster, Grimsby Fishing Heritage Centre, Cecil's Restaurant |
| Waltham | Charming village close to Grimsby with a quaint atmosphere and local shops. Attracts visitors looking for a peaceful retreat. | Waltham Windmill, All Saints' Church, Waltham's local shops, Waltham Warrens |
| East Ravendale | A rural area near Grimsby known for its countryside scenery. Appeals to those seeking a quieter, nature-oriented experience. | East Ravendale Village, The countryside walks, Local farms |
| Immingham | Industrial town with good transport links. Suitable for workers and businesses visiting the area. | Immingham Dock, Local parks, St Andrew's Church |
| Healing | Residential area with a tranquil setting. Attracts visitors looking for a short stay that's still close to Grimsby. | Healing Village, Local parks, Historic buildings |
| New Waltham | Residential suburb with convenient access to Grimsby. Ideal for visitors who appreciate suburban charm with city proximity. | New Waltham Village, Local shops, Parks and green spaces |
| Humberston | Quiet coastal village near Cleethorpes, attracting families and couples for its relaxed seaside vibe. | Humberston Fitties, The Dunes Beach, Humberston Golf Club |
Understanding Airbnb License Requirements & STR Laws in Grimsby (2025)
While Grimsby, England, United Kingdom currently shows low STR regulations, specific Airbnb license requirements might still exist or change. Always verify the latest short term rental regulations and Airbnb license requirements directly with local government authorities for Grimsby to ensure full compliance before hosting.
(Source: AirROI data, 2025, finding no licensed listings among those analyzed)
Top Performing Airbnb Properties in Grimsby (2025)
Benchmark your potential! Explore examples of top-performing Airbnb properties in Grimsbybased on Trailing Twelve Month (TTM) revenue. Analyze their characteristics, revenue, occupancy rate, and ADR to understand what drives success in this market.
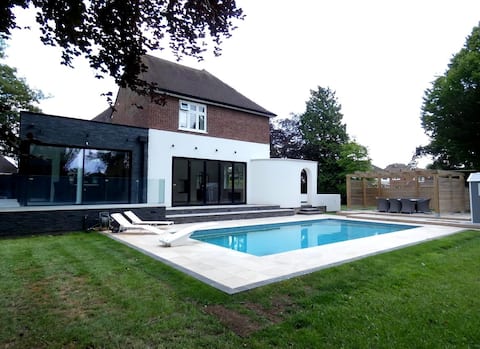
Luxury House with Swimming Pool
Entire Place • 4 bedrooms

Large | Sleeps 14 | 3 bathroom | Parking | Grimsby
Entire Place • 4 bedrooms

Large House | Ideal 4 Contractors | 3 Bed | 2 Bath
Entire Place • 4 bedrooms
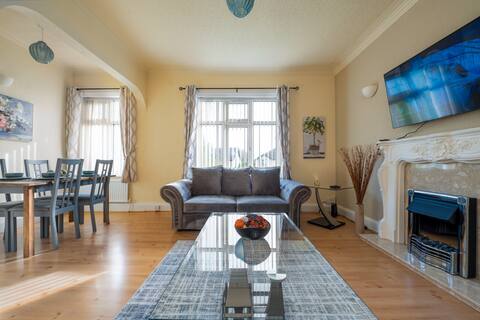
Spacious home in Prime Area | 2-4 Beds | Parking
Entire Place • 2 bedrooms

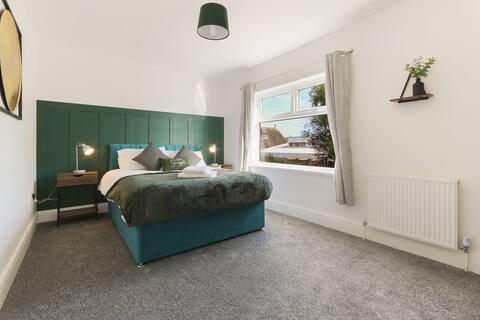
Stunning Brand New 3 Bedroom House - Detached
Entire Place • 3 bedrooms
Modern home near Alexandra Dock
Entire Place • 3 bedrooms
Note: Performance varies based on location, size, amenities, seasonality, and management quality. Data reflects the past 12 months.
Top Performing Airbnb Hosts in Grimsby (2025)
Learn from the best! This table showcases top-performing Airbnb hosts in Grimsby based on the number of properties managed and estimated total revenue over the past year. Analyze their scale and performance metrics.
| Host Name | Properties | Grossing Revenue | Stay Reviews | Avg Rating |
|---|---|---|---|---|
| High Demand Hideaways | 2 | $44,464 | 22 | 4.97/5.0 |
| Michael | 1 | $42,520 | 17 | 4.88/5.0 |
| Kenny | 1 | $36,980 | 96 | 4.67/5.0 |
| Helen | 3 | $34,772 | 7 | 1.53/5.0 |
| Greenstay | 1 | $34,634 | 21 | 4.95/5.0 |
| Host #97758250 | 5 | $32,115 | 25 | 1.00/5.0 |
| Boutique | 1 | $31,540 | 25 | 4.96/5.0 |
| Edna | 1 | $30,078 | 7 | 5.00/5.0 |
| Sam | 1 | $22,861 | 8 | 5.00/5.0 |
| Jessica | 1 | $20,653 | 3 | 4.67/5.0 |
Analyzing the strategies of top hosts, such as their property selection, pricing, and guest communication, can offer valuable lessons for optimizing your own Airbnb operations in Grimsby.
Dive Deeper: Advanced Grimsby STR Market Data (2025)
Ready to unlock more insights? AirROI provides access to advanced metrics and comprehensive Airbnb data for Grimsby. Explore detailed analytics beyond this report to refine your investment strategy, optimize pricing, and maximize your vacation rental profits.
Explore Advanced MetricsGrimsby Short-Term Rental Market Composition (2025): Property & Room Types
Room Type Distribution
Property Type Distribution
Market Composition Insights for Grimsby
- The Grimsby Airbnb market composition is heavily skewed towards Entire Home/Apt listings, which make up 87.9% of the 33 active rentals. This indicates strong guest preference for privacy and space.
- Looking at the property type distribution in Grimsby, House properties are the most common (66.7%), reflecting the local real estate landscape.
- Houses represent a significant 66.7% portion, catering likely to families or larger groups.
Grimsby Airbnb Room Capacity Analysis (2025): Bedroom Distribution
Distribution of Listings by Number of Bedrooms
Room Capacity Insights for Grimsby
- The dominant room capacity in Grimsby is 2 bedrooms listings, making up 36.4% of the market. This suggests a strong demand for properties suitable for couples or solo travelers.
- Together, 2 bedrooms and 4 bedrooms properties represent 60.6% of the active Airbnb listings in Grimsby, indicating a high concentration in these sizes.
- A significant 45.4% of listings offer 3+ bedrooms, catering to larger groups and families seeking more space in Grimsby.
Grimsby Vacation Rental Guest Capacity Trends (2025)
Distribution of Listings by Guest Capacity
Guest Capacity Insights for Grimsby
- The most common guest capacity trend in Grimsby vacation rentals is listings accommodating 8+ guests (24.2%). This suggests the primary traveler segment is likely larger groups.
- Properties designed for 8+ guests and 2 guests dominate the Grimsby STR market, accounting for 45.4% of listings.
- 33.3% of properties accommodate 6+ guests, serving the market segment for larger families or group travel in Grimsby.
- On average, properties in Grimsby are equipped to host 4.7 guests.
Grimsby Airbnb Booking Patterns (2025): Available vs. Booked Days
Available Days Distribution
Booked Days Distribution
Booking Pattern Insights for Grimsby
- The most common availability pattern in Grimsby falls within the 271-366 days range, representing 57.6% of listings. This suggests many properties have significant open periods on their calendars.
- Approximately 87.9% of listings show high availability (181+ days open annually), indicating potential for increased bookings or specific owner usage patterns.
- For booked days, the 31-90 days range is most frequent in Grimsby (33.3%), reflecting common guest stay durations or potential owner blocking patterns.
- A notable 15.2% of properties secure long booking periods (181+ days booked per year), highlighting successful long-term rental strategies or significant owner usage.
Grimsby Airbnb Minimum Stay Requirements Analysis
Distribution of Listings by Minimum Night Requirement
1 Night
4 listings
17.4% of total
2 Nights
5 listings
21.7% of total
3 Nights
6 listings
26.1% of total
4-6 Nights
4 listings
17.4% of total
7-29 Nights
2 listings
8.7% of total
30+ Nights
2 listings
8.7% of total
Key Insights
- The most prevalent minimum stay requirement in Grimsby is 3 Nights, adopted by 26.1% of listings. This highlights the market's preference for longer commitments.
Recommendations
- Align with the market by considering a 3 Nights minimum stay, as 26.1% of Grimsby hosts use this setting.
- If feasible, allowing 1-night stays, especially midweek or during low season, could capture last-minute bookings, as only 17.4% currently do.
- Explore offering discounts for stays of 30+ nights to attract the 8.7% of the market seeking extended stays.
- Adjust minimum nights based on seasonality – potentially shorter during low season and longer during peak demand periods in Grimsby.
Grimsby Airbnb Cancellation Policy Trends Analysis (2025)
Flexible
4 listings
21.1% of total
Moderate
4 listings
21.1% of total
Firm
5 listings
26.3% of total
Strict
6 listings
31.6% of total
Cancellation Policy Insights for Grimsby
- The prevailing Airbnb cancellation policy trend in Grimsby is Strict, used by 31.6% of listings.
- A majority (57.9%) of hosts in Grimsby utilize Firm or Strict policies, indicating a market where hosts prioritize booking security.
Recommendations for Hosts
- Consider adopting a Strict policy to align with the 31.6% market standard in Grimsby.
- With 31.6% using Strict terms, this is a viable option in Grimsby, particularly for high-value properties or during peak demand periods.
- Regularly review your cancellation policy against competitors and market demand shifts in Grimsby.
Grimsby STR Booking Lead Time Analysis (2025)
Average Booking Lead Time by Month
Booking Lead Time Insights for Grimsby
- The overall average booking lead time for vacation rentals in Grimsby is 27 days.
- Guests book furthest in advance for stays during May (average 95 days), likely coinciding with peak travel demand or local events.
- The shortest booking windows occur for stays in March (average 6 days), indicating more last-minute travel plans during this time.
- Seasonally, Spring (40 days avg.) sees the longest lead times, while Fall (19 days avg.) has the shortest, reflecting typical travel planning cycles.
Recommendations for Hosts
- Use the overall average lead time (27 days) as a baseline for your pricing and availability strategy in Grimsby.
- For May stays, consider implementing length-of-stay discounts or slightly higher rates for bookings made less than 95 days out to capitalize on advance planning.
- During March, focus on last-minute booking availability and promotions, as guests book with very short notice (6 days avg.).
- Target marketing efforts for the Spring season well in advance (at least 40 days) to capture early planners.
- Monitor your own booking lead times against these Grimsby averages to identify opportunities for dynamic pricing adjustments.
Popular & Essential Airbnb Amenities in Grimsby (2025)
Amenity Prevalence
Amenity Insights for Grimsby
- Essential amenities in Grimsby that guests expect include: Smoke alarm, TV, Wifi, Heating, Washer. Lacking these (any) could significantly impact bookings.
- Popular amenities like Kitchen, Essentials, Hot water are common but not universal. Offering these can provide a competitive edge.
Recommendations for Hosts
- Ensure your listing includes all essential amenities for Grimsby: Smoke alarm, TV, Wifi, Heating, Washer.
- Prioritize adding missing essentials: Heating, Washer.
- Consider adding popular differentiators like Kitchen or Essentials to increase appeal.
- Highlight unique or less common amenities you offer (e.g., hot tub, dedicated workspace, EV charger) in your listing description and photos.
- Regularly check competitor amenities in Grimsby to stay competitive.
Grimsby Airbnb Guest Demographics & Profile Analysis (2025)
Guest Profile Summary for Grimsby
- The typical guest profile for Airbnb in Grimsby consists of primarily domestic travelers (90%), often arriving from nearby England, typically belonging to the Post-2000s (Gen Z/Alpha) group (50%), primarily speaking English or French.
- Domestic travelers account for 89.6% of guests.
- Key international markets include United Kingdom (89.6%) and China (3.2%).
- Top languages spoken are English (67.6%) followed by French (4.9%).
- A significant demographic segment is the Post-2000s (Gen Z/Alpha) group, representing 50% of guests.
Recommendations for Hosts
- Target domestic marketing efforts towards travelers from England and Newcastle upon Tyne.
- Tailor amenities and listing descriptions to appeal to the dominant Post-2000s (Gen Z/Alpha) demographic (e.g., highlight fast WiFi, smart home features, local guides).
- Highlight unique local experiences or amenities relevant to the primary guest profile.
- Consider seasonal promotions aligned with peak travel times for key origin markets.
Nearby Short-Term Rental Market Comparison
How does the Grimsby Airbnb market stack up against its neighbors? Compare key performance metrics like average monthly revenue, ADR, and occupancy rates in surrounding areas to understand the broader regional STR landscape.
| Market | Active Properties | Monthly Revenue | Daily Rate | Avg. Occupancy |
|---|---|---|---|---|
| Grinton | 14 | $5,456 | $365.05 | 51% |
| Stamford Bridge | 11 | $4,669 | $410.14 | 38% |
| Appleby | 10 | $4,577 | $332.39 | 44% |
| Flore | 10 | $4,534 | $347.03 | 40% |
| Hayton | 13 | $4,333 | $239.53 | 60% |
| Bishop Monkton | 11 | $3,999 | $272.00 | 48% |
| Escrick | 10 | $3,849 | $322.07 | 44% |
| Southburn | 18 | $3,837 | $225.12 | 49% |
| Ravensworth | 10 | $3,717 | $203.76 | 57% |
| Blubberhouses | 11 | $3,457 | $361.37 | 41% |