Gosport Airbnb Market Analysis 2025: Short Term Rental Data & Vacation Rental Statistics in England, United Kingdom
Is Airbnb profitable in Gosport in 2025? Explore comprehensive Airbnb analytics for Gosport, England, United Kingdom to uncover income potential. This 2025 STR market report for Gosport, based on AirROI data from April 2024 to March 2025, reveals key trends in the niche market of 81 active listings.
Whether you're considering an Airbnb investment in Gosport, optimizing your existing vacation rental, or exploring rental arbitrage opportunities, understanding the Gosport Airbnb data is crucial. Leveraging the low regulation environment is key to maximizing your short term rental income potential. Let's dive into the specifics.
Key Gosport Airbnb Performance Metrics Overview
Monthly Airbnb Revenue Variations & Income Potential in Gosport (2025)
Understanding the monthly revenue variations for Airbnb listings in Gosport is key to maximizing your short term rental income potential. Seasonality significantly impacts earnings. Our analysis, based on data from the past 12 months, shows that the peak revenue month for STRs in Gosport is typically May, while March often presents the lowest earnings, highlighting opportunities for strategic pricing adjustments during shoulder and low seasons. Explore the typical Airbnb income in Gosport across different performance tiers:
- Best-in-class properties (Top 10%) achieve $5,688+ monthly, often utilizing dynamic pricing and superior guest experiences.
- Strong performing properties (Top 25%) earn $3,660 or more, indicating effective management and desirable locations/amenities.
- Typical properties (Median) generate around $1,955 per month, representing the average market performance.
- Entry-level properties (Bottom 25%) see earnings around $957, often with potential for optimization.
Average Monthly Airbnb Earnings Trend in Gosport
Gosport Airbnb Occupancy Rate Trends (2025)
Maximize your bookings by understanding the Gosport STR occupancy trends. Seasonal demand shifts significantly influence how often properties are booked. Typically, Julysees the highest demand (peak season occupancy), while March experiences the lowest (low season). Effective strategies, like adjusting minimum stays or offering promotions, can boost occupancy during slower periods. Here's how different property tiers perform in Gosport:
- Best-in-class properties (Top 10%) achieve 77%+ occupancy, indicating high desirability and potentially optimized availability.
- Strong performing properties (Top 25%) maintain 62% or higher occupancy, suggesting good market fit and guest satisfaction.
- Typical properties (Median) have an occupancy rate around 42%.
- Entry-level properties (Bottom 25%) average 18% occupancy, potentially facing higher vacancy.
Average Monthly Occupancy Rate Trend in Gosport
Average Daily Rate (ADR) Airbnb Trends in Gosport (2025)
Effective short term rental pricing strategy in Gosport involves understanding monthly ADR fluctuations. The Average Daily Rate (ADR) for Airbnb in Gosport typically peaks in March and dips lowest during October. Leveraging Airbnb dynamic pricing tools or strategies based on this seasonality can significantly boost revenue. Here's a look at the typical nightly rates achieved:
- Best-in-class properties (Top 10%) command rates of $458+ per night, often due to premium features or locations.
- Strong performing properties (Top 25%) achieve nightly rates of $201 or more.
- Typical properties (Median) charge around $131 per night.
- Entry-level properties (Bottom 25%) earn around $89 per night.
Average Daily Rate (ADR) Trend by Month in Gosport
Get Live Gosport Market Intelligence 👇

Explore Real-time Analytics
Airbnb Seasonality Analysis & Trends in Gosport (2025)
Peak Season (May, June, August)
- Revenue averages $3,698 per month
- Occupancy rates average 47.9%
- Daily rates average $188
Shoulder Season
- Revenue averages $2,837 per month
- Occupancy maintains around 42.8%
- Daily rates hold near $203
Low Season (February, March, November)
- Revenue drops to average $2,060 per month
- Occupancy decreases to average 35.9%
- Daily rates adjust to average $240
Seasonality Insights for Gosport
- The Airbnb seasonality in Gosport shows highly seasonal trends requiring careful strategy. While the sections above show seasonal averages, it's also insightful to look at the extremes:
- During the high season, the absolute peak month showcases Gosport's highest earning potential, with monthly revenues capable of climbing to $3,991, occupancy reaching a high of 54.3%, and ADRs peaking at $261.
- Conversely, the slowest single month of the year, typically falling within the low season, marks the market's lowest point. In this month, revenue might dip to $1,624, occupancy could drop to 28.4%, and ADRs may adjust down to $181.
- Understanding both the seasonal averages and these monthly peaks and troughs in revenue, occupancy, and ADR is crucial for maximizing your Airbnb profit potential in Gosport.
Seasonal Strategies for Maximizing Profit
- Peak Season: Maximize revenue through premium pricing and potentially longer minimum stays. Ensure high availability.
- Low Season: Offer competitive pricing, special promotions (e.g., extended stay discounts), and flexible cancellation policies. Target off-season travelers like remote workers or budget-conscious guests.
- Shoulder Seasons: Implement dynamic pricing that balances peak and low rates. Target weekend travelers or specific events. Offer slightly more flexible terms than peak season.
- Regularly analyze your own performance against these Gosport seasonality benchmarks and adjust your pricing and availability strategy accordingly.
Best Areas for Airbnb Investment in Gosport (2025)
Exploring the top neighborhoods for short-term rentals in Gosport? This section highlights key areas, outlining why they are attractive for hosts and guests, along with notable local attractions. Consider these locations based on your target guest profile and investment strategy.
| Neighborhood / Area | Why Host Here? (Target Guests & Appeal) | Key Attractions & Landmarks |
|---|---|---|
| Gosport Seafront | A picturesque area with stunning views of the Solent, and close to local beaches. Popular with families and tourists looking to enjoy coastal activities and nearby historical sites. | Gosport Beach, Historic Dockyard, Spitbank Fort, The Explosion Museum of Naval Firepower, Gosport Marina |
| Alverstoke | A tranquil suburb of Gosport, known for its charming residential spaces and proximity to the sea. Ideal for long-term guests looking for a peaceful retreat. | Stokes Bay, Alverstoke Church, Gosport waterfront, After Dark Cinema, Local shops and cafés |
| Lee-on-the-Solent | A popular seaside town, ideal for beach lovers and those interested in water sports. Family-friendly with plenty of activities and entertainment. | Lee-on-the-Solent beach, The Solent,, Canoe Lake, Local eateries, Funfair |
| Forton | An area with rich history and close ties to naval heritage. Attractive for guests interested in Gosport's historic background. | Royal Clarence Yard, Gosport's Historic Centre, The Old Grammar School, Local parks and gardens |
| Haslar Marina | A vibrant marina area with a mix of residential and leisure facilities, attracting boating enthusiasts and tourists alike. | Haslar Marina, Haslar Jetty, Gosport Ferry, Restaurants and bars by the water |
| Stokes Bay | Known for its coastal beauty and wide sandy beach, attracting tourists looking for sunbathing and water activities. | Stokes Bay beach, Gosport Golf Club, Adventure golf, Water sports facilities |
| Town Centre | The bustling heart of Gosport, offering plenty of shopping, restaurants, and entertainment. Ideal for guests looking to be in the middle of the action. | Gosport High Street, Libraries, Cinemas, Local events and fairs, Restaurants |
| Rowner | A residential area that offers convenient access to local amenities and transportation links, appealing for longer stays. | Rowner Farm, Local parks, Community centre, Nearby shopping options |
Understanding Airbnb License Requirements & STR Laws in Gosport (2025)
While Gosport, England, United Kingdom currently shows low STR regulations, specific Airbnb license requirements might still exist or change. Always verify the latest short term rental regulations and Airbnb license requirements directly with local government authorities for Gosport to ensure full compliance before hosting.
(Source: AirROI data, 2025, finding no licensed listings among those analyzed)
Top Performing Airbnb Properties in Gosport (2025)
Benchmark your potential! Explore examples of top-performing Airbnb properties in Gosportbased on Trailing Twelve Month (TTM) revenue. Analyze their characteristics, revenue, occupancy rate, and ADR to understand what drives success in this market.

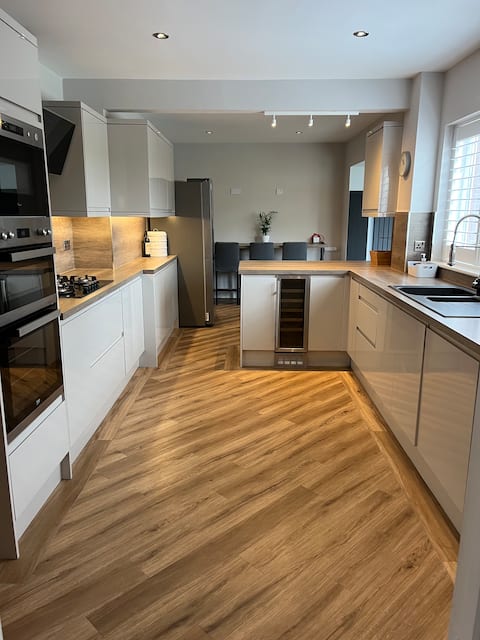
Large Grade II listed Georgian House in Gosport
Entire Place • 6 bedrooms
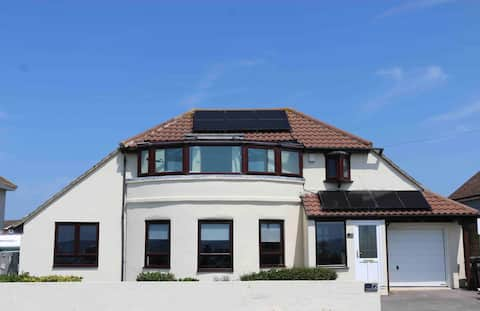
Seaside Stays - Modern 4 bed home with sea views
Entire Place • 4 bedrooms
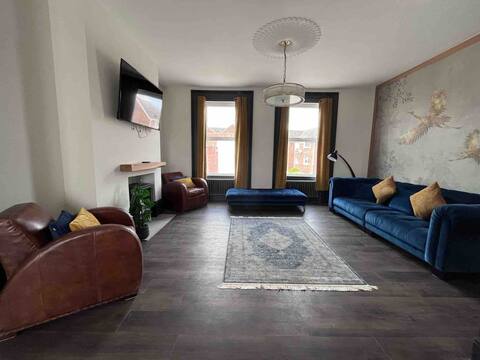
Solent View - panoramic views of the sea & beach
Entire Place • 4 bedrooms

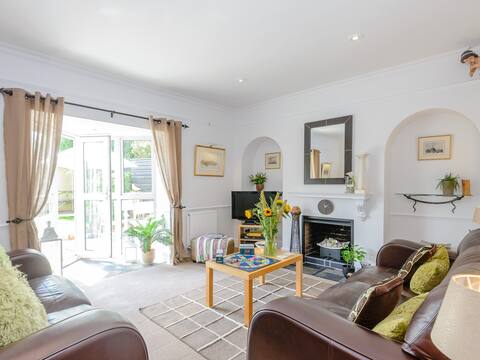
Immaculate 4BD Family Home in Lee on the Solent
Entire Place • 4 bedrooms
Marina Lodge
Entire Place • 3 bedrooms
Number 1 Admiralty Cottages
Entire Place • 2 bedrooms
Note: Performance varies based on location, size, amenities, seasonality, and management quality. Data reflects the past 12 months.
Top Performing Airbnb Hosts in Gosport (2025)
Learn from the best! This table showcases top-performing Airbnb hosts in Gosport based on the number of properties managed and estimated total revenue over the past year. Analyze their scale and performance metrics.
| Host Name | Properties | Grossing Revenue | Stay Reviews | Avg Rating |
|---|---|---|---|---|
| Kate | 2 | $291,876 | 146 | 4.83/5.0 |
| Complete | 12 | $150,370 | 205 | 4.80/5.0 |
| Lily | 2 | $109,235 | 92 | 4.94/5.0 |
| Cottages | 3 | $96,251 | 20 | 3.33/5.0 |
| Reuben | 2 | $90,633 | 70 | 4.88/5.0 |
| Lylie | 2 | $84,681 | 29 | 4.96/5.0 |
| Donna | 2 | $80,553 | 40 | 4.71/5.0 |
| Mark | 1 | $73,467 | 106 | 4.92/5.0 |
| Chen | 4 | $72,084 | 20 | 4.87/5.0 |
| Toby | 1 | $58,365 | 36 | 4.86/5.0 |
Analyzing the strategies of top hosts, such as their property selection, pricing, and guest communication, can offer valuable lessons for optimizing your own Airbnb operations in Gosport.
Dive Deeper: Advanced Gosport STR Market Data (2025)
Ready to unlock more insights? AirROI provides access to advanced metrics and comprehensive Airbnb data for Gosport. Explore detailed analytics beyond this report to refine your investment strategy, optimize pricing, and maximize your vacation rental profits.
Explore Advanced MetricsGosport Short-Term Rental Market Composition (2025): Property & Room Types
Room Type Distribution
Property Type Distribution
Market Composition Insights for Gosport
- The Gosport Airbnb market composition is heavily skewed towards Entire Home/Apt listings, which make up 71.6% of the 81 active rentals. This indicates strong guest preference for privacy and space.
- Looking at the property type distribution in Gosport, House properties are the most common (54.3%), reflecting the local real estate landscape.
- Houses represent a significant 54.3% portion, catering likely to families or larger groups.
- The presence of 8.6% Hotel/Boutique listings indicates integration with traditional hospitality.
- Smaller segments like others (combined 3.7%) offer potential for unique stay experiences.
Gosport Airbnb Room Capacity Analysis (2025): Bedroom Distribution
Distribution of Listings by Number of Bedrooms
Room Capacity Insights for Gosport
- The dominant room capacity in Gosport is 1 bedroom listings, making up 34.6% of the market. This suggests a strong demand for properties suitable for couples or solo travelers.
- Together, 1 bedroom and 2 bedrooms properties represent 58.1% of the active Airbnb listings in Gosport, indicating a high concentration in these sizes.
- A significant 27.1% of listings offer 3+ bedrooms, catering to larger groups and families seeking more space in Gosport.
Gosport Vacation Rental Guest Capacity Trends (2025)
Distribution of Listings by Guest Capacity
Guest Capacity Insights for Gosport
- The most common guest capacity trend in Gosport vacation rentals is listings accommodating 2 guests (22.2%). This suggests the primary traveler segment is likely couples or solo travelers.
- Properties designed for 2 guests and 8+ guests dominate the Gosport STR market, accounting for 38.2% of listings.
- 32.1% of properties accommodate 6+ guests, serving the market segment for larger families or group travel in Gosport.
- On average, properties in Gosport are equipped to host 3.8 guests.
Gosport Airbnb Booking Patterns (2025): Available vs. Booked Days
Available Days Distribution
Booked Days Distribution
Booking Pattern Insights for Gosport
- The most common availability pattern in Gosport falls within the 271-366 days range, representing 45.7% of listings. This suggests many properties have significant open periods on their calendars.
- Approximately 65.5% of listings show high availability (181+ days open annually), indicating potential for increased bookings or specific owner usage patterns.
- For booked days, the 181-270 days range is most frequent in Gosport (30.9%), reflecting common guest stay durations or potential owner blocking patterns.
- A notable 35.8% of properties secure long booking periods (181+ days booked per year), highlighting successful long-term rental strategies or significant owner usage.
Gosport Airbnb Minimum Stay Requirements Analysis
Distribution of Listings by Minimum Night Requirement
1 Night
33 listings
41.8% of total
2 Nights
26 listings
32.9% of total
3 Nights
4 listings
5.1% of total
4-6 Nights
3 listings
3.8% of total
7-29 Nights
2 listings
2.5% of total
30+ Nights
11 listings
13.9% of total
Key Insights
- The most prevalent minimum stay requirement in Gosport is 1 Night, adopted by 41.8% of listings. This highlights the market's preference for shorter, flexible bookings.
- A strong majority (74.7%) of the Gosport Airbnb data shows acceptance of very short stays (1-2 nights), indicating a dynamic, high-turnover market.
- A significant segment (13.9%) caters to monthly stays (30+ nights) in Gosport, pointing to opportunities in the extended-stay market.
Recommendations
- Align with the market by considering a 1 Night minimum stay, as 41.8% of Gosport hosts use this setting.
- Explore offering discounts for stays of 30+ nights to attract the 13.9% of the market seeking extended stays.
- Adjust minimum nights based on seasonality – potentially shorter during low season and longer during peak demand periods in Gosport.
Gosport Airbnb Cancellation Policy Trends Analysis (2025)
Super Strict 60 Days
2 listings
2.7% of total
Flexible
18 listings
24.3% of total
Moderate
27 listings
36.5% of total
Firm
15 listings
20.3% of total
Strict
12 listings
16.2% of total
Cancellation Policy Insights for Gosport
- The prevailing Airbnb cancellation policy trend in Gosport is Moderate, used by 36.5% of listings.
- There's a relatively balanced mix between guest-friendly (60.8%) and stricter (36.5%) policies, offering choices for different guest needs.
Recommendations for Hosts
- Consider adopting a Moderate policy to align with the 36.5% market standard in Gosport.
- Regularly review your cancellation policy against competitors and market demand shifts in Gosport.
Gosport STR Booking Lead Time Analysis (2025)
Average Booking Lead Time by Month
Booking Lead Time Insights for Gosport
- The overall average booking lead time for vacation rentals in Gosport is 55 days.
- Guests book furthest in advance for stays during July (average 91 days), likely coinciding with peak travel demand or local events.
- The shortest booking windows occur for stays in March (average 36 days), indicating more last-minute travel plans during this time.
- Seasonally, Summer (82 days avg.) sees the longest lead times, while Spring (53 days avg.) has the shortest, reflecting typical travel planning cycles.
Recommendations for Hosts
- Use the overall average lead time (55 days) as a baseline for your pricing and availability strategy in Gosport.
- For July stays, consider implementing length-of-stay discounts or slightly higher rates for bookings made less than 91 days out to capitalize on advance planning.
- Target marketing efforts for the Summer season well in advance (at least 82 days) to capture early planners.
- Monitor your own booking lead times against these Gosport averages to identify opportunities for dynamic pricing adjustments.
Popular & Essential Airbnb Amenities in Gosport (2025)
Amenity Prevalence
Amenity Insights for Gosport
- Essential amenities in Gosport that guests expect include: Heating, Wifi, Smoke alarm, TV. Lacking these (any) could significantly impact bookings.
- Popular amenities like Hot water, Bed linens, Kitchen are common but not universal. Offering these can provide a competitive edge.
Recommendations for Hosts
- Ensure your listing includes all essential amenities for Gosport: Heating, Wifi, Smoke alarm, TV.
- Prioritize adding missing essentials: Heating, Wifi, Smoke alarm, TV.
- Consider adding popular differentiators like Hot water or Bed linens to increase appeal.
- Highlight unique or less common amenities you offer (e.g., hot tub, dedicated workspace, EV charger) in your listing description and photos.
- Regularly check competitor amenities in Gosport to stay competitive.
Gosport Airbnb Guest Demographics & Profile Analysis (2025)
Guest Profile Summary for Gosport
- The typical guest profile for Airbnb in Gosport consists of primarily domestic travelers (85%), often arriving from nearby England, typically belonging to the Post-2000s (Gen Z/Alpha) group (50%), primarily speaking English or German.
- Domestic travelers account for 84.7% of guests.
- Key international markets include United Kingdom (84.7%) and United States (4%).
- Top languages spoken are English (71.2%) followed by German (6.8%).
- A significant demographic segment is the Post-2000s (Gen Z/Alpha) group, representing 50% of guests.
Recommendations for Hosts
- Target domestic marketing efforts towards travelers from England and London.
- Tailor amenities and listing descriptions to appeal to the dominant Post-2000s (Gen Z/Alpha) demographic (e.g., highlight fast WiFi, smart home features, local guides).
- Highlight unique local experiences or amenities relevant to the primary guest profile.
- Consider seasonal promotions aligned with peak travel times for key origin markets.
Nearby Short-Term Rental Market Comparison
How does the Gosport Airbnb market stack up against its neighbors? Compare key performance metrics like average monthly revenue, ADR, and occupancy rates in surrounding areas to understand the broader regional STR landscape.
| Market | Active Properties | Monthly Revenue | Daily Rate | Avg. Occupancy |
|---|---|---|---|---|
| Englishcombe | 13 | $8,558 | $573.69 | 49% |
| Dorney | 12 | $8,335 | $622.48 | 45% |
| Chew Magna | 14 | $6,649 | $399.59 | 46% |
| Lambourn | 11 | $6,081 | $669.47 | 28% |
| City of Westminster | 1,327 | $6,043 | $486.66 | 52% |
| Long Sutton | 17 | $5,726 | $383.88 | 46% |
| Stoke St. Michael | 10 | $5,277 | $424.04 | 42% |
| Winsham | 10 | $5,154 | $484.22 | 52% |
| Oldland Common | 13 | $5,093 | $355.47 | 43% |
| Wraysbury | 14 | $4,719 | $396.18 | 46% |