Goonbell Airbnb Market Analysis 2025: Short Term Rental Data & Vacation Rental Statistics in England, United Kingdom
Is Airbnb profitable in Goonbell in 2025? Explore comprehensive Airbnb analytics for Goonbell, England, United Kingdom to uncover income potential. This 2025 STR market report for Goonbell, based on AirROI data from April 2024 to March 2025, reveals key trends in the niche market of 23 active listings.
Whether you're considering an Airbnb investment in Goonbell, optimizing your existing vacation rental, or exploring rental arbitrage opportunities, understanding the Goonbell Airbnb data is crucial. Leveraging the low regulation environment is key to maximizing your short term rental income potential. Let's dive into the specifics.
Key Goonbell Airbnb Performance Metrics Overview
Monthly Airbnb Revenue Variations & Income Potential in Goonbell (2025)
Understanding the monthly revenue variations for Airbnb listings in Goonbell is key to maximizing your short term rental income potential. Seasonality significantly impacts earnings. Our analysis, based on data from the past 12 months, shows that the peak revenue month for STRs in Goonbell is typically August, while March often presents the lowest earnings, highlighting opportunities for strategic pricing adjustments during shoulder and low seasons. Explore the typical Airbnb income in Goonbell across different performance tiers:
- Best-in-class properties (Top 10%) achieve $5,319+ monthly, often utilizing dynamic pricing and superior guest experiences.
- Strong performing properties (Top 25%) earn $3,487 or more, indicating effective management and desirable locations/amenities.
- Typical properties (Median) generate around $2,177 per month, representing the average market performance.
- Entry-level properties (Bottom 25%) see earnings around $1,321, often with potential for optimization.
Average Monthly Airbnb Earnings Trend in Goonbell
Goonbell Airbnb Occupancy Rate Trends (2025)
Maximize your bookings by understanding the Goonbell STR occupancy trends. Seasonal demand shifts significantly influence how often properties are booked. Typically, Augustsees the highest demand (peak season occupancy), while March experiences the lowest (low season). Effective strategies, like adjusting minimum stays or offering promotions, can boost occupancy during slower periods. Here's how different property tiers perform in Goonbell:
- Best-in-class properties (Top 10%) achieve 79%+ occupancy, indicating high desirability and potentially optimized availability.
- Strong performing properties (Top 25%) maintain 67% or higher occupancy, suggesting good market fit and guest satisfaction.
- Typical properties (Median) have an occupancy rate around 47%.
- Entry-level properties (Bottom 25%) average 27% occupancy, potentially facing higher vacancy.
Average Monthly Occupancy Rate Trend in Goonbell
Average Daily Rate (ADR) Airbnb Trends in Goonbell (2025)
Effective short term rental pricing strategy in Goonbell involves understanding monthly ADR fluctuations. The Average Daily Rate (ADR) for Airbnb in Goonbell typically peaks in July and dips lowest during March. Leveraging Airbnb dynamic pricing tools or strategies based on this seasonality can significantly boost revenue. Here's a look at the typical nightly rates achieved:
- Best-in-class properties (Top 10%) command rates of $293+ per night, often due to premium features or locations.
- Strong performing properties (Top 25%) achieve nightly rates of $212 or more.
- Typical properties (Median) charge around $146 per night.
- Entry-level properties (Bottom 25%) earn around $113 per night.
Average Daily Rate (ADR) Trend by Month in Goonbell
Get Live Goonbell Market Intelligence 👇

Explore Real-time Analytics
Airbnb Seasonality Analysis & Trends in Goonbell (2025)
Peak Season (August, July, May)
- Revenue averages $4,875 per month
- Occupancy rates average 68.1%
- Daily rates average $213
Shoulder Season
- Revenue averages $2,614 per month
- Occupancy maintains around 46.7%
- Daily rates hold near $191
Low Season (January, March, November)
- Revenue drops to average $1,335 per month
- Occupancy decreases to average 32.6%
- Daily rates adjust to average $163
Seasonality Insights for Goonbell
- The Airbnb seasonality in Goonbell shows highly seasonal trends requiring careful strategy. While the sections above show seasonal averages, it's also insightful to look at the extremes:
- During the high season, the absolute peak month showcases Goonbell's highest earning potential, with monthly revenues capable of climbing to $5,740, occupancy reaching a high of 81.6%, and ADRs peaking at $213.
- Conversely, the slowest single month of the year, typically falling within the low season, marks the market's lowest point. In this month, revenue might dip to $1,098, occupancy could drop to 26.7%, and ADRs may adjust down to $160.
- Understanding both the seasonal averages and these monthly peaks and troughs in revenue, occupancy, and ADR is crucial for maximizing your Airbnb profit potential in Goonbell.
Seasonal Strategies for Maximizing Profit
- Peak Season: Maximize revenue through premium pricing and potentially longer minimum stays. Ensure high availability.
- Low Season: Offer competitive pricing, special promotions (e.g., extended stay discounts), and flexible cancellation policies. Target off-season travelers like remote workers or budget-conscious guests.
- Shoulder Seasons: Implement dynamic pricing that balances peak and low rates. Target weekend travelers or specific events. Offer slightly more flexible terms than peak season.
- Regularly analyze your own performance against these Goonbell seasonality benchmarks and adjust your pricing and availability strategy accordingly.
Best Areas for Airbnb Investment in Goonbell (2025)
Exploring the top neighborhoods for short-term rentals in Goonbell? This section highlights key areas, outlining why they are attractive for hosts and guests, along with notable local attractions. Consider these locations based on your target guest profile and investment strategy.
| Neighborhood / Area | Why Host Here? (Target Guests & Appeal) | Key Attractions & Landmarks |
|---|---|---|
| Goonbell | A quaint village in Cornwall, known for its picturesque countryside and proximity to the scenic Cornish coast. Ideal for travelers seeking a peaceful retreat away from the hustle and bustle. | The Eden Project, The Lost Gardens of Heligan, Cornwall Coast Path, St Austell Bay, Mevagissey Harbour, Truro Cathedral |
| St Austell | The largest town in Cornwall, offering a mix of local charm, shopping, and attractions. It's a great base for exploring the surrounding region. | St Austell Brewery, Charlestown harbour, Porthpean Beach, Carlyon Bay, Wheal Martyn, Kidzworld |
| Mevagissey | A charming fishing village with narrow streets and beautiful harbor views. Very popular with tourists looking for an authentic Cornish experience. | Mevagissey Harbour, Mevagissey Museum, The Lost Gardens of Heligan, Charlestown, Gorran Haven, Local seafood restaurants |
| Fowey | A historic town at the mouth of the Fowey River, known for its literary connections and stunning river views. Attracts visitors interested in nature and culture. | Fowey Estuary, Fowey River Kayaking, St. Catherine's Castle, The Town of Fowey, The Eden Project nearby, Fowey Museum |
| Looe | A popular seaside resort known for its beaches and charming town center, Looe is favored by both families and couples for its friendly atmosphere. | East Looe Beach, West Looe Beach, Looe Island, The Old Guildhall Museum, Fowey River, Looe to Polperro Walk |
| Bodmin | Rich in history and surrounded by beautiful landscapes, Bodmin offers a blend of adventure and culture, appealing to history enthusiasts and outdoor lovers alike. | Bodmin Jail, Cardinham Woods, Bodmin Beacon, The Camel Trail, Bodmin Moor, St.Piran's Oratory |
| Padstow | A picturesque fishing port famous for its culinary scene and beautiful scenery. A hotspot for food lovers and those wanting to enjoy the coastal charm of Cornwall. | Padstow Harbour, The Camel Trail, Rick Stein's Seafood Restaurant, Beach at Padstow, St. Petroc's Church, National Lobster Hatchery |
| Newquay | Popular for its surfing beaches and vibrant nightlife, Newquay attracts a younger crowd and families looking for fun and adventure. A bustling tourist destination. | Fistral Beach, Towan Beach, Newquay Zoo, Blue Reef Aquarium, Cornwall Aviation Heritage Centre, Newquay Golf Club |
Understanding Airbnb License Requirements & STR Laws in Goonbell (2025)
While Goonbell, England, United Kingdom currently shows low STR regulations, specific Airbnb license requirements might still exist or change. Always verify the latest short term rental regulations and Airbnb license requirements directly with local government authorities for Goonbell to ensure full compliance before hosting.
(Source: AirROI data, 2025, finding no licensed listings among those analyzed)
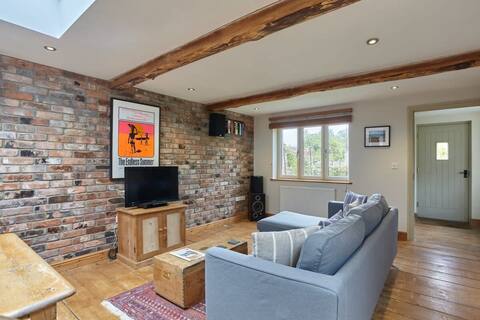
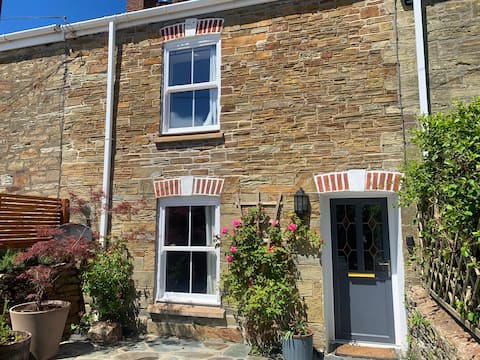
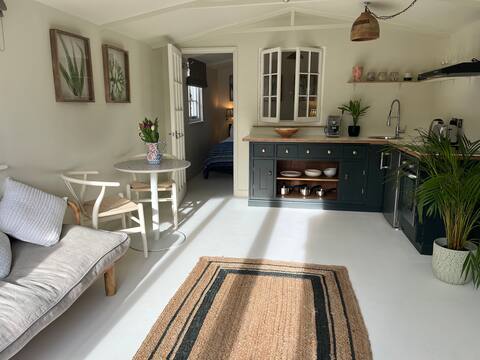
Top Performing Airbnb Properties in Goonbell (2025)
Benchmark your potential! Explore examples of top-performing Airbnb properties in Goonbellbased on Trailing Twelve Month (TTM) revenue. Analyze their characteristics, revenue, occupancy rate, and ADR to understand what drives success in this market.
Cornish Cottage, St Agnes. Free Parking & Garden!
Entire Place • 3 bedrooms

Romantic Converted Barn: Perfect St Agnes Location
Entire Place • 1 bedroom
Beautiful Cottage: Sea Views, Parking, Garden
Entire Place • 2 bedrooms

Charming Cornish Cottage in St Agnes
Entire Place • 3 bedrooms

Two bed holiday cottage in St Agnes
Entire Place • 2 bedrooms
Little White House
Entire Place • 1 bedroom
Note: Performance varies based on location, size, amenities, seasonality, and management quality. Data reflects the past 12 months.
Top Performing Airbnb Hosts in Goonbell (2025)
Learn from the best! This table showcases top-performing Airbnb hosts in Goonbell based on the number of properties managed and estimated total revenue over the past year. Analyze their scale and performance metrics.
| Host Name | Properties | Grossing Revenue | Stay Reviews | Avg Rating |
|---|---|---|---|---|
| William | 1 | $60,070 | 91 | 4.80/5.0 |
| Emma Jane | 1 | $59,409 | 155 | 4.91/5.0 |
| Louis | 1 | $42,939 | 187 | 4.91/5.0 |
| James | 1 | $30,866 | 24 | 4.92/5.0 |
| Sarah | 1 | $30,408 | 47 | 4.94/5.0 |
| Elliot And Becca | 1 | $30,213 | 112 | 4.83/5.0 |
| Heidi | 1 | $24,436 | 98 | 4.93/5.0 |
| Host #190225712 | 1 | $24,149 | 0 | 0.00/5.0 |
| Carolyn | 1 | $23,771 | 95 | 4.95/5.0 |
| Fraser & Melissa | 1 | $23,367 | 34 | 5.00/5.0 |
Analyzing the strategies of top hosts, such as their property selection, pricing, and guest communication, can offer valuable lessons for optimizing your own Airbnb operations in Goonbell.
Dive Deeper: Advanced Goonbell STR Market Data (2025)
Ready to unlock more insights? AirROI provides access to advanced metrics and comprehensive Airbnb data for Goonbell. Explore detailed analytics beyond this report to refine your investment strategy, optimize pricing, and maximize your vacation rental profits.
Explore Advanced MetricsGoonbell Short-Term Rental Market Composition (2025): Property & Room Types
Room Type Distribution
Property Type Distribution
Market Composition Insights for Goonbell
- The Goonbell Airbnb market composition is heavily skewed towards Entire Home/Apt listings, which make up 100% of the 23 active rentals. This indicates strong guest preference for privacy and space.
- Looking at the property type distribution in Goonbell, House properties are the most common (69.6%), reflecting the local real estate landscape.
- Houses represent a significant 69.6% portion, catering likely to families or larger groups.
- The presence of 8.7% Hotel/Boutique listings indicates integration with traditional hospitality.
- Smaller segments like others, unique stays, apartment/condo (combined 12.9%) offer potential for unique stay experiences.
Goonbell Airbnb Room Capacity Analysis (2025): Bedroom Distribution
Distribution of Listings by Number of Bedrooms
Room Capacity Insights for Goonbell
- The dominant room capacity in Goonbell is 1 bedroom listings, making up 47.8% of the market. This suggests a strong demand for properties suitable for couples or solo travelers.
- Together, 1 bedroom and 2 bedrooms properties represent 78.2% of the active Airbnb listings in Goonbell, indicating a high concentration in these sizes.
- A significant 21.7% of listings offer 3+ bedrooms, catering to larger groups and families seeking more space in Goonbell.
Goonbell Vacation Rental Guest Capacity Trends (2025)
Distribution of Listings by Guest Capacity
Guest Capacity Insights for Goonbell
- The most common guest capacity trend in Goonbell vacation rentals is listings accommodating 2 guests (43.5%). This suggests the primary traveler segment is likely couples or solo travelers.
- Properties designed for 2 guests and 4 guests dominate the Goonbell STR market, accounting for 65.2% of listings.
- A significant 43.5% of listings cater specifically to 1-2 guests, highlighting strong demand from couples and solo travelers in Goonbell.
- 17.3% of properties accommodate 6+ guests, serving the market segment for larger families or group travel in Goonbell.
- On average, properties in Goonbell are equipped to host 3.7 guests.
Goonbell Airbnb Booking Patterns (2025): Available vs. Booked Days
Available Days Distribution
Booked Days Distribution
Booking Pattern Insights for Goonbell
- The most common availability pattern in Goonbell falls within the 181-270 days range, representing 52.2% of listings. This suggests many properties have significant open periods on their calendars.
- Approximately 82.6% of listings show high availability (181+ days open annually), indicating potential for increased bookings or specific owner usage patterns.
- For booked days, the 91-180 days range is most frequent in Goonbell (52.2%), reflecting common guest stay durations or potential owner blocking patterns.
- A notable 21.7% of properties secure long booking periods (181+ days booked per year), highlighting successful long-term rental strategies or significant owner usage.
Goonbell Airbnb Minimum Stay Requirements Analysis
Distribution of Listings by Minimum Night Requirement
1 Night
2 listings
9.1% of total
2 Nights
5 listings
22.7% of total
3 Nights
8 listings
36.4% of total
4-6 Nights
4 listings
18.2% of total
7-29 Nights
1 listings
4.5% of total
30+ Nights
2 listings
9.1% of total
Key Insights
- The most prevalent minimum stay requirement in Goonbell is 3 Nights, adopted by 36.4% of listings. This highlights the market's preference for longer commitments.
Recommendations
- Align with the market by considering a 3 Nights minimum stay, as 36.4% of Goonbell hosts use this setting.
- If feasible, allowing 1-night stays, especially midweek or during low season, could capture last-minute bookings, as only 9.1% currently do.
- Explore offering discounts for stays of 30+ nights to attract the 9.1% of the market seeking extended stays.
- Adjust minimum nights based on seasonality – potentially shorter during low season and longer during peak demand periods in Goonbell.
Goonbell Airbnb Cancellation Policy Trends Analysis (2025)
Flexible
5 listings
23.8% of total
Moderate
4 listings
19% of total
Firm
7 listings
33.3% of total
Strict
5 listings
23.8% of total
Cancellation Policy Insights for Goonbell
- The prevailing Airbnb cancellation policy trend in Goonbell is Firm, used by 33.3% of listings.
- A majority (57.1%) of hosts in Goonbell utilize Firm or Strict policies, indicating a market where hosts prioritize booking security.
Recommendations for Hosts
- Consider adopting a Firm policy to align with the 33.3% market standard in Goonbell.
- Regularly review your cancellation policy against competitors and market demand shifts in Goonbell.
Goonbell STR Booking Lead Time Analysis (2025)
Average Booking Lead Time by Month
Booking Lead Time Insights for Goonbell
- The overall average booking lead time for vacation rentals in Goonbell is 64 days.
- Guests book furthest in advance for stays during June (average 112 days), likely coinciding with peak travel demand or local events.
- The shortest booking windows occur for stays in February (average 21 days), indicating more last-minute travel plans during this time.
- Seasonally, Summer (92 days avg.) sees the longest lead times, while Winter (49 days avg.) has the shortest, reflecting typical travel planning cycles.
Recommendations for Hosts
- Use the overall average lead time (64 days) as a baseline for your pricing and availability strategy in Goonbell.
- For June stays, consider implementing length-of-stay discounts or slightly higher rates for bookings made less than 112 days out to capitalize on advance planning.
- Target marketing efforts for the Summer season well in advance (at least 92 days) to capture early planners.
- Monitor your own booking lead times against these Goonbell averages to identify opportunities for dynamic pricing adjustments.
Popular & Essential Airbnb Amenities in Goonbell (2025)
Amenity Prevalence
Amenity Insights for Goonbell
- Essential amenities in Goonbell that guests expect include: Dishes and silverware, Heating, Hot water, TV, Smoke alarm. Lacking these (any) could significantly impact bookings.
- Popular amenities like Kitchen, Wifi, Cooking basics are common but not universal. Offering these can provide a competitive edge.
- Warning: Wifi is not universally provided but is considered essential globally. Ensure reliable Wifi is offered.
Recommendations for Hosts
- Ensure your listing includes all essential amenities for Goonbell: Dishes and silverware, Heating, Hot water, TV, Smoke alarm.
- Prioritize adding missing essentials: Dishes and silverware, Heating, Hot water, TV, Smoke alarm.
- Consider adding popular differentiators like Kitchen or Wifi to increase appeal.
- Highlight unique or less common amenities you offer (e.g., hot tub, dedicated workspace, EV charger) in your listing description and photos.
- Regularly check competitor amenities in Goonbell to stay competitive.
Goonbell Airbnb Guest Demographics & Profile Analysis (2025)
Guest Profile Summary for Goonbell
- The typical guest profile for Airbnb in Goonbell consists of primarily domestic travelers (90%), often arriving from nearby England, typically belonging to the Post-2000s (Gen Z/Alpha) group (50%), primarily speaking English or French.
- Domestic travelers account for 89.5% of guests.
- Key international markets include United Kingdom (89.5%) and Germany (2.4%).
- Top languages spoken are English (70.8%) followed by French (10.1%).
- A significant demographic segment is the Post-2000s (Gen Z/Alpha) group, representing 50% of guests.
Recommendations for Hosts
- Target domestic marketing efforts towards travelers from England and London.
- Tailor amenities and listing descriptions to appeal to the dominant Post-2000s (Gen Z/Alpha) demographic (e.g., highlight fast WiFi, smart home features, local guides).
- Highlight unique local experiences or amenities relevant to the primary guest profile.
- Consider seasonal promotions aligned with peak travel times for key origin markets.
Nearby Short-Term Rental Market Comparison
How does the Goonbell Airbnb market stack up against its neighbors? Compare key performance metrics like average monthly revenue, ADR, and occupancy rates in surrounding areas to understand the broader regional STR landscape.
| Market | Active Properties | Monthly Revenue | Daily Rate | Avg. Occupancy |
|---|---|---|---|---|
| Llanrhidian | 15 | $4,842 | $386.18 | 53% |
| Trenance | 19 | $4,795 | $428.63 | 43% |
| Angle | 13 | $4,602 | $384.81 | 42% |
| Ludchurch | 15 | $4,354 | $291.87 | 43% |
| Redberth | 29 | $4,103 | $223.37 | 59% |
| Higher Crackington | 17 | $3,731 | $340.74 | 37% |
| Perranuthnoe | 24 | $3,421 | $352.15 | 37% |
| St. John | 44 | $3,354 | $233.49 | 50% |
| Llanboidy | 10 | $3,280 | $260.08 | 45% |
| Llangennith | 32 | $3,271 | $251.71 | 52% |