Fareham Airbnb Market Analysis 2025: Short Term Rental Data & Vacation Rental Statistics in England, United Kingdom
Is Airbnb profitable in Fareham in 2025? Explore comprehensive Airbnb analytics for Fareham, England, United Kingdom to uncover income potential. This 2025 STR market report for Fareham, based on AirROI data from April 2024 to March 2025, reveals key trends in the niche market of 119 active listings.
Whether you're considering an Airbnb investment in Fareham, optimizing your existing vacation rental, or exploring rental arbitrage opportunities, understanding the Fareham Airbnb data is crucial. Leveraging the low regulation environment is key to maximizing your short term rental income potential. Let's dive into the specifics.
Key Fareham Airbnb Performance Metrics Overview
Monthly Airbnb Revenue Variations & Income Potential in Fareham (2025)
Understanding the monthly revenue variations for Airbnb listings in Fareham is key to maximizing your short term rental income potential. Seasonality significantly impacts earnings. Our analysis, based on data from the past 12 months, shows that the peak revenue month for STRs in Fareham is typically July, while March often presents the lowest earnings, highlighting opportunities for strategic pricing adjustments during shoulder and low seasons. Explore the typical Airbnb income in Fareham across different performance tiers:
- Best-in-class properties (Top 10%) achieve $4,115+ monthly, often utilizing dynamic pricing and superior guest experiences.
- Strong performing properties (Top 25%) earn $2,763 or more, indicating effective management and desirable locations/amenities.
- Typical properties (Median) generate around $1,725 per month, representing the average market performance.
- Entry-level properties (Bottom 25%) see earnings around $895, often with potential for optimization.
Average Monthly Airbnb Earnings Trend in Fareham
Fareham Airbnb Occupancy Rate Trends (2025)
Maximize your bookings by understanding the Fareham STR occupancy trends. Seasonal demand shifts significantly influence how often properties are booked. Typically, Julysees the highest demand (peak season occupancy), while January experiences the lowest (low season). Effective strategies, like adjusting minimum stays or offering promotions, can boost occupancy during slower periods. Here's how different property tiers perform in Fareham:
- Best-in-class properties (Top 10%) achieve 84%+ occupancy, indicating high desirability and potentially optimized availability.
- Strong performing properties (Top 25%) maintain 70% or higher occupancy, suggesting good market fit and guest satisfaction.
- Typical properties (Median) have an occupancy rate around 46%.
- Entry-level properties (Bottom 25%) average 23% occupancy, potentially facing higher vacancy.
Average Monthly Occupancy Rate Trend in Fareham
Average Daily Rate (ADR) Airbnb Trends in Fareham (2025)
Effective short term rental pricing strategy in Fareham involves understanding monthly ADR fluctuations. The Average Daily Rate (ADR) for Airbnb in Fareham typically peaks in August and dips lowest during November. Leveraging Airbnb dynamic pricing tools or strategies based on this seasonality can significantly boost revenue. Here's a look at the typical nightly rates achieved:
- Best-in-class properties (Top 10%) command rates of $277+ per night, often due to premium features or locations.
- Strong performing properties (Top 25%) achieve nightly rates of $163 or more.
- Typical properties (Median) charge around $121 per night.
- Entry-level properties (Bottom 25%) earn around $85 per night.
Average Daily Rate (ADR) Trend by Month in Fareham
Get Live Fareham Market Intelligence 👇

Explore Real-time Analytics
Airbnb Seasonality Analysis & Trends in Fareham (2025)
Peak Season (July, June, May)
- Revenue averages $2,945 per month
- Occupancy rates average 52.5%
- Daily rates average $197
Shoulder Season
- Revenue averages $2,195 per month
- Occupancy maintains around 48.0%
- Daily rates hold near $184
Low Season (January, February, March)
- Revenue drops to average $1,565 per month
- Occupancy decreases to average 40.4%
- Daily rates adjust to average $163
Seasonality Insights for Fareham
- The Airbnb seasonality in Fareham shows highly seasonal trends requiring careful strategy. While the sections above show seasonal averages, it's also insightful to look at the extremes:
- During the high season, the absolute peak month showcases Fareham's highest earning potential, with monthly revenues capable of climbing to $3,173, occupancy reaching a high of 59.0%, and ADRs peaking at $201.
- Conversely, the slowest single month of the year, typically falling within the low season, marks the market's lowest point. In this month, revenue might dip to $1,514, occupancy could drop to 38.4%, and ADRs may adjust down to $157.
- Understanding both the seasonal averages and these monthly peaks and troughs in revenue, occupancy, and ADR is crucial for maximizing your Airbnb profit potential in Fareham.
Seasonal Strategies for Maximizing Profit
- Peak Season: Maximize revenue through premium pricing and potentially longer minimum stays. Ensure high availability.
- Low Season: Offer competitive pricing, special promotions (e.g., extended stay discounts), and flexible cancellation policies. Target off-season travelers like remote workers or budget-conscious guests.
- Shoulder Seasons: Implement dynamic pricing that balances peak and low rates. Target weekend travelers or specific events. Offer slightly more flexible terms than peak season.
- Regularly analyze your own performance against these Fareham seasonality benchmarks and adjust your pricing and availability strategy accordingly.
Best Areas for Airbnb Investment in Fareham (2025)
Exploring the top neighborhoods for short-term rentals in Fareham? This section highlights key areas, outlining why they are attractive for hosts and guests, along with notable local attractions. Consider these locations based on your target guest profile and investment strategy.
| Neighborhood / Area | Why Host Here? (Target Guests & Appeal) | Key Attractions & Landmarks |
|---|---|---|
| Fareham Town Centre | The vibrant center of Fareham with a mix of shops, restaurants, and cultural attractions. Ideal for guests wanting to explore the local nightlife and dining options. | Fareham Shopping Centre, Red Lion Hotel, Fareham Library, The Ashcroft Arts Centre, Fareham Quay |
| Portchester | A suburb of Fareham with historical significance and ample outdoor space. Popular for its scenic views and proximity to the coastline. | Portchester Castle, Portsmouth Harbour, The Solent, Portchester Common, The Foreshore |
| Warsash | A charming village on the banks of the River Hamble, known for its picturesque scenery and watersports activities. Great for visitors seeking a tranquil environment with access to nature. | Hamble River, Warsash Common, The Waterfront, Watersports activities, Marina |
| Lee-on-the-Solent | A popular seaside resort with a lovely beach, ideal for families and holidaymakers looking for a coastal retreat with various amenities. | Lee-on-the-Solent beach, The Solent shoreline, Royal Naval Museum, Gosport Ferry, Seafront attractions |
| Stubbington | A quaint village with a strong community feel, perfect for families visiting Fareham. Offers a charming environment with access to local parks. | Stubbington Village, The Wild Grounds, Stubbington Green, Local shops and cafes, Beaches |
| Titchfield | A historic village with medieval buildings and nearby nature reserves, appealing to those interested in history and outdoor activities. | Titchfield Abbey, Titchfield Haven National Nature Reserve, Local parks, Village shops, Historic buildings |
| Fareham Creek | An area with stunning views of the creek, popular for walkers and those looking to relax near nature, attracting visitors who enjoy outdoor activities. | Fareham Creek, Hiking trails, Scenic viewpoints, Bird watching, Nearby pubs and cafes |
| Swanwick | A pleasant area close to the River Hamble, known for its marina and sailing activities. Attracts boating enthusiasts and those looking for a leisure-focused stay. | Swanwick Marina, The Hamble River, Restaurants and cafes, Boating activities, Scenic walks |
Understanding Airbnb License Requirements & STR Laws in Fareham (2025)
While Fareham, England, United Kingdom currently shows low STR regulations, specific Airbnb license requirements might still exist or change. Always verify the latest short term rental regulations and Airbnb license requirements directly with local government authorities for Fareham to ensure full compliance before hosting.
(Source: AirROI data, 2025, based on 1% licensed listings)
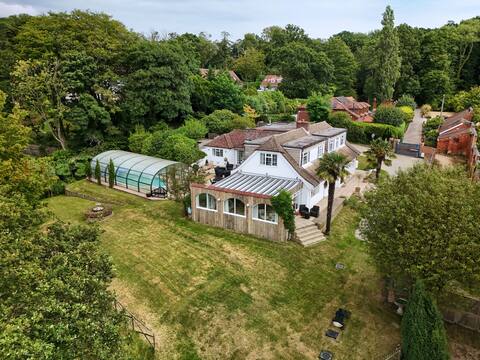
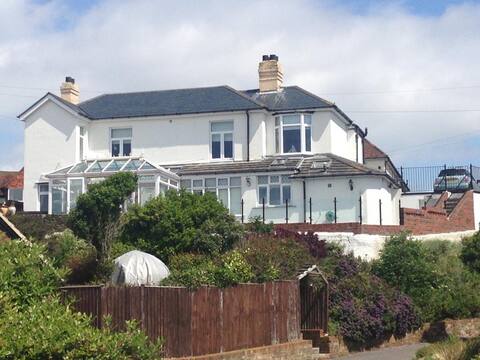
Top Performing Airbnb Properties in Fareham (2025)
Benchmark your potential! Explore examples of top-performing Airbnb properties in Farehambased on Trailing Twelve Month (TTM) revenue. Analyze their characteristics, revenue, occupancy rate, and ADR to understand what drives success in this market.

River property with Heated Pool & Games Room
Entire Place • 8 bedrooms
Stunning 5BR Waterfront Home w/Pool & River Access
Entire Place • 5 bedrooms
Idyllic beach house
Entire Place • 4 bedrooms

A touch of luxury near to the beach
Entire Place • 4 bedrooms

Hill Road House -Family home with Indoor Pool /Spa
Entire Place • 5 bedrooms

*Breakfast With A View* Free Parking*Water Access*
Entire Place • 3 bedrooms
Note: Performance varies based on location, size, amenities, seasonality, and management quality. Data reflects the past 12 months.
Top Performing Airbnb Hosts in Fareham (2025)
Learn from the best! This table showcases top-performing Airbnb hosts in Fareham based on the number of properties managed and estimated total revenue over the past year. Analyze their scale and performance metrics.
| Host Name | Properties | Grossing Revenue | Stay Reviews | Avg Rating |
|---|---|---|---|---|
| Jackie | 6 | $273,416 | 260 | 4.82/5.0 |
| Natasha | 8 | $124,603 | 44 | 2.89/5.0 |
| Susan | 2 | $100,757 | 102 | 4.94/5.0 |
| Yas | 1 | $75,251 | 13 | 5.00/5.0 |
| Lina | 1 | $74,927 | 127 | 4.98/5.0 |
| Steven | 7 | $73,919 | 162 | 4.25/5.0 |
| Jill | 2 | $70,085 | 312 | 4.89/5.0 |
| Thomas | 1 | $65,380 | 99 | 4.65/5.0 |
| Air Maison | 1 | $57,436 | 147 | 4.90/5.0 |
| Tina | 1 | $55,430 | 49 | 4.90/5.0 |
Analyzing the strategies of top hosts, such as their property selection, pricing, and guest communication, can offer valuable lessons for optimizing your own Airbnb operations in Fareham.
Dive Deeper: Advanced Fareham STR Market Data (2025)
Ready to unlock more insights? AirROI provides access to advanced metrics and comprehensive Airbnb data for Fareham. Explore detailed analytics beyond this report to refine your investment strategy, optimize pricing, and maximize your vacation rental profits.
Explore Advanced MetricsFareham Short-Term Rental Market Composition (2025): Property & Room Types
Room Type Distribution
Property Type Distribution
Market Composition Insights for Fareham
- The Fareham Airbnb market composition is heavily skewed towards Entire Home/Apt listings, which make up 65.5% of the 119 active rentals. This indicates strong guest preference for privacy and space.
- However, a notable 34.5% share for Private Rooms suggests opportunities for budget-conscious travelers or hosts renting out spare rooms.
- Looking at the property type distribution in Fareham, House properties are the most common (52.1%), reflecting the local real estate landscape.
- Houses represent a significant 52.1% portion, catering likely to families or larger groups.
- The presence of 15.1% Hotel/Boutique listings indicates integration with traditional hospitality.
Fareham Airbnb Room Capacity Analysis (2025): Bedroom Distribution
Distribution of Listings by Number of Bedrooms
Room Capacity Insights for Fareham
- The dominant room capacity in Fareham is 1 bedroom listings, making up 42.9% of the market. This suggests a strong demand for properties suitable for couples or solo travelers.
- Together, 1 bedroom and 2 bedrooms properties represent 67.3% of the active Airbnb listings in Fareham, indicating a high concentration in these sizes.
Fareham Vacation Rental Guest Capacity Trends (2025)
Distribution of Listings by Guest Capacity
Guest Capacity Insights for Fareham
- The most common guest capacity trend in Fareham vacation rentals is listings accommodating 2 guests (34.5%). This suggests the primary traveler segment is likely couples or solo travelers.
- Properties designed for 2 guests and 4 guests dominate the Fareham STR market, accounting for 51.3% of listings.
- 17.6% of properties accommodate 6+ guests, serving the market segment for larger families or group travel in Fareham.
- On average, properties in Fareham are equipped to host 2.9 guests.
Fareham Airbnb Booking Patterns (2025): Available vs. Booked Days
Available Days Distribution
Booked Days Distribution
Booking Pattern Insights for Fareham
- The most common availability pattern in Fareham falls within the 271-366 days range, representing 32.8% of listings. This suggests many properties have significant open periods on their calendars.
- Approximately 61.4% of listings show high availability (181+ days open annually), indicating potential for increased bookings or specific owner usage patterns.
- For booked days, the 91-180 days range is most frequent in Fareham (28.6%), reflecting common guest stay durations or potential owner blocking patterns.
- A notable 38.7% of properties secure long booking periods (181+ days booked per year), highlighting successful long-term rental strategies or significant owner usage.
Fareham Airbnb Minimum Stay Requirements Analysis
Distribution of Listings by Minimum Night Requirement
1 Night
40 listings
36% of total
2 Nights
43 listings
38.7% of total
3 Nights
15 listings
13.5% of total
4-6 Nights
2 listings
1.8% of total
7-29 Nights
1 listings
0.9% of total
30+ Nights
10 listings
9% of total
Key Insights
- The most prevalent minimum stay requirement in Fareham is 2 Nights, adopted by 38.7% of listings. This highlights the market's preference for shorter, flexible bookings.
- A strong majority (74.7%) of the Fareham Airbnb data shows acceptance of very short stays (1-2 nights), indicating a dynamic, high-turnover market.
Recommendations
- Align with the market by considering a 2 Nights minimum stay, as 38.7% of Fareham hosts use this setting.
- Explore offering discounts for stays of 30+ nights to attract the 9% of the market seeking extended stays.
- Adjust minimum nights based on seasonality – potentially shorter during low season and longer during peak demand periods in Fareham.
Fareham Airbnb Cancellation Policy Trends Analysis (2025)
Flexible
48 listings
44.4% of total
Moderate
32 listings
29.6% of total
Firm
12 listings
11.1% of total
Strict
16 listings
14.8% of total
Cancellation Policy Insights for Fareham
- The prevailing Airbnb cancellation policy trend in Fareham is Flexible, used by 44.4% of listings.
- The market strongly favors guest-friendly terms, with 74.0% of listings offering Flexible or Moderate policies. This suggests guests in Fareham may expect booking flexibility.
Recommendations for Hosts
- Consider adopting a Flexible policy to align with the 44.4% market standard in Fareham.
- Using a Strict policy might deter some guests, as only 14.8% of listings use it. Evaluate if potential revenue protection outweighs possible lower booking rates.
- Regularly review your cancellation policy against competitors and market demand shifts in Fareham.
Fareham STR Booking Lead Time Analysis (2025)
Average Booking Lead Time by Month
Booking Lead Time Insights for Fareham
- The overall average booking lead time for vacation rentals in Fareham is 56 days.
- Guests book furthest in advance for stays during July (average 82 days), likely coinciding with peak travel demand or local events.
- The shortest booking windows occur for stays in March (average 36 days), indicating more last-minute travel plans during this time.
- Seasonally, Summer (79 days avg.) sees the longest lead times, while Spring (54 days avg.) has the shortest, reflecting typical travel planning cycles.
Recommendations for Hosts
- Use the overall average lead time (56 days) as a baseline for your pricing and availability strategy in Fareham.
- For July stays, consider implementing length-of-stay discounts or slightly higher rates for bookings made less than 82 days out to capitalize on advance planning.
- Target marketing efforts for the Summer season well in advance (at least 79 days) to capture early planners.
- Monitor your own booking lead times against these Fareham averages to identify opportunities for dynamic pricing adjustments.
Popular & Essential Airbnb Amenities in Fareham (2025)
Amenity Prevalence
Amenity Insights for Fareham
- Essential amenities in Fareham that guests expect include: Smoke alarm, Wifi. Lacking these (any) could significantly impact bookings.
- Popular amenities like Free parking on premises, Heating, TV are common but not universal. Offering these can provide a competitive edge.
Recommendations for Hosts
- Ensure your listing includes all essential amenities for Fareham: Smoke alarm, Wifi.
- Prioritize adding missing essentials: Smoke alarm, Wifi.
- Consider adding popular differentiators like Free parking on premises or Heating to increase appeal.
- Highlight unique or less common amenities you offer (e.g., hot tub, dedicated workspace, EV charger) in your listing description and photos.
- Regularly check competitor amenities in Fareham to stay competitive.
Fareham Airbnb Guest Demographics & Profile Analysis (2025)
Guest Profile Summary for Fareham
- The typical guest profile for Airbnb in Fareham consists of primarily domestic travelers (87%), often arriving from nearby England, typically belonging to the Post-2000s (Gen Z/Alpha) group (50%), primarily speaking English or French.
- Domestic travelers account for 86.7% of guests.
- Key international markets include United Kingdom (86.7%) and United States (1.8%).
- Top languages spoken are English (65.5%) followed by French (7.5%).
- A significant demographic segment is the Post-2000s (Gen Z/Alpha) group, representing 50% of guests.
Recommendations for Hosts
- Target domestic marketing efforts towards travelers from England and London.
- Tailor amenities and listing descriptions to appeal to the dominant Post-2000s (Gen Z/Alpha) demographic (e.g., highlight fast WiFi, smart home features, local guides).
- Highlight unique local experiences or amenities relevant to the primary guest profile.
- Consider seasonal promotions aligned with peak travel times for key origin markets.
Nearby Short-Term Rental Market Comparison
How does the Fareham Airbnb market stack up against its neighbors? Compare key performance metrics like average monthly revenue, ADR, and occupancy rates in surrounding areas to understand the broader regional STR landscape.
| Market | Active Properties | Monthly Revenue | Daily Rate | Avg. Occupancy |
|---|---|---|---|---|
| Englishcombe | 13 | $8,558 | $573.69 | 49% |
| Dorney | 12 | $8,335 | $622.48 | 45% |
| Chew Magna | 14 | $6,649 | $399.59 | 46% |
| Lambourn | 11 | $6,081 | $669.47 | 28% |
| City of Westminster | 1,327 | $6,043 | $486.66 | 52% |
| Long Sutton | 17 | $5,726 | $383.88 | 46% |
| Stoke St. Michael | 10 | $5,277 | $424.04 | 42% |
| Winsham | 10 | $5,154 | $484.22 | 52% |
| Oldland Common | 13 | $5,093 | $355.47 | 43% |
| Wraysbury | 14 | $4,719 | $396.18 | 46% |