Epping Forest Airbnb Market Analysis 2025: Short Term Rental Data & Vacation Rental Statistics in England, United Kingdom
Is Airbnb profitable in Epping Forest in 2025? Explore comprehensive Airbnb analytics for Epping Forest, England, United Kingdom to uncover income potential. This 2025 STR market report for Epping Forest, based on AirROI data from April 2024 to March 2025, reveals key trends in the niche market of 122 active listings.
Whether you're considering an Airbnb investment in Epping Forest, optimizing your existing vacation rental, or exploring rental arbitrage opportunities, understanding the Epping Forest Airbnb data is crucial. Leveraging the low regulation environment is key to maximizing your short term rental income potential. Let's dive into the specifics.
Key Epping Forest Airbnb Performance Metrics Overview
Monthly Airbnb Revenue Variations & Income Potential in Epping Forest (2025)
Understanding the monthly revenue variations for Airbnb listings in Epping Forest is key to maximizing your short term rental income potential. Seasonality significantly impacts earnings. Our analysis, based on data from the past 12 months, shows that the peak revenue month for STRs in Epping Forest is typically December, while March often presents the lowest earnings, highlighting opportunities for strategic pricing adjustments during shoulder and low seasons. Explore the typical Airbnb income in Epping Forest across different performance tiers:
- Best-in-class properties (Top 10%) achieve $6,678+ monthly, often utilizing dynamic pricing and superior guest experiences.
- Strong performing properties (Top 25%) earn $4,249 or more, indicating effective management and desirable locations/amenities.
- Typical properties (Median) generate around $2,296 per month, representing the average market performance.
- Entry-level properties (Bottom 25%) see earnings around $1,037, often with potential for optimization.
Average Monthly Airbnb Earnings Trend in Epping Forest
Epping Forest Airbnb Occupancy Rate Trends (2025)
Maximize your bookings by understanding the Epping Forest STR occupancy trends. Seasonal demand shifts significantly influence how often properties are booked. Typically, Julysees the highest demand (peak season occupancy), while January experiences the lowest (low season). Effective strategies, like adjusting minimum stays or offering promotions, can boost occupancy during slower periods. Here's how different property tiers perform in Epping Forest:
- Best-in-class properties (Top 10%) achieve 85%+ occupancy, indicating high desirability and potentially optimized availability.
- Strong performing properties (Top 25%) maintain 71% or higher occupancy, suggesting good market fit and guest satisfaction.
- Typical properties (Median) have an occupancy rate around 47%.
- Entry-level properties (Bottom 25%) average 24% occupancy, potentially facing higher vacancy.
Average Monthly Occupancy Rate Trend in Epping Forest
Average Daily Rate (ADR) Airbnb Trends in Epping Forest (2025)
Effective short term rental pricing strategy in Epping Forest involves understanding monthly ADR fluctuations. The Average Daily Rate (ADR) for Airbnb in Epping Forest typically peaks in December and dips lowest during November. Leveraging Airbnb dynamic pricing tools or strategies based on this seasonality can significantly boost revenue. Here's a look at the typical nightly rates achieved:
- Best-in-class properties (Top 10%) command rates of $360+ per night, often due to premium features or locations.
- Strong performing properties (Top 25%) achieve nightly rates of $215 or more.
- Typical properties (Median) charge around $138 per night.
- Entry-level properties (Bottom 25%) earn around $85 per night.
Average Daily Rate (ADR) Trend by Month in Epping Forest
Get Live Epping Forest Market Intelligence 👇

Explore Real-time Analytics
Airbnb Seasonality Analysis & Trends in Epping Forest (2025)
Peak Season (December, May, July)
- Revenue averages $3,867 per month
- Occupancy rates average 51.7%
- Daily rates average $220
Shoulder Season
- Revenue averages $3,381 per month
- Occupancy maintains around 48.9%
- Daily rates hold near $215
Low Season (January, March, November)
- Revenue drops to average $2,669 per month
- Occupancy decreases to average 41.3%
- Daily rates adjust to average $198
Seasonality Insights for Epping Forest
- The Airbnb seasonality in Epping Forest shows moderate seasonality with distinct peak and low periods. While the sections above show seasonal averages, it's also insightful to look at the extremes:
- During the high season, the absolute peak month showcases Epping Forest's highest earning potential, with monthly revenues capable of climbing to $3,981, occupancy reaching a high of 55.8%, and ADRs peaking at $221.
- Conversely, the slowest single month of the year, typically falling within the low season, marks the market's lowest point. In this month, revenue might dip to $2,522, occupancy could drop to 37.5%, and ADRs may adjust down to $191.
- Understanding both the seasonal averages and these monthly peaks and troughs in revenue, occupancy, and ADR is crucial for maximizing your Airbnb profit potential in Epping Forest.
Seasonal Strategies for Maximizing Profit
- Peak Season: Maximize revenue through premium pricing and potentially longer minimum stays. Ensure high availability.
- Low Season: Offer competitive pricing, special promotions (e.g., extended stay discounts), and flexible cancellation policies. Target off-season travelers like remote workers or budget-conscious guests.
- Shoulder Seasons: Implement dynamic pricing that balances peak and low rates. Target weekend travelers or specific events. Offer slightly more flexible terms than peak season.
- Regularly analyze your own performance against these Epping Forest seasonality benchmarks and adjust your pricing and availability strategy accordingly.
Best Areas for Airbnb Investment in Epping Forest (2025)
Exploring the top neighborhoods for short-term rentals in Epping Forest? This section highlights key areas, outlining why they are attractive for hosts and guests, along with notable local attractions. Consider these locations based on your target guest profile and investment strategy.
| Neighborhood / Area | Why Host Here? (Target Guests & Appeal) | Key Attractions & Landmarks |
|---|---|---|
| Loughton | Charming market town with a mix of natural beauty and urban amenities, attracting both tourists and weekend getaways close to Epping Forest. | Epping Forest, Loughton High Road, The Drive, Roding Valley Nature Reserve, Ongar Road, Loughton Tube Station |
| Buckhurst Hill | A desirable suburban area known for its affluent community and proximity to London, making it popular for both short and long-term stays. | Queen's Road, Buckhurst Hill Underground Station, High Road, The Forest, Epping Forest, Loughton Hall |
| Chingford | Historic town with a blend of outdoor activities and village charm, appealing to nature lovers and visitors seeking tranquility near Epping Forest. | Epping Forest, Chingford Mount Cemetery, Queen Elizabeth's Hunting Lodge, Chingford Golf Club, North Chingford, Chingford Station |
| Waltham Abbey | Rich in history and located at the edge of Epping Forest, it draws visitors interested in historical attractions and outdoor activities. | Waltham Abbey Church, Lee Valley Regional Park, Royal Gunpowder Mills, Epping Forest, Ponder's End, Waltham Cross |
| Theydon Bois | A picturesque village known for its scenic surroundings and easy access to Epping Forest, ideal for nature retreats and family visits. | Epping Forest, Theydon Bois Village Green, Theydon Bois Tube Station, Hainault Forest Country Park, Local pubs and eateries, Theydon Bois cricket club |
| Epping | Market town with a vibrant local culture and facilities, perfect for tourists and business travelers seeking a blend of history and modernity. | Epping Forest, St. John's Church, Epping Market, Epping Tube Station, Civic Offices, Local restaurants and cafes |
| Waltham Cross | Close to historical sites and transport links, it attracts guests looking for convenient access to London and surrounding areas. | Waltham Cross Railway Station, Lee Valley Park, Waltham Cross shopping, Local dining options, Historic sites, Abbots Langley |
| North Weald Bassett | Small village with charming landscapes and a classic English countryside atmosphere, suitable for relaxing retreats. | North Weald Airfield, Epping Forest, Local farms, The Village Green, The Black Horse Pub, Art studios |
Understanding Airbnb License Requirements & STR Laws in Epping Forest (2025)
While Epping Forest, England, United Kingdom currently shows low STR regulations, specific Airbnb license requirements might still exist or change. Always verify the latest short term rental regulations and Airbnb license requirements directly with local government authorities for Epping Forest to ensure full compliance before hosting.
(Source: AirROI data, 2025, based on 1% licensed listings)
Top Performing Airbnb Properties in Epping Forest (2025)
Benchmark your potential! Explore examples of top-performing Airbnb properties in Epping Forestbased on Trailing Twelve Month (TTM) revenue. Analyze their characteristics, revenue, occupancy rate, and ADR to understand what drives success in this market.
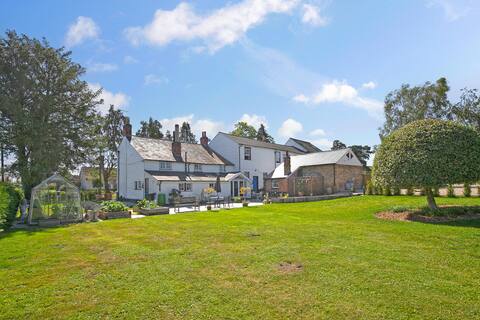
Beautiful Essex Farmhouse
Entire Place • 5 bedrooms

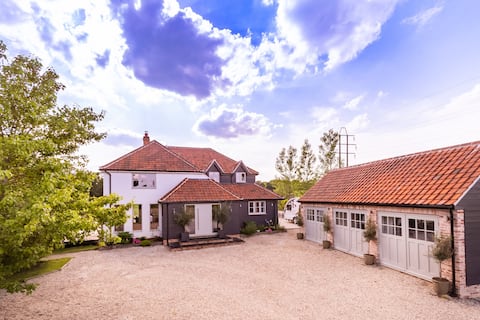
Farmhouse with pool, hot tub, games room in Essex!
Entire Place • 4 bedrooms
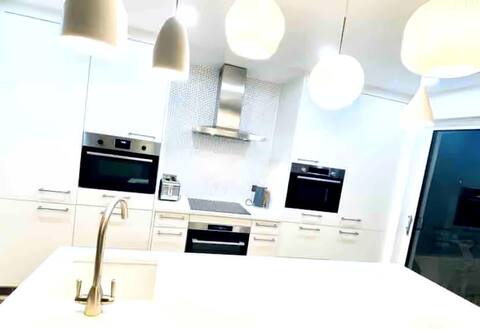
Modernised Luxury Family Home in Theydon Bois
Entire Place • 5 bedrooms
Luxury 6 bedroom country retreat 1hr from London
Entire Place • 5 bedrooms
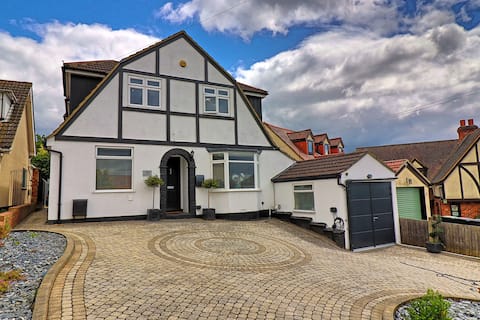
Modern family home with easy access to London
Entire Place • 3 bedrooms
Picturesque Family Hideaway Chipping Ongar Essex
Entire Place • 5 bedrooms
Note: Performance varies based on location, size, amenities, seasonality, and management quality. Data reflects the past 12 months.
Top Performing Airbnb Hosts in Epping Forest (2025)
Learn from the best! This table showcases top-performing Airbnb hosts in Epping Forest based on the number of properties managed and estimated total revenue over the past year. Analyze their scale and performance metrics.
| Host Name | Properties | Grossing Revenue | Stay Reviews | Avg Rating |
|---|---|---|---|---|
| Perfectly | 8 | $416,835 | 226 | 4.72/5.0 |
| Max | 4 | $173,479 | 616 | 4.92/5.0 |
| Poli | 4 | $151,577 | 97 | 4.72/5.0 |
| Host #77836435 | 1 | $143,437 | 25 | 4.92/5.0 |
| Cottages | 3 | $138,683 | 22 | 3.31/5.0 |
| Tim And Rachel | 2 | $132,420 | 218 | 4.92/5.0 |
| Sophie | 2 | $111,796 | 282 | 5.00/5.0 |
| Valerie | 1 | $105,292 | 4 | 5.00/5.0 |
| Sarah | 1 | $93,188 | 98 | 4.93/5.0 |
| Veronica | 1 | $83,148 | 14 | 4.93/5.0 |
Analyzing the strategies of top hosts, such as their property selection, pricing, and guest communication, can offer valuable lessons for optimizing your own Airbnb operations in Epping Forest.
Dive Deeper: Advanced Epping Forest STR Market Data (2025)
Ready to unlock more insights? AirROI provides access to advanced metrics and comprehensive Airbnb data for Epping Forest. Explore detailed analytics beyond this report to refine your investment strategy, optimize pricing, and maximize your vacation rental profits.
Explore Advanced MetricsEpping Forest Short-Term Rental Market Composition (2025): Property & Room Types
Room Type Distribution
Property Type Distribution
Market Composition Insights for Epping Forest
- The Epping Forest Airbnb market composition is heavily skewed towards Entire Home/Apt listings, which make up 71.3% of the 122 active rentals. This indicates strong guest preference for privacy and space.
- Looking at the property type distribution in Epping Forest, House properties are the most common (51.6%), reflecting the local real estate landscape.
- Houses represent a significant 51.6% portion, catering likely to families or larger groups.
- The presence of 9.8% Hotel/Boutique listings indicates integration with traditional hospitality.
- Smaller segments like unique stays, others (combined 9.0%) offer potential for unique stay experiences.
Epping Forest Airbnb Room Capacity Analysis (2025): Bedroom Distribution
Distribution of Listings by Number of Bedrooms
Room Capacity Insights for Epping Forest
- The dominant room capacity in Epping Forest is 1 bedroom listings, making up 45.9% of the market. This suggests a strong demand for properties suitable for couples or solo travelers.
- Together, 1 bedroom and 2 bedrooms properties represent 65.6% of the active Airbnb listings in Epping Forest, indicating a high concentration in these sizes.
Epping Forest Vacation Rental Guest Capacity Trends (2025)
Distribution of Listings by Guest Capacity
Guest Capacity Insights for Epping Forest
- The most common guest capacity trend in Epping Forest vacation rentals is listings accommodating 2 guests (33.6%). This suggests the primary traveler segment is likely couples or solo travelers.
- Properties designed for 2 guests and 4 guests dominate the Epping Forest STR market, accounting for 55.7% of listings.
- 19.7% of properties accommodate 6+ guests, serving the market segment for larger families or group travel in Epping Forest.
- On average, properties in Epping Forest are equipped to host 3.1 guests.
Epping Forest Airbnb Booking Patterns (2025): Available vs. Booked Days
Available Days Distribution
Booked Days Distribution
Booking Pattern Insights for Epping Forest
- The most common availability pattern in Epping Forest falls within the 271-366 days range, representing 37.7% of listings. This suggests many properties have significant open periods on their calendars.
- Approximately 63.9% of listings show high availability (181+ days open annually), indicating potential for increased bookings or specific owner usage patterns.
- For booked days, the 181-270 days range is most frequent in Epping Forest (27.9%), reflecting common guest stay durations or potential owner blocking patterns.
- A notable 36.1% of properties secure long booking periods (181+ days booked per year), highlighting successful long-term rental strategies or significant owner usage.
Epping Forest Airbnb Minimum Stay Requirements Analysis
Distribution of Listings by Minimum Night Requirement
1 Night
43 listings
40.6% of total
2 Nights
30 listings
28.3% of total
3 Nights
9 listings
8.5% of total
4-6 Nights
9 listings
8.5% of total
7-29 Nights
3 listings
2.8% of total
30+ Nights
12 listings
11.3% of total
Key Insights
- The most prevalent minimum stay requirement in Epping Forest is 1 Night, adopted by 40.6% of listings. This highlights the market's preference for shorter, flexible bookings.
- A strong majority (68.9%) of the Epping Forest Airbnb data shows acceptance of very short stays (1-2 nights), indicating a dynamic, high-turnover market.
- A significant segment (11.3%) caters to monthly stays (30+ nights) in Epping Forest, pointing to opportunities in the extended-stay market.
Recommendations
- Align with the market by considering a 1 Night minimum stay, as 40.6% of Epping Forest hosts use this setting.
- Explore offering discounts for stays of 30+ nights to attract the 11.3% of the market seeking extended stays.
- Adjust minimum nights based on seasonality – potentially shorter during low season and longer during peak demand periods in Epping Forest.
Epping Forest Airbnb Cancellation Policy Trends Analysis (2025)
Super Strict 60 Days
3 listings
3.2% of total
Flexible
23 listings
24.7% of total
Moderate
34 listings
36.6% of total
Firm
11 listings
11.8% of total
Strict
22 listings
23.7% of total
Cancellation Policy Insights for Epping Forest
- The prevailing Airbnb cancellation policy trend in Epping Forest is Moderate, used by 36.6% of listings.
- There's a relatively balanced mix between guest-friendly (61.3%) and stricter (35.5%) policies, offering choices for different guest needs.
Recommendations for Hosts
- Consider adopting a Moderate policy to align with the 36.6% market standard in Epping Forest.
- Regularly review your cancellation policy against competitors and market demand shifts in Epping Forest.
Epping Forest STR Booking Lead Time Analysis (2025)
Average Booking Lead Time by Month
Booking Lead Time Insights for Epping Forest
- The overall average booking lead time for vacation rentals in Epping Forest is 39 days.
- Guests book furthest in advance for stays during June (average 70 days), likely coinciding with peak travel demand or local events.
- The shortest booking windows occur for stays in February (average 34 days), indicating more last-minute travel plans during this time.
- Seasonally, Summer (59 days avg.) sees the longest lead times, while Winter (38 days avg.) has the shortest, reflecting typical travel planning cycles.
Recommendations for Hosts
- Use the overall average lead time (39 days) as a baseline for your pricing and availability strategy in Epping Forest.
- For June stays, consider implementing length-of-stay discounts or slightly higher rates for bookings made less than 70 days out to capitalize on advance planning.
- Target marketing efforts for the Summer season well in advance (at least 59 days) to capture early planners.
- Monitor your own booking lead times against these Epping Forest averages to identify opportunities for dynamic pricing adjustments.
Popular & Essential Airbnb Amenities in Epping Forest (2025)
Amenity Prevalence
Amenity Insights for Epping Forest
- Essential amenities in Epping Forest that guests expect include: Smoke alarm, Wifi, Heating. Lacking these (any) could significantly impact bookings.
- Popular amenities like Hot water, TV, Essentials are common but not universal. Offering these can provide a competitive edge.
Recommendations for Hosts
- Ensure your listing includes all essential amenities for Epping Forest: Smoke alarm, Wifi, Heating.
- Prioritize adding missing essentials: Smoke alarm, Wifi, Heating.
- Consider adding popular differentiators like Hot water or TV to increase appeal.
- Highlight unique or less common amenities you offer (e.g., hot tub, dedicated workspace, EV charger) in your listing description and photos.
- Regularly check competitor amenities in Epping Forest to stay competitive.
Epping Forest Airbnb Guest Demographics & Profile Analysis (2025)
Guest Profile Summary for Epping Forest
- The typical guest profile for Airbnb in Epping Forest consists of primarily domestic travelers (81%), often arriving from nearby England, typically belonging to the Post-2000s (Gen Z/Alpha) group (50%), primarily speaking English or French.
- Domestic travelers account for 80.6% of guests.
- Key international markets include United Kingdom (80.6%) and United States (3.9%).
- Top languages spoken are English (66.9%) followed by French (6.8%).
- A significant demographic segment is the Post-2000s (Gen Z/Alpha) group, representing 50% of guests.
Recommendations for Hosts
- Target domestic marketing efforts towards travelers from England and London.
- Tailor amenities and listing descriptions to appeal to the dominant Post-2000s (Gen Z/Alpha) demographic (e.g., highlight fast WiFi, smart home features, local guides).
- Highlight unique local experiences or amenities relevant to the primary guest profile.
- Consider seasonal promotions aligned with peak travel times for key origin markets.
Nearby Short-Term Rental Market Comparison
How does the Epping Forest Airbnb market stack up against its neighbors? Compare key performance metrics like average monthly revenue, ADR, and occupancy rates in surrounding areas to understand the broader regional STR landscape.
| Market | Active Properties | Monthly Revenue | Daily Rate | Avg. Occupancy |
|---|---|---|---|---|
| Dorney | 12 | $8,335 | $622.48 | 45% |
| City of Westminster | 1,327 | $6,043 | $486.66 | 52% |
| Wraysbury | 14 | $4,719 | $396.18 | 46% |
| Old Windsor | 22 | $4,655 | $347.12 | 54% |
| Iver Heath | 17 | $3,761 | $226.81 | 49% |
| Binfield | 14 | $3,579 | $370.51 | 43% |
| Bray | 35 | $3,508 | $370.24 | 45% |
| Roedean | 47 | $3,494 | $257.09 | 47% |
| Sunninghill | 11 | $3,456 | $398.67 | 45% |
| Hambleden | 23 | $3,394 | $350.08 | 41% |