Enmore Airbnb Market Analysis 2025: Short Term Rental Data & Vacation Rental Statistics in England, United Kingdom
Is Airbnb profitable in Enmore in 2025? Explore comprehensive Airbnb analytics for Enmore, England, United Kingdom to uncover income potential. This 2025 STR market report for Enmore, based on AirROI data from April 2024 to March 2025, reveals key trends in the niche market of 19 active listings.
Whether you're considering an Airbnb investment in Enmore, optimizing your existing vacation rental, or exploring rental arbitrage opportunities, understanding the Enmore Airbnb data is crucial. Leveraging the low regulation environment is key to maximizing your short term rental income potential. Let's dive into the specifics.
Key Enmore Airbnb Performance Metrics Overview
Monthly Airbnb Revenue Variations & Income Potential in Enmore (2025)
Understanding the monthly revenue variations for Airbnb listings in Enmore is key to maximizing your short term rental income potential. Seasonality significantly impacts earnings. Our analysis, based on data from the past 12 months, shows that the peak revenue month for STRs in Enmore is typically November, while March often presents the lowest earnings, highlighting opportunities for strategic pricing adjustments during shoulder and low seasons. Explore the typical Airbnb income in Enmore across different performance tiers:
- Best-in-class properties (Top 10%) achieve $3,005+ monthly, often utilizing dynamic pricing and superior guest experiences.
- Strong performing properties (Top 25%) earn $1,792 or more, indicating effective management and desirable locations/amenities.
- Typical properties (Median) generate around $994 per month, representing the average market performance.
- Entry-level properties (Bottom 25%) see earnings around $655, often with potential for optimization.
Average Monthly Airbnb Earnings Trend in Enmore
Enmore Airbnb Occupancy Rate Trends (2025)
Maximize your bookings by understanding the Enmore STR occupancy trends. Seasonal demand shifts significantly influence how often properties are booked. Typically, Januarysees the highest demand (peak season occupancy), while March experiences the lowest (low season). Effective strategies, like adjusting minimum stays or offering promotions, can boost occupancy during slower periods. Here's how different property tiers perform in Enmore:
- Best-in-class properties (Top 10%) achieve 47%+ occupancy, indicating high desirability and potentially optimized availability.
- Strong performing properties (Top 25%) maintain 41% or higher occupancy, suggesting good market fit and guest satisfaction.
- Typical properties (Median) have an occupancy rate around 26%.
- Entry-level properties (Bottom 25%) average 21% occupancy, potentially facing higher vacancy.
Average Monthly Occupancy Rate Trend in Enmore
Average Daily Rate (ADR) Airbnb Trends in Enmore (2025)
Effective short term rental pricing strategy in Enmore involves understanding monthly ADR fluctuations. The Average Daily Rate (ADR) for Airbnb in Enmore typically peaks in April and dips lowest during December. Leveraging Airbnb dynamic pricing tools or strategies based on this seasonality can significantly boost revenue. Here's a look at the typical nightly rates achieved:
- Best-in-class properties (Top 10%) command rates of $347+ per night, often due to premium features or locations.
- Strong performing properties (Top 25%) achieve nightly rates of $236 or more.
- Typical properties (Median) charge around $120 per night.
- Entry-level properties (Bottom 25%) earn around $116 per night.
Average Daily Rate (ADR) Trend by Month in Enmore
Get Live Enmore Market Intelligence 👇

Explore Real-time Analytics
Airbnb Seasonality Analysis & Trends in Enmore (2025)
Peak Season (November, September, October)
- Revenue averages $2,415 per month
- Occupancy rates average 34.9%
- Daily rates average $164
Shoulder Season
- Revenue averages $1,288 per month
- Occupancy maintains around 33.7%
- Daily rates hold near $169
Low Season (February, March, April)
- Revenue drops to average $578 per month
- Occupancy decreases to average 21.9%
- Daily rates adjust to average $188
Seasonality Insights for Enmore
- The Airbnb seasonality in Enmore shows highly seasonal trends requiring careful strategy. While the sections above show seasonal averages, it's also insightful to look at the extremes:
- During the high season, the absolute peak month showcases Enmore's highest earning potential, with monthly revenues capable of climbing to $3,206, occupancy reaching a high of 64.5%, and ADRs peaking at $253.
- Conversely, the slowest single month of the year, typically falling within the low season, marks the market's lowest point. In this month, revenue might dip to $242, occupancy could drop to 8.1%, and ADRs may adjust down to $147.
- Understanding both the seasonal averages and these monthly peaks and troughs in revenue, occupancy, and ADR is crucial for maximizing your Airbnb profit potential in Enmore.
Seasonal Strategies for Maximizing Profit
- Peak Season: Maximize revenue through premium pricing and potentially longer minimum stays. Ensure high availability.
- Low Season: Offer competitive pricing, special promotions (e.g., extended stay discounts), and flexible cancellation policies. Target off-season travelers like remote workers or budget-conscious guests.
- Shoulder Seasons: Implement dynamic pricing that balances peak and low rates. Target weekend travelers or specific events. Offer slightly more flexible terms than peak season.
- Regularly analyze your own performance against these Enmore seasonality benchmarks and adjust your pricing and availability strategy accordingly.
Best Areas for Airbnb Investment in Enmore (2025)
Exploring the top neighborhoods for short-term rentals in Enmore? This section highlights key areas, outlining why they are attractive for hosts and guests, along with notable local attractions. Consider these locations based on your target guest profile and investment strategy.
| Neighborhood / Area | Why Host Here? (Target Guests & Appeal) | Key Attractions & Landmarks |
|---|---|---|
| Enmore | Enmore is an eclectic suburb known for its vibrant arts scene and diverse culture. It offers a mix of quaint cafes, art galleries, and live music venues, attracting both locals and tourists. | Enmore Theatre, Newtown's King Street, Cafes and restaurants, Marrickville Metro, Parks and recreational areas, Street art and murals |
| Newtown | Quite close to Enmore, Newtown is famous for its bohemian vibe, creative spaces, and bustling food culture. It’s popular among young travelers and those seeking alternative lifestyles. | Newtown's King Street, Carriageworks, Sydney University, Street art, The Enmore Theatre |
| Marrickville | Known for its multicultural atmosphere and fantastic food scene, Marrickville is evolving as a trendy place for travelers who are looking for authentic experiences. | Marrickville Market, Cafes and eateries, Cooks River cycle pathway, Vintage shops, Marrickville Metro |
| Stanmore | A quieter suburb with a suburban feel, Stanmore is conveniently located near the city and attracts families and business travelers looking for a more residential atmosphere. | Stanmore Village, Parks, Cafes, Train station to the city |
| Dulwich Hill | Dulwich Hill offers a balance of residential charm and urban amenities, making it appealing for families and travelers looking for a peaceful stay with access to local culture. | Cafes and restaurants, Dulwich Hill Village, Parks, Light Rail services |
| Ashfield | Ashfield is a multicultural area with a variety of dining options. It attracts diverse visitors due to its rich culture and close proximity to the city. | Ashfield Mall, Heritage buildings, Parks, Restaurants from various cultures |
| Haberfield | Known for its Italian heritage, Haberfield is ideal for those who love good food and local markets, attracting visitors looking for local culinary experiences. | Haberfield Village, Pasta shops, Local cafes, Parks |
| Tempe | Tempe is a quieter area with access to the Cooks River, making it great for travelers seeking outdoor activities and nature while being close to urban amenities. | Tempe Recreation Reserve, Cooks River, Cycle paths, Train station |
Understanding Airbnb License Requirements & STR Laws in Enmore (2025)
While Enmore, England, United Kingdom currently shows low STR regulations, specific Airbnb license requirements might still exist or change. Always verify the latest short term rental regulations and Airbnb license requirements directly with local government authorities for Enmore to ensure full compliance before hosting.
(Source: AirROI data, 2025, finding no licensed listings among those analyzed)
Top Performing Airbnb Properties in Enmore (2025)
Benchmark your potential! Explore examples of top-performing Airbnb properties in Enmorebased on Trailing Twelve Month (TTM) revenue. Analyze their characteristics, revenue, occupancy rate, and ADR to understand what drives success in this market.

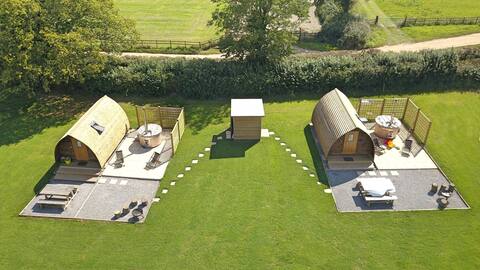
Lodge 3 | Hot Tub | Ensuite | Stunning Views
Entire Place • 1 bedroom
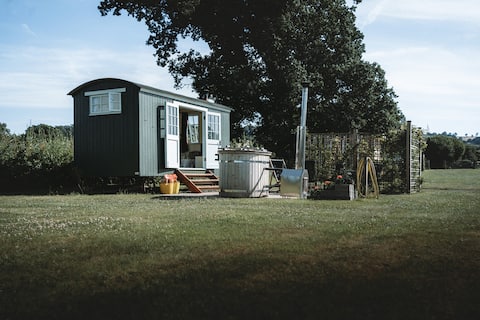
Vineyard Shepherds Hut 2 |Wood Fired Hot Tub| Wine
Private Room • 1 bedroom
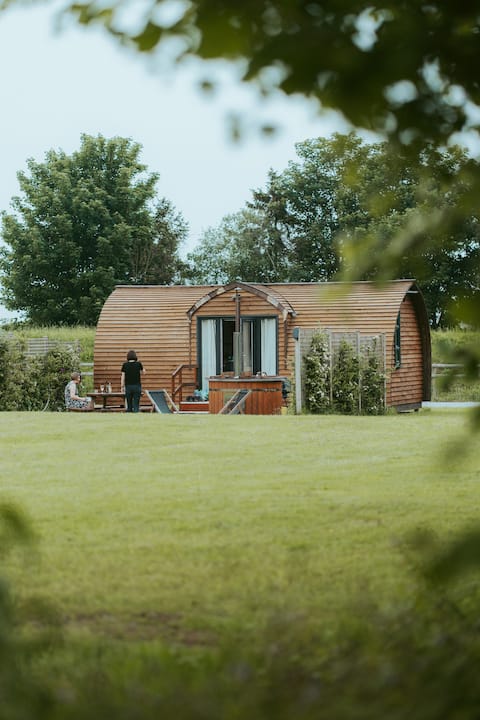
Lodge 2 | Hot Tub | En-Suite | Views
Entire Place • 1 bedroom
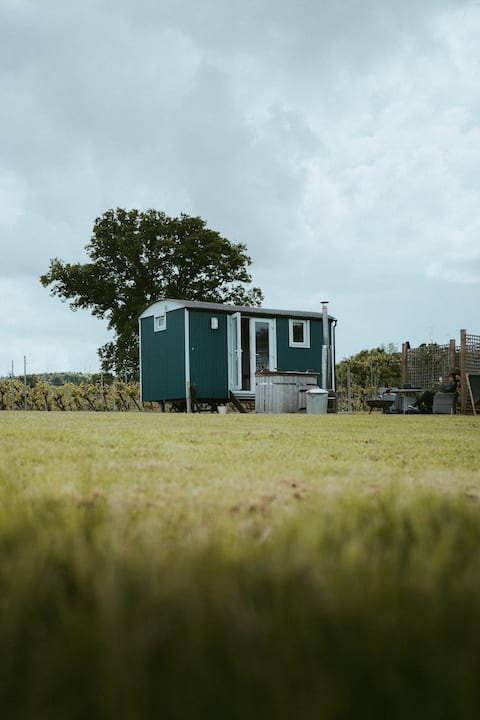
Vineyard Shepherds Hut 3, Wood Fired Hot Tub, Wine
Private Room • 1 bedroom
Wigwam, Hot Tub, Own Bathroom, Beautiful Views 1
Private Room • N/A

Wigwam, Hot Tub, Own Bathroom, Beautiful Views 2
Private Room • N/A
Note: Performance varies based on location, size, amenities, seasonality, and management quality. Data reflects the past 12 months.
Top Performing Airbnb Hosts in Enmore (2025)
Learn from the best! This table showcases top-performing Airbnb hosts in Enmore based on the number of properties managed and estimated total revenue over the past year. Analyze their scale and performance metrics.
| Host Name | Properties | Grossing Revenue | Stay Reviews | Avg Rating |
|---|---|---|---|---|
| Will | 18 | $180,405 | 139 | 4.82/5.0 |
| Gary | 1 | $2,428 | 28 | 4.93/5.0 |
Analyzing the strategies of top hosts, such as their property selection, pricing, and guest communication, can offer valuable lessons for optimizing your own Airbnb operations in Enmore.
Dive Deeper: Advanced Enmore STR Market Data (2025)
Ready to unlock more insights? AirROI provides access to advanced metrics and comprehensive Airbnb data for Enmore. Explore detailed analytics beyond this report to refine your investment strategy, optimize pricing, and maximize your vacation rental profits.
Explore Advanced MetricsEnmore Short-Term Rental Market Composition (2025): Property & Room Types
Room Type Distribution
Property Type Distribution
Market Composition Insights for Enmore
- The Enmore Airbnb market composition is heavily skewed towards Private Room listings, which make up 78.9% of the 19 active rentals. This indicates strong guest preference for privacy and space.
- Looking at the property type distribution in Enmore, Outdoor/Unique properties are the most common (84.2%), reflecting the local real estate landscape.
Enmore Airbnb Room Capacity Analysis (2025): Bedroom Distribution
Distribution of Listings by Number of Bedrooms
Room Capacity Insights for Enmore
- The dominant room capacity in Enmore is 1 bedroom listings, making up 26.3% of the market. This suggests a strong demand for properties suitable for couples or solo travelers.
Enmore Vacation Rental Guest Capacity Trends (2025)
Distribution of Listings by Guest Capacity
Guest Capacity Insights for Enmore
- The most common guest capacity trend in Enmore vacation rentals is listings accommodating 4 guests (52.6%). This suggests the primary traveler segment is likely small families or groups.
- Properties designed for 4 guests and 2 guests dominate the Enmore STR market, accounting for 68.4% of listings.
- On average, properties in Enmore are equipped to host 2.7 guests.
Enmore Airbnb Booking Patterns (2025): Available vs. Booked Days
Available Days Distribution
Booked Days Distribution
Booking Pattern Insights for Enmore
- The most common availability pattern in Enmore falls within the 271-366 days range, representing 89.5% of listings. This suggests many properties have significant open periods on their calendars.
- Approximately 100.0% of listings show high availability (181+ days open annually), indicating potential for increased bookings or specific owner usage patterns.
- For booked days, the 31-90 days range is most frequent in Enmore (57.9%), reflecting common guest stay durations or potential owner blocking patterns.
Enmore Airbnb Minimum Stay Requirements Analysis
Distribution of Listings by Minimum Night Requirement
1 Night
18 listings
94.7% of total
2 Nights
1 listings
5.3% of total
Key Insights
- The most prevalent minimum stay requirement in Enmore is 1 Night, adopted by 94.7% of listings. This highlights the market's preference for shorter, flexible bookings.
- A strong majority (100.0%) of the Enmore Airbnb data shows acceptance of very short stays (1-2 nights), indicating a dynamic, high-turnover market.
Recommendations
- Align with the market by considering a 1 Night minimum stay, as 94.7% of Enmore hosts use this setting.
- Adjust minimum nights based on seasonality – potentially shorter during low season and longer during peak demand periods in Enmore.
Enmore Airbnb Cancellation Policy Trends Analysis (2025)
Flexible
16 listings
84.2% of total
Moderate
1 listings
5.3% of total
Firm
1 listings
5.3% of total
Strict
1 listings
5.3% of total
Cancellation Policy Insights for Enmore
- The prevailing Airbnb cancellation policy trend in Enmore is Flexible, used by 84.2% of listings.
- The market strongly favors guest-friendly terms, with 89.5% of listings offering Flexible or Moderate policies. This suggests guests in Enmore may expect booking flexibility.
- Strict cancellation policies are quite rare (5.3%), potentially making listings with this policy less competitive unless justified by high demand or property type.
Recommendations for Hosts
- Consider adopting a Flexible policy to align with the 84.2% market standard in Enmore.
- Given the high prevalence of Flexible policies (84.2%), offering this can enhance booking appeal, especially during shoulder seasons.
- Using a Strict policy might deter some guests, as only 5.3% of listings use it. Evaluate if potential revenue protection outweighs possible lower booking rates.
- Regularly review your cancellation policy against competitors and market demand shifts in Enmore.
Enmore STR Booking Lead Time Analysis (2025)
Average Booking Lead Time by Month
Booking Lead Time Insights for Enmore
- The overall average booking lead time for vacation rentals in Enmore is 113 days.
- Guests book furthest in advance for stays during June (average 206 days), likely coinciding with peak travel demand or local events.
- The shortest booking windows occur for stays in March (average 22 days), indicating more last-minute travel plans during this time.
- Seasonally, Summer (121 days avg.) sees the longest lead times, while Winter (30 days avg.) has the shortest, reflecting typical travel planning cycles.
Recommendations for Hosts
- Use the overall average lead time (113 days) as a baseline for your pricing and availability strategy in Enmore.
- For June stays, consider implementing length-of-stay discounts or slightly higher rates for bookings made less than 206 days out to capitalize on advance planning.
- Target marketing efforts for the Summer season well in advance (at least 121 days) to capture early planners.
- Monitor your own booking lead times against these Enmore averages to identify opportunities for dynamic pricing adjustments.
Popular & Essential Airbnb Amenities in Enmore (2025)
Amenity Prevalence
Amenity Insights for Enmore
- Essential amenities in Enmore that guests expect include: Heating, Kitchen, Free parking on premises, Fire extinguisher. Lacking these (any) could significantly impact bookings.
- Popular amenities like Lock on bedroom door, Essentials, Private entrance are common but not universal. Offering these can provide a competitive edge.
Recommendations for Hosts
- Ensure your listing includes all essential amenities for Enmore: Heating, Kitchen, Free parking on premises, Fire extinguisher.
- Consider adding popular differentiators like Lock on bedroom door or Essentials to increase appeal.
- Highlight unique or less common amenities you offer (e.g., hot tub, dedicated workspace, EV charger) in your listing description and photos.
- Regularly check competitor amenities in Enmore to stay competitive.
Enmore Airbnb Guest Demographics & Profile Analysis (2025)
Guest Profile Summary for Enmore
- The typical guest profile for Airbnb in Enmore consists of primarily domestic travelers (96%), often arriving from nearby England, typically belonging to the Post-2000s (Gen Z/Alpha) group (50%), primarily speaking English or Spanish.
- Domestic travelers account for 95.8% of guests.
- Key international markets include United Kingdom (95.8%) and Malaysia (4.2%).
- Top languages spoken are English (91.7%) followed by Spanish (8.3%).
- A significant demographic segment is the Post-2000s (Gen Z/Alpha) group, representing 50% of guests.
Recommendations for Hosts
- Target domestic marketing efforts towards travelers from England and Southampton.
- Tailor amenities and listing descriptions to appeal to the dominant Post-2000s (Gen Z/Alpha) demographic (e.g., highlight fast WiFi, smart home features, local guides).
- Highlight unique local experiences or amenities relevant to the primary guest profile.
- Consider seasonal promotions aligned with peak travel times for key origin markets.
Nearby Short-Term Rental Market Comparison
How does the Enmore Airbnb market stack up against its neighbors? Compare key performance metrics like average monthly revenue, ADR, and occupancy rates in surrounding areas to understand the broader regional STR landscape.
| Market | Active Properties | Monthly Revenue | Daily Rate | Avg. Occupancy |
|---|---|---|---|---|
| Englishcombe | 13 | $8,558 | $573.69 | 49% |
| Chew Magna | 14 | $6,649 | $399.59 | 46% |
| Long Sutton | 17 | $5,726 | $383.88 | 46% |
| Stoke St. Michael | 10 | $5,277 | $424.04 | 42% |
| Winsham | 10 | $5,154 | $484.22 | 52% |
| Oldland Common | 13 | $5,093 | $355.47 | 43% |
| Llanrhidian | 15 | $4,842 | $386.18 | 53% |
| Crai | 20 | $4,799 | $371.85 | 46% |
| Limpley Stoke | 10 | $4,598 | $523.47 | 52% |
| Abbeycwmhir | 10 | $4,502 | $259.19 | 49% |