Eaton Airbnb Market Analysis 2025: Short Term Rental Data & Vacation Rental Statistics in England, United Kingdom
Is Airbnb profitable in Eaton in 2025? Explore comprehensive Airbnb analytics for Eaton, England, United Kingdom to uncover income potential. This 2025 STR market report for Eaton, based on AirROI data from April 2024 to March 2025, reveals key trends in the niche market of 17 active listings.
Whether you're considering an Airbnb investment in Eaton, optimizing your existing vacation rental, or exploring rental arbitrage opportunities, understanding the Eaton Airbnb data is crucial. Leveraging the low regulation environment is key to maximizing your short term rental income potential. Let's dive into the specifics.
Key Eaton Airbnb Performance Metrics Overview
Monthly Airbnb Revenue Variations & Income Potential in Eaton (2025)
Understanding the monthly revenue variations for Airbnb listings in Eaton is key to maximizing your short term rental income potential. Seasonality significantly impacts earnings. Our analysis, based on data from the past 12 months, shows that the peak revenue month for STRs in Eaton is typically August, while January often presents the lowest earnings, highlighting opportunities for strategic pricing adjustments during shoulder and low seasons. Explore the typical Airbnb income in Eaton across different performance tiers:
- Best-in-class properties (Top 10%) achieve $7,599+ monthly, often utilizing dynamic pricing and superior guest experiences.
- Strong performing properties (Top 25%) earn $5,412 or more, indicating effective management and desirable locations/amenities.
- Typical properties (Median) generate around $3,625 per month, representing the average market performance.
- Entry-level properties (Bottom 25%) see earnings around $2,083, often with potential for optimization.
Average Monthly Airbnb Earnings Trend in Eaton
Eaton Airbnb Occupancy Rate Trends (2025)
Maximize your bookings by understanding the Eaton STR occupancy trends. Seasonal demand shifts significantly influence how often properties are booked. Typically, Augustsees the highest demand (peak season occupancy), while January experiences the lowest (low season). Effective strategies, like adjusting minimum stays or offering promotions, can boost occupancy during slower periods. Here's how different property tiers perform in Eaton:
- Best-in-class properties (Top 10%) achieve 83%+ occupancy, indicating high desirability and potentially optimized availability.
- Strong performing properties (Top 25%) maintain 73% or higher occupancy, suggesting good market fit and guest satisfaction.
- Typical properties (Median) have an occupancy rate around 49%.
- Entry-level properties (Bottom 25%) average 28% occupancy, potentially facing higher vacancy.
Average Monthly Occupancy Rate Trend in Eaton
Average Daily Rate (ADR) Airbnb Trends in Eaton (2025)
Effective short term rental pricing strategy in Eaton involves understanding monthly ADR fluctuations. The Average Daily Rate (ADR) for Airbnb in Eaton typically peaks in August and dips lowest during January. Leveraging Airbnb dynamic pricing tools or strategies based on this seasonality can significantly boost revenue. Here's a look at the typical nightly rates achieved:
- Best-in-class properties (Top 10%) command rates of $346+ per night, often due to premium features or locations.
- Strong performing properties (Top 25%) achieve nightly rates of $279 or more.
- Typical properties (Median) charge around $221 per night.
- Entry-level properties (Bottom 25%) earn around $180 per night.
Average Daily Rate (ADR) Trend by Month in Eaton
Get Live Eaton Market Intelligence 👇

Explore Real-time Analytics
Airbnb Seasonality Analysis & Trends in Eaton (2025)
Peak Season (August, June, July)
- Revenue averages $5,272 per month
- Occupancy rates average 62.0%
- Daily rates average $250
Shoulder Season
- Revenue averages $4,158 per month
- Occupancy maintains around 53.3%
- Daily rates hold near $236
Low Season (January, February, March)
- Revenue drops to average $2,666 per month
- Occupancy decreases to average 34.4%
- Daily rates adjust to average $216
Seasonality Insights for Eaton
- The Airbnb seasonality in Eaton shows highly seasonal trends requiring careful strategy. While the sections above show seasonal averages, it's also insightful to look at the extremes:
- During the high season, the absolute peak month showcases Eaton's highest earning potential, with monthly revenues capable of climbing to $5,732, occupancy reaching a high of 63.2%, and ADRs peaking at $270.
- Conversely, the slowest single month of the year, typically falling within the low season, marks the market's lowest point. In this month, revenue might dip to $2,062, occupancy could drop to 31.2%, and ADRs may adjust down to $213.
- Understanding both the seasonal averages and these monthly peaks and troughs in revenue, occupancy, and ADR is crucial for maximizing your Airbnb profit potential in Eaton.
Seasonal Strategies for Maximizing Profit
- Peak Season: Maximize revenue through premium pricing and potentially longer minimum stays. Ensure high availability.
- Low Season: Offer competitive pricing, special promotions (e.g., extended stay discounts), and flexible cancellation policies. Target off-season travelers like remote workers or budget-conscious guests.
- Shoulder Seasons: Implement dynamic pricing that balances peak and low rates. Target weekend travelers or specific events. Offer slightly more flexible terms than peak season.
- Regularly analyze your own performance against these Eaton seasonality benchmarks and adjust your pricing and availability strategy accordingly.
Best Areas for Airbnb Investment in Eaton (2025)
Exploring the top neighborhoods for short-term rentals in Eaton? This section highlights key areas, outlining why they are attractive for hosts and guests, along with notable local attractions. Consider these locations based on your target guest profile and investment strategy.
| Neighborhood / Area | Why Host Here? (Target Guests & Appeal) | Key Attractions & Landmarks |
|---|---|---|
| Eaton Socon | A charming village with scenic views and easy access to the River Great Ouse, making it an attractive destination for nature lovers and those looking for a quiet getaway. | Eaton Socon Park, River Great Ouse, St. Mary's Church, Wyboston Lakes, Eaton Socon Footpath, The Bedford Road |
| St Neots | A historic market town offering a mix of traditional and modern amenities, popular with families and tourists due to its riverside activities and market square events. | St Neots Museum, Priory Park, The River Ouse, The Market Square, St Neots Golf Club, Regent Theatre |
| Gamlingay | Known for its picturesque countryside and historical sites, Gamlingay offers charming accommodations for those seeking a rural escape close to nature. | Gamlingay Castle, The Gamlingay Wood, St. Mary’s Church, The Old Mill, The Green, Local walking trails |
| Biggleswade | A town with a rich history and a variety of shops, parks, and cultural activities, ideal for families and weekend visitors looking for a blend of leisure and heritage. | Biggleswade Common, The Sand & Gravel Works, The Old Watermill, Biggleswade History Society, Local parks, The River Ivel |
| Sandy | A picturesque market town located near the beautiful Sandy Heath Nature Reserve, appealing to outdoor enthusiasts and families interested in exploring the countryside. | Sandy Heath Nature Reserve, The RSPB Sandy, The Church of St. Swithun, Sandy Town Centre, The Domain, The River Ivel |
| Henlow | A quaint village known for its charming architecture and proximity to Henlow Bridge lakes, perfect for guests looking for relaxation and leisure in a natural setting. | Henlow Bridge Lakes, St. Mary's Church, The River Hiz, Local walking paths, Historic village center |
| Catworth | A quaint village that provides a peaceful retreat, attracting visitors who enjoy the tranquility of the countryside and the charm of rural England. | Catworth Church, Local countryside walks, Catworth Village Hall, Historical landmarks, Friendly local pubs |
| Wyboston | A small village known for its lakeside activities and Wyboston Lakes resort, catering to both leisure travelers and business guests. | Wyboston Lakes, Local fishing spots, The surrounding countryside, Adventure golf, Wyboston Lakes Resort |
Understanding Airbnb License Requirements & STR Laws in Eaton (2025)
While Eaton, England, United Kingdom currently shows low STR regulations, specific Airbnb license requirements might still exist or change. Always verify the latest short term rental regulations and Airbnb license requirements directly with local government authorities for Eaton to ensure full compliance before hosting.
(Source: AirROI data, 2025, finding no licensed listings among those analyzed)
Top Performing Airbnb Properties in Eaton (2025)
Benchmark your potential! Explore examples of top-performing Airbnb properties in Eatonbased on Trailing Twelve Month (TTM) revenue. Analyze their characteristics, revenue, occupancy rate, and ADR to understand what drives success in this market.

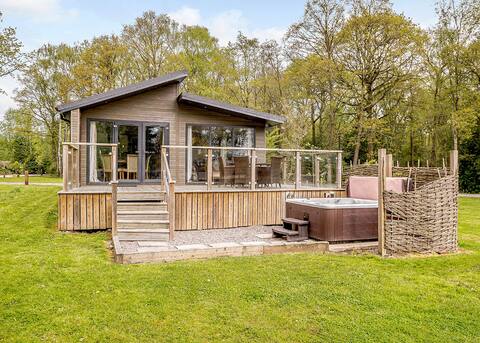
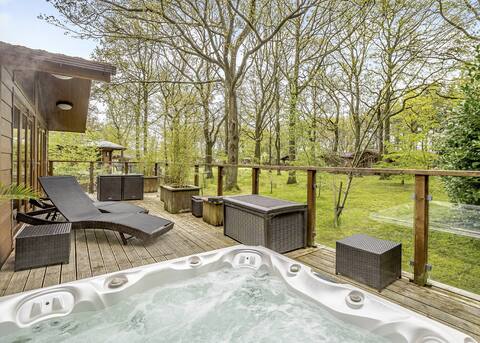
Relaxing Woodland Retreat
Entire Place • 2 bedrooms
Ladera Luxury Lodge 3
Private Room • 3 bedrooms
Ladera Luxury Lodge 2
Private Room • 2 bedrooms
Brownhills
Entire Place • 3 bedrooms
Waters Edge
Entire Place • 1 bedroom

Ladera House Stables
Entire Place • 5 bedrooms
Note: Performance varies based on location, size, amenities, seasonality, and management quality. Data reflects the past 12 months.
Top Performing Airbnb Hosts in Eaton (2025)
Learn from the best! This table showcases top-performing Airbnb hosts in Eaton based on the number of properties managed and estimated total revenue over the past year. Analyze their scale and performance metrics.
| Host Name | Properties | Grossing Revenue | Stay Reviews | Avg Rating |
|---|---|---|---|---|
| Hoseasons | 7 | $333,009 | 116 | 4.29/5.0 |
| Ross | 1 | $73,738 | 46 | 4.85/5.0 |
| Ben | 1 | $67,863 | 40 | 5.00/5.0 |
| Katherine | 1 | $56,731 | 385 | 4.97/5.0 |
| Catherine | 2 | $52,660 | 10 | 2.50/5.0 |
| Eraine | 1 | $44,332 | 228 | 4.92/5.0 |
| Charlotte | 1 | $43,841 | 41 | 4.93/5.0 |
| David | 1 | $20,649 | 61 | 4.98/5.0 |
| Penny | 1 | $20,486 | 22 | 4.95/5.0 |
| Ash | 1 | $2,560 | 103 | 4.93/5.0 |
Analyzing the strategies of top hosts, such as their property selection, pricing, and guest communication, can offer valuable lessons for optimizing your own Airbnb operations in Eaton.
Dive Deeper: Advanced Eaton STR Market Data (2025)
Ready to unlock more insights? AirROI provides access to advanced metrics and comprehensive Airbnb data for Eaton. Explore detailed analytics beyond this report to refine your investment strategy, optimize pricing, and maximize your vacation rental profits.
Explore Advanced MetricsEaton Short-Term Rental Market Composition (2025): Property & Room Types
Room Type Distribution
Property Type Distribution
Market Composition Insights for Eaton
- The Eaton Airbnb market composition is heavily skewed towards Entire Home/Apt listings, which make up 70.6% of the 17 active rentals. This indicates strong guest preference for privacy and space.
- Looking at the property type distribution in Eaton, House properties are the most common (47.1%), reflecting the local real estate landscape.
- Houses represent a significant 47.1% portion, catering likely to families or larger groups.
Eaton Airbnb Room Capacity Analysis (2025): Bedroom Distribution
Distribution of Listings by Number of Bedrooms
Room Capacity Insights for Eaton
- The dominant room capacity in Eaton is 2 bedrooms listings, making up 41.2% of the market. This suggests a strong demand for properties suitable for couples or solo travelers.
- Together, 2 bedrooms and 1 bedroom properties represent 70.6% of the active Airbnb listings in Eaton, indicating a high concentration in these sizes.
- A significant 29.4% of listings offer 3+ bedrooms, catering to larger groups and families seeking more space in Eaton.
Eaton Vacation Rental Guest Capacity Trends (2025)
Distribution of Listings by Guest Capacity
Guest Capacity Insights for Eaton
- The most common guest capacity trend in Eaton vacation rentals is listings accommodating 4 guests (41.2%). This suggests the primary traveler segment is likely small families or groups.
- Properties designed for 4 guests and 6 guests dominate the Eaton STR market, accounting for 64.7% of listings.
- 29.4% of properties accommodate 6+ guests, serving the market segment for larger families or group travel in Eaton.
- On average, properties in Eaton are equipped to host 4.2 guests.
Eaton Airbnb Booking Patterns (2025): Available vs. Booked Days
Available Days Distribution
Booked Days Distribution
Booking Pattern Insights for Eaton
- The most common availability pattern in Eaton falls within the 181-270 days range, representing 35.3% of listings. This suggests many properties have significant open periods on their calendars.
- Approximately 52.9% of listings show high availability (181+ days open annually), indicating potential for increased bookings or specific owner usage patterns.
- For booked days, the 181-270 days range is most frequent in Eaton (29.4%), reflecting common guest stay durations or potential owner blocking patterns.
- A notable 52.9% of properties secure long booking periods (181+ days booked per year), highlighting successful long-term rental strategies or significant owner usage.
Eaton Airbnb Minimum Stay Requirements Analysis
Distribution of Listings by Minimum Night Requirement
1 Night
8 listings
53.3% of total
2 Nights
4 listings
26.7% of total
3 Nights
1 listings
6.7% of total
4-6 Nights
1 listings
6.7% of total
30+ Nights
1 listings
6.7% of total
Key Insights
- The most prevalent minimum stay requirement in Eaton is 1 Night, adopted by 53.3% of listings. This highlights the market's preference for shorter, flexible bookings.
- A strong majority (80.0%) of the Eaton Airbnb data shows acceptance of very short stays (1-2 nights), indicating a dynamic, high-turnover market.
Recommendations
- Align with the market by considering a 1 Night minimum stay, as 53.3% of Eaton hosts use this setting.
- Explore offering discounts for stays of 30+ nights to attract the 6.7% of the market seeking extended stays.
- Adjust minimum nights based on seasonality – potentially shorter during low season and longer during peak demand periods in Eaton.
Eaton Airbnb Cancellation Policy Trends Analysis (2025)
Super Strict 30 Days
1 listings
6.7% of total
Super Strict 60 Days
6 listings
40% of total
Flexible
1 listings
6.7% of total
Moderate
4 listings
26.7% of total
Firm
3 listings
20% of total
Cancellation Policy Insights for Eaton
- The prevailing Airbnb cancellation policy trend in Eaton is Super Strict 60 Days, used by 40% of listings.
- There's a relatively balanced mix between guest-friendly (33.4%) and stricter (20.0%) policies, offering choices for different guest needs.
Recommendations for Hosts
- Consider adopting a Super Strict 60 Days policy to align with the 40% market standard in Eaton.
- Regularly review your cancellation policy against competitors and market demand shifts in Eaton.
Eaton STR Booking Lead Time Analysis (2025)
Average Booking Lead Time by Month
Booking Lead Time Insights for Eaton
- The overall average booking lead time for vacation rentals in Eaton is 56 days.
- Guests book furthest in advance for stays during December (average 100 days), likely coinciding with peak travel demand or local events.
- The shortest booking windows occur for stays in February (average 41 days), indicating more last-minute travel plans during this time.
- Seasonally, Summer (81 days avg.) sees the longest lead times, while Fall (56 days avg.) has the shortest, reflecting typical travel planning cycles.
Recommendations for Hosts
- Use the overall average lead time (56 days) as a baseline for your pricing and availability strategy in Eaton.
- For December stays, consider implementing length-of-stay discounts or slightly higher rates for bookings made less than 100 days out to capitalize on advance planning.
- Target marketing efforts for the Summer season well in advance (at least 81 days) to capture early planners.
- Monitor your own booking lead times against these Eaton averages to identify opportunities for dynamic pricing adjustments.
Popular & Essential Airbnb Amenities in Eaton (2025)
Amenity Prevalence
Amenity Insights for Eaton
- Essential amenities in Eaton that guests expect include: Smoke alarm, Wifi, Refrigerator, Carbon monoxide alarm, TV, Dishes and silverware, Stove, Oven, Heating. Lacking these (any) could significantly impact bookings.
- Popular amenities like Free parking on premises are common but not universal. Offering these can provide a competitive edge.
Recommendations for Hosts
- Ensure your listing includes all essential amenities for Eaton: Smoke alarm, Wifi, Refrigerator, Carbon monoxide alarm, TV, Dishes and silverware, Stove, Oven, Heating.
- Consider adding popular differentiators like Free parking on premises to increase appeal.
- Highlight unique or less common amenities you offer (e.g., hot tub, dedicated workspace, EV charger) in your listing description and photos.
- Regularly check competitor amenities in Eaton to stay competitive.
Eaton Airbnb Guest Demographics & Profile Analysis (2025)
Guest Profile Summary for Eaton
- The typical guest profile for Airbnb in Eaton consists of primarily domestic travelers (93%), often arriving from nearby England, typically belonging to the Post-2000s (Gen Z/Alpha) group (50%), primarily speaking English or German.
- Domestic travelers account for 92.7% of guests.
- Key international markets include United Kingdom (92.7%) and United States (3.1%).
- Top languages spoken are English (77%) followed by German (4.6%).
- A significant demographic segment is the Post-2000s (Gen Z/Alpha) group, representing 50% of guests.
Recommendations for Hosts
- Target domestic marketing efforts towards travelers from England and London.
- Tailor amenities and listing descriptions to appeal to the dominant Post-2000s (Gen Z/Alpha) demographic (e.g., highlight fast WiFi, smart home features, local guides).
- Highlight unique local experiences or amenities relevant to the primary guest profile.
- Consider seasonal promotions aligned with peak travel times for key origin markets.
Nearby Short-Term Rental Market Comparison
How does the Eaton Airbnb market stack up against its neighbors? Compare key performance metrics like average monthly revenue, ADR, and occupancy rates in surrounding areas to understand the broader regional STR landscape.
| Market | Active Properties | Monthly Revenue | Daily Rate | Avg. Occupancy |
|---|---|---|---|---|
| Grinton | 14 | $5,456 | $365.05 | 51% |
| Cartmel Fell | 17 | $4,719 | $331.68 | 52% |
| Casterton | 11 | $4,578 | $300.82 | 51% |
| Cark | 11 | $4,540 | $885.21 | 31% |
| Flore | 10 | $4,534 | $347.03 | 40% |
| Abbeycwmhir | 10 | $4,502 | $259.19 | 49% |
| Craven Arms | 10 | $4,487 | $292.69 | 50% |
| Eglwys-bach | 16 | $4,413 | $315.23 | 52% |
| Waverton | 16 | $4,358 | $444.20 | 33% |
| Hayton | 13 | $4,333 | $239.53 | 60% |