East Stoke Airbnb Market Analysis 2025: Short Term Rental Data & Vacation Rental Statistics in England, United Kingdom
Is Airbnb profitable in East Stoke in 2025? Explore comprehensive Airbnb analytics for East Stoke, England, United Kingdom to uncover income potential. This 2025 STR market report for East Stoke, based on AirROI data from April 2024 to March 2025, reveals key trends in the niche market of 17 active listings.
Whether you're considering an Airbnb investment in East Stoke, optimizing your existing vacation rental, or exploring rental arbitrage opportunities, understanding the East Stoke Airbnb data is crucial. Leveraging the low regulation environment is key to maximizing your short term rental income potential. Let's dive into the specifics.
Key East Stoke Airbnb Performance Metrics Overview
Monthly Airbnb Revenue Variations & Income Potential in East Stoke (2025)
Understanding the monthly revenue variations for Airbnb listings in East Stoke is key to maximizing your short term rental income potential. Seasonality significantly impacts earnings. Our analysis, based on data from the past 12 months, shows that the peak revenue month for STRs in East Stoke is typically August, while February often presents the lowest earnings, highlighting opportunities for strategic pricing adjustments during shoulder and low seasons. Explore the typical Airbnb income in East Stoke across different performance tiers:
- Best-in-class properties (Top 10%) achieve $6,787+ monthly, often utilizing dynamic pricing and superior guest experiences.
- Strong performing properties (Top 25%) earn $4,016 or more, indicating effective management and desirable locations/amenities.
- Typical properties (Median) generate around $2,024 per month, representing the average market performance.
- Entry-level properties (Bottom 25%) see earnings around $822, often with potential for optimization.
Average Monthly Airbnb Earnings Trend in East Stoke
East Stoke Airbnb Occupancy Rate Trends (2025)
Maximize your bookings by understanding the East Stoke STR occupancy trends. Seasonal demand shifts significantly influence how often properties are booked. Typically, Augustsees the highest demand (peak season occupancy), while March experiences the lowest (low season). Effective strategies, like adjusting minimum stays or offering promotions, can boost occupancy during slower periods. Here's how different property tiers perform in East Stoke:
- Best-in-class properties (Top 10%) achieve 72%+ occupancy, indicating high desirability and potentially optimized availability.
- Strong performing properties (Top 25%) maintain 50% or higher occupancy, suggesting good market fit and guest satisfaction.
- Typical properties (Median) have an occupancy rate around 29%.
- Entry-level properties (Bottom 25%) average 13% occupancy, potentially facing higher vacancy.
Average Monthly Occupancy Rate Trend in East Stoke
Average Daily Rate (ADR) Airbnb Trends in East Stoke (2025)
Effective short term rental pricing strategy in East Stoke involves understanding monthly ADR fluctuations. The Average Daily Rate (ADR) for Airbnb in East Stoke typically peaks in December and dips lowest during November. Leveraging Airbnb dynamic pricing tools or strategies based on this seasonality can significantly boost revenue. Here's a look at the typical nightly rates achieved:
- Best-in-class properties (Top 10%) command rates of $555+ per night, often due to premium features or locations.
- Strong performing properties (Top 25%) achieve nightly rates of $318 or more.
- Typical properties (Median) charge around $148 per night.
- Entry-level properties (Bottom 25%) earn around $99 per night.
Average Daily Rate (ADR) Trend by Month in East Stoke
Get Live East Stoke Market Intelligence 👇

Explore Real-time Analytics
Airbnb Seasonality Analysis & Trends in East Stoke (2025)
Peak Season (August, July, May)
- Revenue averages $4,563 per month
- Occupancy rates average 43.0%
- Daily rates average $257
Shoulder Season
- Revenue averages $3,021 per month
- Occupancy maintains around 34.9%
- Daily rates hold near $244
Low Season (January, February, March)
- Revenue drops to average $1,444 per month
- Occupancy decreases to average 20.2%
- Daily rates adjust to average $237
Seasonality Insights for East Stoke
- The Airbnb seasonality in East Stoke shows highly seasonal trends requiring careful strategy. While the sections above show seasonal averages, it's also insightful to look at the extremes:
- During the high season, the absolute peak month showcases East Stoke's highest earning potential, with monthly revenues capable of climbing to $5,725, occupancy reaching a high of 50.0%, and ADRs peaking at $266.
- Conversely, the slowest single month of the year, typically falling within the low season, marks the market's lowest point. In this month, revenue might dip to $1,182, occupancy could drop to 18.8%, and ADRs may adjust down to $219.
- Understanding both the seasonal averages and these monthly peaks and troughs in revenue, occupancy, and ADR is crucial for maximizing your Airbnb profit potential in East Stoke.
Seasonal Strategies for Maximizing Profit
- Peak Season: Maximize revenue through premium pricing and potentially longer minimum stays. Ensure high availability.
- Low Season: Offer competitive pricing, special promotions (e.g., extended stay discounts), and flexible cancellation policies. Target off-season travelers like remote workers or budget-conscious guests.
- Shoulder Seasons: Implement dynamic pricing that balances peak and low rates. Target weekend travelers or specific events. Offer slightly more flexible terms than peak season.
- Regularly analyze your own performance against these East Stoke seasonality benchmarks and adjust your pricing and availability strategy accordingly.
Best Areas for Airbnb Investment in East Stoke (2025)
Exploring the top neighborhoods for short-term rentals in East Stoke? This section highlights key areas, outlining why they are attractive for hosts and guests, along with notable local attractions. Consider these locations based on your target guest profile and investment strategy.
| Neighborhood / Area | Why Host Here? (Target Guests & Appeal) | Key Attractions & Landmarks |
|---|---|---|
| Poole Harbour | A stunning natural harbour offering beautiful views and water-based activities, Poole Harbour attracts tourists looking for relaxation, sailing, and beaches. | Brownsea Island, Sandbanks Beach, Poole Quay, Poole Museum, Boat trips around the harbour |
| Bournemouth | A vibrant coastal resort town known for its sandy beaches, nightlife, and shopping, ideal for short-term holiday rentals and attracting tourists throughout the year. | Bournemouth Pier, Bournemouth Gardens, Oceanarium, Boscombe Beach, Shopping in the town centre |
| Wareham | A charming market town with historical significance and close proximity to nature reserves, perfect for guests seeking a relaxing getaway by the countryside. | Wareham Castle, Corfe Castle, River Frome, Monkey World, Poole Harbour |
| Swanage | A beautiful coastal town with stunning beaches and a historic steam railway, popular among families and those seeking outdoor adventures. | Swanage Beach, Swanage Railway, Old Harry Rocks, D.urlstone Head, Lulworth Cove |
| Corfe Castle | A historical village dominated by the impressive Corfe Castle ruins, attracting history buffs and tourists interested in medieval England. | Corfe Castle, The Blue Pool, Tollard Royal, The Purbeck Hills, Walking trails |
| Lymington | A scenic maritime town with a bustling harbour and access to the New Forest, appealing to sea lovers and nature enthusiasts departing for sailing trips. | Lymington Harbour, New Forest National Park, Lymington Sea Water Baths, St. Barbe Gallery, Hurst Castle |
| Christchurch | A town with a rich history and beautiful natural surroundings, close to the New Forest and perfect for visitors looking for peace and relaxation. | Christchurch Priory, Christchurch Harbour, Avon Beach, Hengistbury Head, Highcliffe Castle |
| Sandbanks | Known for its exclusivity and beautiful beachfront properties, Sandbanks is attractive to high-end tourists looking for luxury vacation rentals. | Sandbanks Beach, Studland and Godlingston Heath National Nature Reserve, Luxury sea view residences, Water sports, Gastronomic restaurants |
Understanding Airbnb License Requirements & STR Laws in East Stoke (2025)
While East Stoke, England, United Kingdom currently shows low STR regulations, specific Airbnb license requirements might still exist or change. Always verify the latest short term rental regulations and Airbnb license requirements directly with local government authorities for East Stoke to ensure full compliance before hosting.
(Source: AirROI data, 2025, finding no licensed listings among those analyzed)
Top Performing Airbnb Properties in East Stoke (2025)
Benchmark your potential! Explore examples of top-performing Airbnb properties in East Stokebased on Trailing Twelve Month (TTM) revenue. Analyze their characteristics, revenue, occupancy rate, and ADR to understand what drives success in this market.
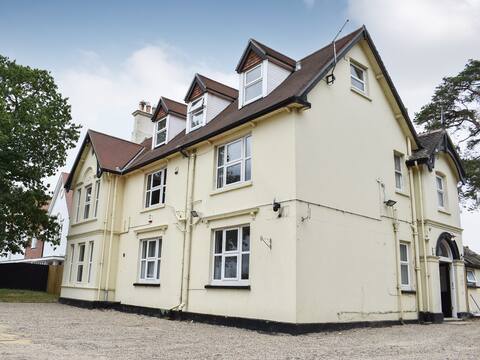
Kemps House
Entire Place • 7 bedrooms

Amazing converted church -Dorset’s Jurassic Coast
Entire Place • 3 bedrooms
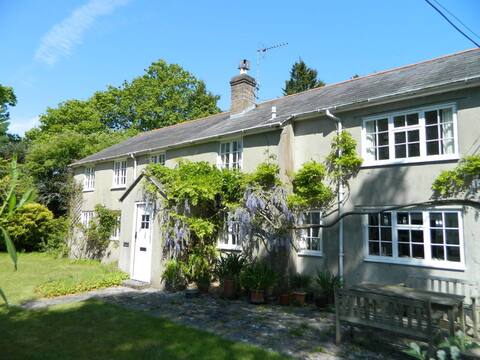
River Cottage a country retreat in wooded gardens
Entire Place • 3 bedrooms
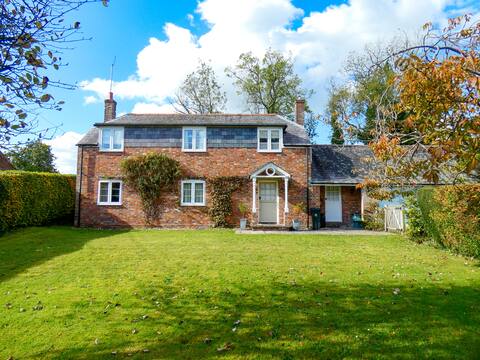
Spacious detached home sleeps 6 adults 2 children
Entire Place • 4 bedrooms

The Chancel - a beautiful converted church
Entire Place • 3 bedrooms
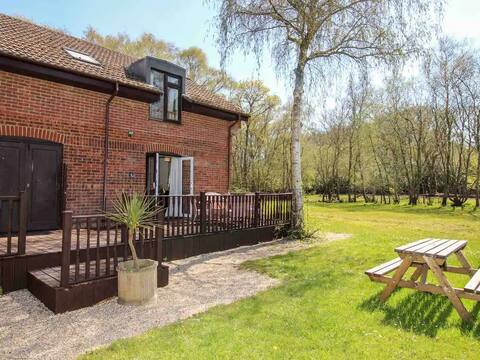
Lulworth Lodge. Set in the countryside of Dorset.
Entire Place • 5 bedrooms
Note: Performance varies based on location, size, amenities, seasonality, and management quality. Data reflects the past 12 months.
Top Performing Airbnb Hosts in East Stoke (2025)
Learn from the best! This table showcases top-performing Airbnb hosts in East Stoke based on the number of properties managed and estimated total revenue over the past year. Analyze their scale and performance metrics.
| Host Name | Properties | Grossing Revenue | Stay Reviews | Avg Rating |
|---|---|---|---|---|
| Cottages | 1 | $115,177 | 14 | 4.79/5.0 |
| Gordon | 1 | $44,642 | 114 | 4.90/5.0 |
| Duncan | 1 | $36,782 | 75 | 4.63/5.0 |
| Danielle | 1 | $35,589 | 7 | 4.86/5.0 |
| Chris | 1 | $31,284 | 73 | 4.88/5.0 |
| Host #557198490 | 1 | $25,943 | 2 | 0.00/5.0 |
| Host #222545100 | 1 | $23,905 | 0 | 0.00/5.0 |
| Host #266781054 | 1 | $22,813 | 60 | 4.98/5.0 |
| Louise | 1 | $13,231 | 144 | 4.99/5.0 |
| Andy | 1 | $11,380 | 139 | 4.96/5.0 |
Analyzing the strategies of top hosts, such as their property selection, pricing, and guest communication, can offer valuable lessons for optimizing your own Airbnb operations in East Stoke.
Dive Deeper: Advanced East Stoke STR Market Data (2025)
Ready to unlock more insights? AirROI provides access to advanced metrics and comprehensive Airbnb data for East Stoke. Explore detailed analytics beyond this report to refine your investment strategy, optimize pricing, and maximize your vacation rental profits.
Explore Advanced MetricsEast Stoke Short-Term Rental Market Composition (2025): Property & Room Types
Room Type Distribution
Property Type Distribution
Market Composition Insights for East Stoke
- The East Stoke Airbnb market composition is heavily skewed towards Entire Home/Apt listings, which make up 88.2% of the 17 active rentals. This indicates strong guest preference for privacy and space.
- Looking at the property type distribution in East Stoke, House properties are the most common (64.7%), reflecting the local real estate landscape.
- Houses represent a significant 64.7% portion, catering likely to families or larger groups.
East Stoke Airbnb Room Capacity Analysis (2025): Bedroom Distribution
Distribution of Listings by Number of Bedrooms
Room Capacity Insights for East Stoke
- The dominant room capacity in East Stoke is 1 bedroom listings, making up 41.2% of the market. This suggests a strong demand for properties suitable for couples or solo travelers.
- Together, 1 bedroom and 3 bedrooms properties represent 64.7% of the active Airbnb listings in East Stoke, indicating a high concentration in these sizes.
- A significant 41.2% of listings offer 3+ bedrooms, catering to larger groups and families seeking more space in East Stoke.
East Stoke Vacation Rental Guest Capacity Trends (2025)
Distribution of Listings by Guest Capacity
Guest Capacity Insights for East Stoke
- The most common guest capacity trend in East Stoke vacation rentals is listings accommodating 2 guests (41.2%). This suggests the primary traveler segment is likely couples or solo travelers.
- Properties designed for 2 guests and 8+ guests dominate the East Stoke STR market, accounting for 58.8% of listings.
- A significant 41.2% of listings cater specifically to 1-2 guests, highlighting strong demand from couples and solo travelers in East Stoke.
- 35.2% of properties accommodate 6+ guests, serving the market segment for larger families or group travel in East Stoke.
- On average, properties in East Stoke are equipped to host 3.8 guests.
East Stoke Airbnb Booking Patterns (2025): Available vs. Booked Days
Available Days Distribution
Booked Days Distribution
Booking Pattern Insights for East Stoke
- The most common availability pattern in East Stoke falls within the 271-366 days range, representing 58.8% of listings. This suggests many properties have significant open periods on their calendars.
- Approximately 94.1% of listings show high availability (181+ days open annually), indicating potential for increased bookings or specific owner usage patterns.
- For booked days, the 31-90 days range is most frequent in East Stoke (35.3%), reflecting common guest stay durations or potential owner blocking patterns.
- A notable 5.9% of properties secure long booking periods (181+ days booked per year), highlighting successful long-term rental strategies or significant owner usage.
East Stoke Airbnb Minimum Stay Requirements Analysis
Distribution of Listings by Minimum Night Requirement
1 Night
2 listings
16.7% of total
2 Nights
4 listings
33.3% of total
3 Nights
2 listings
16.7% of total
4-6 Nights
2 listings
16.7% of total
30+ Nights
2 listings
16.7% of total
Key Insights
- The most prevalent minimum stay requirement in East Stoke is 2 Nights, adopted by 33.3% of listings. This highlights the market's preference for shorter, flexible bookings.
- A significant segment (16.7%) caters to monthly stays (30+ nights) in East Stoke, pointing to opportunities in the extended-stay market.
Recommendations
- Align with the market by considering a 2 Nights minimum stay, as 33.3% of East Stoke hosts use this setting.
- If feasible, allowing 1-night stays, especially midweek or during low season, could capture last-minute bookings, as only 16.7% currently do.
- A 2-night minimum appears standard (33.3%). Consider this for weekends or peak periods.
- Explore offering discounts for stays of 30+ nights to attract the 16.7% of the market seeking extended stays.
- Adjust minimum nights based on seasonality – potentially shorter during low season and longer during peak demand periods in East Stoke.
East Stoke Airbnb Cancellation Policy Trends Analysis (2025)
Super Strict 60 Days
1 listings
7.1% of total
Flexible
2 listings
14.3% of total
Moderate
4 listings
28.6% of total
Firm
4 listings
28.6% of total
Strict
3 listings
21.4% of total
Cancellation Policy Insights for East Stoke
- The prevailing Airbnb cancellation policy trend in East Stoke is Moderate, used by 28.6% of listings.
- There's a relatively balanced mix between guest-friendly (42.9%) and stricter (50.0%) policies, offering choices for different guest needs.
Recommendations for Hosts
- Consider adopting a Moderate policy to align with the 28.6% market standard in East Stoke.
- Regularly review your cancellation policy against competitors and market demand shifts in East Stoke.
East Stoke STR Booking Lead Time Analysis (2025)
Average Booking Lead Time by Month
Booking Lead Time Insights for East Stoke
- The overall average booking lead time for vacation rentals in East Stoke is 51 days.
- Guests book furthest in advance for stays during May (average 111 days), likely coinciding with peak travel demand or local events.
- The shortest booking windows occur for stays in February (average 24 days), indicating more last-minute travel plans during this time.
- Seasonally, Summer (93 days avg.) sees the longest lead times, while Winter (37 days avg.) has the shortest, reflecting typical travel planning cycles.
Recommendations for Hosts
- Use the overall average lead time (51 days) as a baseline for your pricing and availability strategy in East Stoke.
- For May stays, consider implementing length-of-stay discounts or slightly higher rates for bookings made less than 111 days out to capitalize on advance planning.
- Target marketing efforts for the Summer season well in advance (at least 93 days) to capture early planners.
- Monitor your own booking lead times against these East Stoke averages to identify opportunities for dynamic pricing adjustments.
Popular & Essential Airbnb Amenities in East Stoke (2025)
Amenity Prevalence
Amenity Insights for East Stoke
- Essential amenities in East Stoke that guests expect include: Smoke alarm, Heating, Wifi, Free parking on premises. Lacking these (any) could significantly impact bookings.
- Popular amenities like Essentials, Hangers, Kitchen are common but not universal. Offering these can provide a competitive edge.
Recommendations for Hosts
- Ensure your listing includes all essential amenities for East Stoke: Smoke alarm, Heating, Wifi, Free parking on premises.
- Consider adding popular differentiators like Essentials or Hangers to increase appeal.
- Highlight unique or less common amenities you offer (e.g., hot tub, dedicated workspace, EV charger) in your listing description and photos.
- Regularly check competitor amenities in East Stoke to stay competitive.
East Stoke Airbnb Guest Demographics & Profile Analysis (2025)
Guest Profile Summary for East Stoke
- The typical guest profile for Airbnb in East Stoke consists of primarily domestic travelers (93%), often arriving from nearby England, typically belonging to the Post-2000s (Gen Z/Alpha) group (50%), primarily speaking English or German.
- Domestic travelers account for 92.7% of guests.
- Key international markets include United Kingdom (92.7%) and United States (2.8%).
- Top languages spoken are English (75.9%) followed by German (5.6%).
- A significant demographic segment is the Post-2000s (Gen Z/Alpha) group, representing 50% of guests.
Recommendations for Hosts
- Target domestic marketing efforts towards travelers from England and London.
- Tailor amenities and listing descriptions to appeal to the dominant Post-2000s (Gen Z/Alpha) demographic (e.g., highlight fast WiFi, smart home features, local guides).
- Highlight unique local experiences or amenities relevant to the primary guest profile.
- Consider seasonal promotions aligned with peak travel times for key origin markets.
Nearby Short-Term Rental Market Comparison
How does the East Stoke Airbnb market stack up against its neighbors? Compare key performance metrics like average monthly revenue, ADR, and occupancy rates in surrounding areas to understand the broader regional STR landscape.
| Market | Active Properties | Monthly Revenue | Daily Rate | Avg. Occupancy |
|---|---|---|---|---|
| Englishcombe | 13 | $8,558 | $573.69 | 49% |
| Chew Magna | 14 | $6,649 | $399.59 | 46% |
| Lambourn | 11 | $6,081 | $669.47 | 28% |
| Long Sutton | 17 | $5,726 | $383.88 | 46% |
| Stoke St. Michael | 10 | $5,277 | $424.04 | 42% |
| Winsham | 10 | $5,154 | $484.22 | 52% |
| Oldland Common | 13 | $5,093 | $355.47 | 43% |
| Crai | 20 | $4,799 | $371.85 | 46% |
| Dinton | 11 | $4,637 | $242.16 | 58% |
| Limpley Stoke | 10 | $4,598 | $523.47 | 52% |