East Staffordshire Airbnb Market Analysis 2025: Short Term Rental Data & Vacation Rental Statistics in England, United Kingdom
Is Airbnb profitable in East Staffordshire in 2025? Explore comprehensive Airbnb analytics for East Staffordshire, England, United Kingdom to uncover income potential. This 2025 STR market report for East Staffordshire, based on AirROI data from April 2024 to March 2025, reveals key trends in the niche market of 166 active listings.
Whether you're considering an Airbnb investment in East Staffordshire, optimizing your existing vacation rental, or exploring rental arbitrage opportunities, understanding the East Staffordshire Airbnb data is crucial. Leveraging the low regulation environment is key to maximizing your short term rental income potential. Let's dive into the specifics.
Key East Staffordshire Airbnb Performance Metrics Overview
Monthly Airbnb Revenue Variations & Income Potential in East Staffordshire (2025)
Understanding the monthly revenue variations for Airbnb listings in East Staffordshire is key to maximizing your short term rental income potential. Seasonality significantly impacts earnings. Our analysis, based on data from the past 12 months, shows that the peak revenue month for STRs in East Staffordshire is typically August, while March often presents the lowest earnings, highlighting opportunities for strategic pricing adjustments during shoulder and low seasons. Explore the typical Airbnb income in East Staffordshire across different performance tiers:
- Best-in-class properties (Top 10%) achieve $5,643+ monthly, often utilizing dynamic pricing and superior guest experiences.
- Strong performing properties (Top 25%) earn $3,423 or more, indicating effective management and desirable locations/amenities.
- Typical properties (Median) generate around $2,061 per month, representing the average market performance.
- Entry-level properties (Bottom 25%) see earnings around $998, often with potential for optimization.
Average Monthly Airbnb Earnings Trend in East Staffordshire
East Staffordshire Airbnb Occupancy Rate Trends (2025)
Maximize your bookings by understanding the East Staffordshire STR occupancy trends. Seasonal demand shifts significantly influence how often properties are booked. Typically, Augustsees the highest demand (peak season occupancy), while January experiences the lowest (low season). Effective strategies, like adjusting minimum stays or offering promotions, can boost occupancy during slower periods. Here's how different property tiers perform in East Staffordshire:
- Best-in-class properties (Top 10%) achieve 84%+ occupancy, indicating high desirability and potentially optimized availability.
- Strong performing properties (Top 25%) maintain 67% or higher occupancy, suggesting good market fit and guest satisfaction.
- Typical properties (Median) have an occupancy rate around 40%.
- Entry-level properties (Bottom 25%) average 22% occupancy, potentially facing higher vacancy.
Average Monthly Occupancy Rate Trend in East Staffordshire
Average Daily Rate (ADR) Airbnb Trends in East Staffordshire (2025)
Effective short term rental pricing strategy in East Staffordshire involves understanding monthly ADR fluctuations. The Average Daily Rate (ADR) for Airbnb in East Staffordshire typically peaks in December and dips lowest during September. Leveraging Airbnb dynamic pricing tools or strategies based on this seasonality can significantly boost revenue. Here's a look at the typical nightly rates achieved:
- Best-in-class properties (Top 10%) command rates of $322+ per night, often due to premium features or locations.
- Strong performing properties (Top 25%) achieve nightly rates of $200 or more.
- Typical properties (Median) charge around $135 per night.
- Entry-level properties (Bottom 25%) earn around $101 per night.
Average Daily Rate (ADR) Trend by Month in East Staffordshire
Get Live East Staffordshire Market Intelligence 👇

Explore Real-time Analytics
Airbnb Seasonality Analysis & Trends in East Staffordshire (2025)
Peak Season (August, December, July)
- Revenue averages $3,452 per month
- Occupancy rates average 52.0%
- Daily rates average $192
Shoulder Season
- Revenue averages $2,786 per month
- Occupancy maintains around 43.5%
- Daily rates hold near $184
Low Season (January, February, March)
- Revenue drops to average $2,327 per month
- Occupancy decreases to average 37.8%
- Daily rates adjust to average $197
Seasonality Insights for East Staffordshire
- The Airbnb seasonality in East Staffordshire shows moderate seasonality with distinct peak and low periods. While the sections above show seasonal averages, it's also insightful to look at the extremes:
- During the high season, the absolute peak month showcases East Staffordshire's highest earning potential, with monthly revenues capable of climbing to $3,641, occupancy reaching a high of 56.9%, and ADRs peaking at $204.
- Conversely, the slowest single month of the year, typically falling within the low season, marks the market's lowest point. In this month, revenue might dip to $2,130, occupancy could drop to 34.7%, and ADRs may adjust down to $180.
- Understanding both the seasonal averages and these monthly peaks and troughs in revenue, occupancy, and ADR is crucial for maximizing your Airbnb profit potential in East Staffordshire.
Seasonal Strategies for Maximizing Profit
- Peak Season: Maximize revenue through premium pricing and potentially longer minimum stays. Ensure high availability.
- Low Season: Offer competitive pricing, special promotions (e.g., extended stay discounts), and flexible cancellation policies. Target off-season travelers like remote workers or budget-conscious guests.
- Shoulder Seasons: Implement dynamic pricing that balances peak and low rates. Target weekend travelers or specific events. Offer slightly more flexible terms than peak season.
- Regularly analyze your own performance against these East Staffordshire seasonality benchmarks and adjust your pricing and availability strategy accordingly.
Best Areas for Airbnb Investment in East Staffordshire (2025)
Exploring the top neighborhoods for short-term rentals in East Staffordshire? This section highlights key areas, outlining why they are attractive for hosts and guests, along with notable local attractions. Consider these locations based on your target guest profile and investment strategy.
| Neighborhood / Area | Why Host Here? (Target Guests & Appeal) | Key Attractions & Landmarks |
|---|---|---|
| Burton upon Trent | A historical brewing town known for its rich beer heritage and festivals. Great for visitors interested in local culture and breweries. | National Brewery Centre, St. George's Park, Brewhouse Arts Centre, Burton Market Hall, The Ferrer's Centre |
| Nash | A quaint village with beautiful countryside, perfect for guests looking to escape urban life and enjoy nature. | Riverside walks, Local pubs, Nash Nature Reserve, Historic churches |
| Uttoxeter | A market town known for its racecourse and close proximity to the picturesque Peak District, appealing to outdoor enthusiasts and families. | Uttoxeter Racecourse, Bramshall Park, The Old Smithy, Tissington Trail, National Forest Adventure Farm |
| Rolleston on Dove | A charming village that offers a peaceful retreat while being close to urban amenities, great for family getaways. | Dove Valley, Local shops and pubs, Rolleston Club, Historic walkways |
| Stone | A historic market town with a vibrant community and local markets, appealing to tourists visiting nearby attractions. | Stone Station, The Town Centre, Trent & Mersey Canal, Historic buildings |
| Tatenhill | A picturesque village with beautiful views and local countryside walks, perfect for romantic getaways. | Tatenhill Airfield, Local nature walks, Countryside pubs |
| Barton-under-Needwood | A small village known for its local history and access to scenic walking routes in the national forest. | National Forest, Local history sites, Trent Valley |
| Henhurst Hill | Close to Burton, this area offers a semi-rural experience with easy access to larger town amenities, suitable for short visits. | Local parks, Henhurst Hill Nature Reserve, Pubs and eateries |
Understanding Airbnb License Requirements & STR Laws in East Staffordshire (2025)
While East Staffordshire, England, United Kingdom currently shows low STR regulations, specific Airbnb license requirements might still exist or change. Always verify the latest short term rental regulations and Airbnb license requirements directly with local government authorities for East Staffordshire to ensure full compliance before hosting.
(Source: AirROI data, 2025, finding no licensed listings among those analyzed)
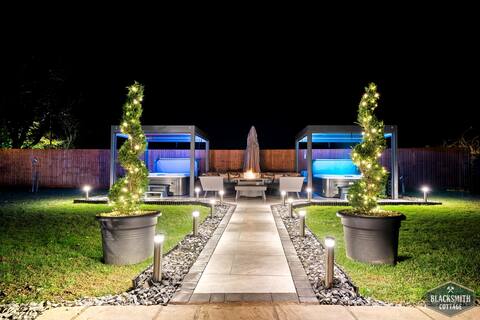
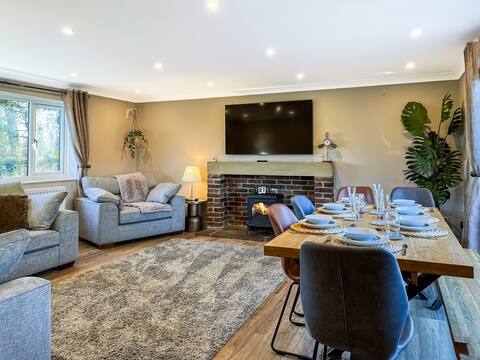
Top Performing Airbnb Properties in East Staffordshire (2025)
Benchmark your potential! Explore examples of top-performing Airbnb properties in East Staffordshirebased on Trailing Twelve Month (TTM) revenue. Analyze their characteristics, revenue, occupancy rate, and ADR to understand what drives success in this market.
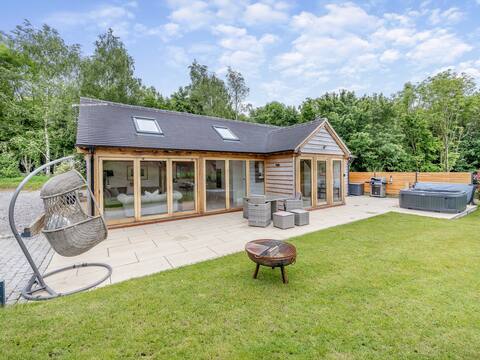
6BR luxury Cottage, Hot Tubs, Hoar Cross, Staffs
Entire Place • 6 bedrooms
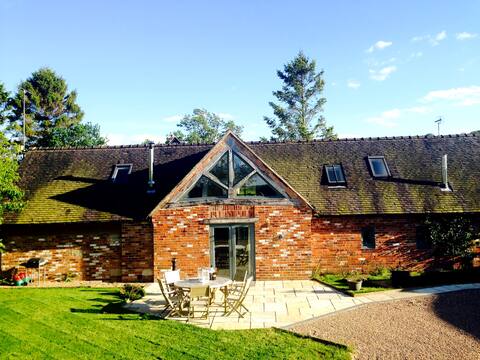
Bridge Farm
Entire Place • 4 bedrooms
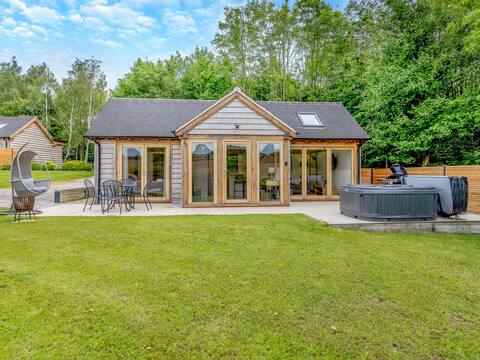
Contemporary Barn conversion with Hot Tub & field.
Entire Place • 4 bedrooms

Luxury Cottage Green Cottage, Peak District
Entire Place • 3 bedrooms
Loxford Lodge - UK47304
Entire Place • 1 bedroom
Walford Lodge - UK47305
Entire Place • 2 bedrooms
Note: Performance varies based on location, size, amenities, seasonality, and management quality. Data reflects the past 12 months.
Top Performing Airbnb Hosts in East Staffordshire (2025)
Learn from the best! This table showcases top-performing Airbnb hosts in East Staffordshire based on the number of properties managed and estimated total revenue over the past year. Analyze their scale and performance metrics.
| Host Name | Properties | Grossing Revenue | Stay Reviews | Avg Rating |
|---|---|---|---|---|
| Cottages | 15 | $689,318 | 143 | 4.48/5.0 |
| Helen & Ally | 9 | $198,139 | 116 | 3.98/5.0 |
| Ben | 1 | $170,423 | 142 | 4.85/5.0 |
| The Travel Fox | 3 | $161,754 | 153 | 4.81/5.0 |
| Adam | 2 | $159,467 | 99 | 4.83/5.0 |
| Emily | 2 | $134,556 | 36 | 2.48/5.0 |
| Jane | 5 | $128,079 | 441 | 4.94/5.0 |
| Sarah | 4 | $123,181 | 310 | 4.93/5.0 |
| Iveta | 1 | $110,410 | 37 | 5.00/5.0 |
| Claire | 3 | $109,976 | 345 | 4.96/5.0 |
Analyzing the strategies of top hosts, such as their property selection, pricing, and guest communication, can offer valuable lessons for optimizing your own Airbnb operations in East Staffordshire.
Dive Deeper: Advanced East Staffordshire STR Market Data (2025)
Ready to unlock more insights? AirROI provides access to advanced metrics and comprehensive Airbnb data for East Staffordshire. Explore detailed analytics beyond this report to refine your investment strategy, optimize pricing, and maximize your vacation rental profits.
Explore Advanced MetricsEast Staffordshire Short-Term Rental Market Composition (2025): Property & Room Types
Room Type Distribution
Property Type Distribution
Market Composition Insights for East Staffordshire
- The East Staffordshire Airbnb market composition is heavily skewed towards Entire Home/Apt listings, which make up 88% of the 166 active rentals. This indicates strong guest preference for privacy and space.
- Looking at the property type distribution in East Staffordshire, House properties are the most common (60.2%), reflecting the local real estate landscape.
- Houses represent a significant 60.2% portion, catering likely to families or larger groups.
- The presence of 5.4% Hotel/Boutique listings indicates integration with traditional hospitality.
- Smaller segments like unique stays, others (combined 7.2%) offer potential for unique stay experiences.
East Staffordshire Airbnb Room Capacity Analysis (2025): Bedroom Distribution
Distribution of Listings by Number of Bedrooms
Room Capacity Insights for East Staffordshire
- The dominant room capacity in East Staffordshire is 1 bedroom listings, making up 36.7% of the market. This suggests a strong demand for properties suitable for couples or solo travelers.
- Together, 1 bedroom and 2 bedrooms properties represent 64.4% of the active Airbnb listings in East Staffordshire, indicating a high concentration in these sizes.
- A significant 23.5% of listings offer 3+ bedrooms, catering to larger groups and families seeking more space in East Staffordshire.
East Staffordshire Vacation Rental Guest Capacity Trends (2025)
Distribution of Listings by Guest Capacity
Guest Capacity Insights for East Staffordshire
- The most common guest capacity trend in East Staffordshire vacation rentals is listings accommodating 4 guests (27.1%). This suggests the primary traveler segment is likely small families or groups.
- Properties designed for 4 guests and 2 guests dominate the East Staffordshire STR market, accounting for 52.4% of listings.
- 24.0% of properties accommodate 6+ guests, serving the market segment for larger families or group travel in East Staffordshire.
- On average, properties in East Staffordshire are equipped to host 3.9 guests.
East Staffordshire Airbnb Booking Patterns (2025): Available vs. Booked Days
Available Days Distribution
Booked Days Distribution
Booking Pattern Insights for East Staffordshire
- The most common availability pattern in East Staffordshire falls within the 271-366 days range, representing 39.2% of listings. This suggests many properties have significant open periods on their calendars.
- Approximately 62.7% of listings show high availability (181+ days open annually), indicating potential for increased bookings or specific owner usage patterns.
- For booked days, the 181-270 days range is most frequent in East Staffordshire (29.5%), reflecting common guest stay durations or potential owner blocking patterns.
- A notable 37.9% of properties secure long booking periods (181+ days booked per year), highlighting successful long-term rental strategies or significant owner usage.
East Staffordshire Airbnb Minimum Stay Requirements Analysis
Distribution of Listings by Minimum Night Requirement
1 Night
57 listings
36.1% of total
2 Nights
57 listings
36.1% of total
3 Nights
15 listings
9.5% of total
4-6 Nights
4 listings
2.5% of total
7-29 Nights
2 listings
1.3% of total
30+ Nights
23 listings
14.6% of total
Key Insights
- The most prevalent minimum stay requirement in East Staffordshire is 1 Night, adopted by 36.1% of listings. This highlights the market's preference for shorter, flexible bookings.
- A strong majority (72.2%) of the East Staffordshire Airbnb data shows acceptance of very short stays (1-2 nights), indicating a dynamic, high-turnover market.
- A significant segment (14.6%) caters to monthly stays (30+ nights) in East Staffordshire, pointing to opportunities in the extended-stay market.
Recommendations
- Align with the market by considering a 1 Night minimum stay, as 36.1% of East Staffordshire hosts use this setting.
- Explore offering discounts for stays of 30+ nights to attract the 14.6% of the market seeking extended stays.
- Adjust minimum nights based on seasonality – potentially shorter during low season and longer during peak demand periods in East Staffordshire.
East Staffordshire Airbnb Cancellation Policy Trends Analysis (2025)
Super Strict 60 Days
15 listings
10.3% of total
Flexible
36 listings
24.7% of total
Moderate
45 listings
30.8% of total
Firm
17 listings
11.6% of total
Strict
33 listings
22.6% of total
Cancellation Policy Insights for East Staffordshire
- The prevailing Airbnb cancellation policy trend in East Staffordshire is Moderate, used by 30.8% of listings.
- There's a relatively balanced mix between guest-friendly (55.5%) and stricter (34.2%) policies, offering choices for different guest needs.
Recommendations for Hosts
- Consider adopting a Moderate policy to align with the 30.8% market standard in East Staffordshire.
- Regularly review your cancellation policy against competitors and market demand shifts in East Staffordshire.
East Staffordshire STR Booking Lead Time Analysis (2025)
Average Booking Lead Time by Month
Booking Lead Time Insights for East Staffordshire
- The overall average booking lead time for vacation rentals in East Staffordshire is 45 days.
- Guests book furthest in advance for stays during May (average 90 days), likely coinciding with peak travel demand or local events.
- The shortest booking windows occur for stays in March (average 31 days), indicating more last-minute travel plans during this time.
- Seasonally, Summer (65 days avg.) sees the longest lead times, while Winter (51 days avg.) has the shortest, reflecting typical travel planning cycles.
Recommendations for Hosts
- Use the overall average lead time (45 days) as a baseline for your pricing and availability strategy in East Staffordshire.
- For May stays, consider implementing length-of-stay discounts or slightly higher rates for bookings made less than 90 days out to capitalize on advance planning.
- Target marketing efforts for the Summer season well in advance (at least 65 days) to capture early planners.
- Monitor your own booking lead times against these East Staffordshire averages to identify opportunities for dynamic pricing adjustments.
Popular & Essential Airbnb Amenities in East Staffordshire (2025)
Amenity Prevalence
Amenity Insights for East Staffordshire
- Essential amenities in East Staffordshire that guests expect include: Heating, Smoke alarm, Wifi. Lacking these (any) could significantly impact bookings.
- Popular amenities like TV, Kitchen, Free parking on premises are common but not universal. Offering these can provide a competitive edge.
Recommendations for Hosts
- Ensure your listing includes all essential amenities for East Staffordshire: Heating, Smoke alarm, Wifi.
- Prioritize adding missing essentials: Heating, Smoke alarm, Wifi.
- Consider adding popular differentiators like TV or Kitchen to increase appeal.
- Highlight unique or less common amenities you offer (e.g., hot tub, dedicated workspace, EV charger) in your listing description and photos.
- Regularly check competitor amenities in East Staffordshire to stay competitive.
East Staffordshire Airbnb Guest Demographics & Profile Analysis (2025)
Guest Profile Summary for East Staffordshire
- The typical guest profile for Airbnb in East Staffordshire consists of primarily domestic travelers (92%), often arriving from nearby England, typically belonging to the Post-2000s (Gen Z/Alpha) group (50%), primarily speaking English or French.
- Domestic travelers account for 92.3% of guests.
- Key international markets include United Kingdom (92.3%) and United States (2.2%).
- Top languages spoken are English (75.7%) followed by French (5.8%).
- A significant demographic segment is the Post-2000s (Gen Z/Alpha) group, representing 50% of guests.
Recommendations for Hosts
- Target domestic marketing efforts towards travelers from England and London.
- Tailor amenities and listing descriptions to appeal to the dominant Post-2000s (Gen Z/Alpha) demographic (e.g., highlight fast WiFi, smart home features, local guides).
- Highlight unique local experiences or amenities relevant to the primary guest profile.
- Consider seasonal promotions aligned with peak travel times for key origin markets.
Nearby Short-Term Rental Market Comparison
How does the East Staffordshire Airbnb market stack up against its neighbors? Compare key performance metrics like average monthly revenue, ADR, and occupancy rates in surrounding areas to understand the broader regional STR landscape.
| Market | Active Properties | Monthly Revenue | Daily Rate | Avg. Occupancy |
|---|---|---|---|---|
| Englishcombe | 13 | $8,558 | $573.69 | 49% |
| Dorney | 12 | $8,335 | $622.48 | 45% |
| Chew Magna | 14 | $6,649 | $399.59 | 46% |
| Lambourn | 11 | $6,081 | $669.47 | 28% |
| City of Westminster | 1,327 | $6,043 | $486.66 | 52% |
| Long Sutton | 17 | $5,726 | $383.88 | 46% |
| Stoke St. Michael | 10 | $5,277 | $424.04 | 42% |
| Oldland Common | 13 | $5,093 | $355.47 | 43% |
| Wraysbury | 14 | $4,719 | $396.18 | 46% |
| Stamford Bridge | 11 | $4,669 | $410.14 | 38% |