East Riding of Yorkshire Airbnb Market Analysis 2025: Short Term Rental Data & Vacation Rental Statistics in England, United Kingdom
Is Airbnb profitable in East Riding of Yorkshire in 2025? Explore comprehensive Airbnb analytics for East Riding of Yorkshire, England, United Kingdom to uncover income potential. This 2025 STR market report for East Riding of Yorkshire, based on AirROI data from April 2024 to March 2025, reveals key trends in the niche market of 51 active listings.
Whether you're considering an Airbnb investment in East Riding of Yorkshire, optimizing your existing vacation rental, or exploring rental arbitrage opportunities, understanding the East Riding of Yorkshire Airbnb data is crucial. Leveraging the low regulation environment is key to maximizing your short term rental income potential. Let's dive into the specifics.
Key East Riding of Yorkshire Airbnb Performance Metrics Overview
Monthly Airbnb Revenue Variations & Income Potential in East Riding of Yorkshire (2025)
Understanding the monthly revenue variations for Airbnb listings in East Riding of Yorkshire is key to maximizing your short term rental income potential. Seasonality significantly impacts earnings. Our analysis, based on data from the past 12 months, shows that the peak revenue month for STRs in East Riding of Yorkshire is typically August, while November often presents the lowest earnings, highlighting opportunities for strategic pricing adjustments during shoulder and low seasons. Explore the typical Airbnb income in East Riding of Yorkshire across different performance tiers:
- Best-in-class properties (Top 10%) achieve $7,294+ monthly, often utilizing dynamic pricing and superior guest experiences.
- Strong performing properties (Top 25%) earn $3,653 or more, indicating effective management and desirable locations/amenities.
- Typical properties (Median) generate around $1,979 per month, representing the average market performance.
- Entry-level properties (Bottom 25%) see earnings around $1,133, often with potential for optimization.
Average Monthly Airbnb Earnings Trend in East Riding of Yorkshire
East Riding of Yorkshire Airbnb Occupancy Rate Trends (2025)
Maximize your bookings by understanding the East Riding of Yorkshire STR occupancy trends. Seasonal demand shifts significantly influence how often properties are booked. Typically, Julysees the highest demand (peak season occupancy), while June experiences the lowest (low season). Effective strategies, like adjusting minimum stays or offering promotions, can boost occupancy during slower periods. Here's how different property tiers perform in East Riding of Yorkshire:
- Best-in-class properties (Top 10%) achieve 83%+ occupancy, indicating high desirability and potentially optimized availability.
- Strong performing properties (Top 25%) maintain 60% or higher occupancy, suggesting good market fit and guest satisfaction.
- Typical properties (Median) have an occupancy rate around 32%.
- Entry-level properties (Bottom 25%) average 14% occupancy, potentially facing higher vacancy.
Average Monthly Occupancy Rate Trend in East Riding of Yorkshire
Average Daily Rate (ADR) Airbnb Trends in East Riding of Yorkshire (2025)
Effective short term rental pricing strategy in East Riding of Yorkshire involves understanding monthly ADR fluctuations. The Average Daily Rate (ADR) for Airbnb in East Riding of Yorkshire typically peaks in August and dips lowest during December. Leveraging Airbnb dynamic pricing tools or strategies based on this seasonality can significantly boost revenue. Here's a look at the typical nightly rates achieved:
- Best-in-class properties (Top 10%) command rates of $438+ per night, often due to premium features or locations.
- Strong performing properties (Top 25%) achieve nightly rates of $353 or more.
- Typical properties (Median) charge around $253 per night.
- Entry-level properties (Bottom 25%) earn around $131 per night.
Average Daily Rate (ADR) Trend by Month in East Riding of Yorkshire
Get Live East Riding of Yorkshire Market Intelligence 👇

Explore Real-time Analytics
Airbnb Seasonality Analysis & Trends in East Riding of Yorkshire (2025)
Peak Season (August, July, May)
- Revenue averages $3,988 per month
- Occupancy rates average 46.4%
- Daily rates average $313
Shoulder Season
- Revenue averages $2,765 per month
- Occupancy maintains around 36.8%
- Daily rates hold near $267
Low Season (January, March, November)
- Revenue drops to average $2,330 per month
- Occupancy decreases to average 35.6%
- Daily rates adjust to average $220
Seasonality Insights for East Riding of Yorkshire
- The Airbnb seasonality in East Riding of Yorkshire shows highly seasonal trends requiring careful strategy. While the sections above show seasonal averages, it's also insightful to look at the extremes:
- During the high season, the absolute peak month showcases East Riding of Yorkshire's highest earning potential, with monthly revenues capable of climbing to $4,591, occupancy reaching a high of 49.8%, and ADRs peaking at $328.
- Conversely, the slowest single month of the year, typically falling within the low season, marks the market's lowest point. In this month, revenue might dip to $1,968, occupancy could drop to 31.4%, and ADRs may adjust down to $210.
- Understanding both the seasonal averages and these monthly peaks and troughs in revenue, occupancy, and ADR is crucial for maximizing your Airbnb profit potential in East Riding of Yorkshire.
Seasonal Strategies for Maximizing Profit
- Peak Season: Maximize revenue through premium pricing and potentially longer minimum stays. Ensure high availability.
- Low Season: Offer competitive pricing, special promotions (e.g., extended stay discounts), and flexible cancellation policies. Target off-season travelers like remote workers or budget-conscious guests.
- Shoulder Seasons: Implement dynamic pricing that balances peak and low rates. Target weekend travelers or specific events. Offer slightly more flexible terms than peak season.
- Regularly analyze your own performance against these East Riding of Yorkshire seasonality benchmarks and adjust your pricing and availability strategy accordingly.
Best Areas for Airbnb Investment in East Riding of Yorkshire (2025)
Exploring the top neighborhoods for short-term rentals in East Riding of Yorkshire? This section highlights key areas, outlining why they are attractive for hosts and guests, along with notable local attractions. Consider these locations based on your target guest profile and investment strategy.
| Neighborhood / Area | Why Host Here? (Target Guests & Appeal) | Key Attractions & Landmarks |
|---|---|---|
| York | Historic city with a rich heritage, attracting tourists for its medieval architecture, vibrant cultural scene, and famous attractions like York Minster and the National Railway Museum. | York Minster, National Railway Museum, The Shambles, Jorvik Viking Centre, Clifford's Tower, York Castle Museum |
| Bridlington | Popular seaside resort known for its sandy beaches and family-friendly attractions, making it a favorite for summer holidays and weekend getaways. | Bridlington Beach, Bridlington Spa, Royal Oldham Golf Club, Danes Dyke, Bempton Cliffs, The Treasure Island Adventure Park |
| Scarborough | Famous coastal town with beautiful beaches, a historic castle, and a lively promenade. Great for both tourists and locals seeking short breaks by the sea. | Scarborough Castle, South Bay Beach, Peasholm Park, Scarborough Open Air Theatre, Sea Life Scarborough, North Bay Railway |
| Hornsea | Charming coastal town known for its long sandy beach and Hornsea Mere, ideal for nature and outdoor enthusiasts looking for a peaceful getaway. | Hornsea Beach, Hornsea Mere, Sea Life Sanctuary, Hornsea Museum, Trans Pennine Trail, The Old Rectory |
| Market Weighton | Picturesque market town offering a mix of rural charm and community spirit, appealing to travelers looking for a tranquil countryside experience. | Market Weighton Canal, Allerthorpe Lakeland Park, The Yorkshire Wolds, Yorkshire Lavender, Saint John's Church, The Old Mill |
| Pocklington | Historic market town with beautiful surroundings, ideal for visitors wanting to explore the Yorkshire Wolds and enjoy local cuisine and shopping. | Pocklington Canal, Burnby Hall Gardens, The Feathers Hotel, Wolds Way Walk, Barmby Moor, The Pocklington Arts Centre |
| Beverley | Attractive market town known for its stunning Minster and vibrant town centre, drawing tourists for its history, shopping, and dining options. | Beverley Minster, The East Riding Treasure House, Westwood, Beverley Racecourse, St. Mary's Church, Beverley Market |
| Goole | Major port town with great connections and a growing interest in tourism, especially for those exploring the surrounding East Riding region. | Goole Museum, The Ouse and Humber Estuary, Goole Docks, Riverside Walk, Goole Golf Club, The Junction |
Understanding Airbnb License Requirements & STR Laws in East Riding of Yorkshire (2025)
While East Riding of Yorkshire, England, United Kingdom currently shows low STR regulations, specific Airbnb license requirements might still exist or change. Always verify the latest short term rental regulations and Airbnb license requirements directly with local government authorities for East Riding of Yorkshire to ensure full compliance before hosting.
(Source: AirROI data, 2025, finding no licensed listings among those analyzed)
Top Performing Airbnb Properties in East Riding of Yorkshire (2025)
Benchmark your potential! Explore examples of top-performing Airbnb properties in East Riding of Yorkshirebased on Trailing Twelve Month (TTM) revenue. Analyze their characteristics, revenue, occupancy rate, and ADR to understand what drives success in this market.

Spa Utopia
Private Room • 4 bedrooms

Dreamwood Spa
Private Room • 3 bedrooms
Spa Pacific
Private Room • 3 bedrooms
Spa
Private Room • 2 bedrooms
Spa Hideaway
Private Room • 1 bedroom

Larchwood Spa
Private Room • 2 bedrooms
Note: Performance varies based on location, size, amenities, seasonality, and management quality. Data reflects the past 12 months.
Top Performing Airbnb Hosts in East Riding of Yorkshire (2025)
Learn from the best! This table showcases top-performing Airbnb hosts in East Riding of Yorkshire based on the number of properties managed and estimated total revenue over the past year. Analyze their scale and performance metrics.
| Host Name | Properties | Grossing Revenue | Stay Reviews | Avg Rating |
|---|---|---|---|---|
| Hoseasons | 22 | $889,981 | 170 | 2.90/5.0 |
| Cottages | 3 | $69,095 | 4 | 1.67/5.0 |
| Neil | 3 | $58,890 | 237 | 4.94/5.0 |
| April | 1 | $31,354 | 32 | 4.91/5.0 |
| Christopher | 1 | $23,110 | 157 | 4.85/5.0 |
| Karen | 1 | $22,944 | 93 | 4.85/5.0 |
| Robert | 1 | $19,719 | 48 | 4.92/5.0 |
| Sandra | 1 | $19,675 | 179 | 4.83/5.0 |
| Travelnest | 3 | $19,344 | 52 | 4.68/5.0 |
| Amanda | 1 | $16,806 | 59 | 4.73/5.0 |
Analyzing the strategies of top hosts, such as their property selection, pricing, and guest communication, can offer valuable lessons for optimizing your own Airbnb operations in East Riding of Yorkshire.
Dive Deeper: Advanced East Riding of Yorkshire STR Market Data (2025)
Ready to unlock more insights? AirROI provides access to advanced metrics and comprehensive Airbnb data for East Riding of Yorkshire. Explore detailed analytics beyond this report to refine your investment strategy, optimize pricing, and maximize your vacation rental profits.
Explore Advanced MetricsEast Riding of Yorkshire Short-Term Rental Market Composition (2025): Property & Room Types
Room Type Distribution
Property Type Distribution
Market Composition Insights for East Riding of Yorkshire
- The East Riding of Yorkshire Airbnb market composition is heavily skewed towards Entire Home/Apt listings, which make up 60.8% of the 51 active rentals. This indicates strong guest preference for privacy and space.
- However, a notable 39.2% share for Private Rooms suggests opportunities for budget-conscious travelers or hosts renting out spare rooms.
- Looking at the property type distribution in East Riding of Yorkshire, Outdoor/Unique properties are the most common (60.8%), reflecting the local real estate landscape.
- Houses represent a significant 35.3% portion, catering likely to families or larger groups.
- Smaller segments like others, apartment/condo (combined 4.0%) offer potential for unique stay experiences.
East Riding of Yorkshire Airbnb Room Capacity Analysis (2025): Bedroom Distribution
Distribution of Listings by Number of Bedrooms
Room Capacity Insights for East Riding of Yorkshire
- The dominant room capacity in East Riding of Yorkshire is 2 bedrooms listings, making up 51% of the market. This suggests a strong demand for properties suitable for couples or solo travelers.
- Together, 2 bedrooms and 1 bedroom properties represent 74.5% of the active Airbnb listings in East Riding of Yorkshire, indicating a high concentration in these sizes.
- A significant 23.5% of listings offer 3+ bedrooms, catering to larger groups and families seeking more space in East Riding of Yorkshire.
East Riding of Yorkshire Vacation Rental Guest Capacity Trends (2025)
Distribution of Listings by Guest Capacity
Guest Capacity Insights for East Riding of Yorkshire
- The most common guest capacity trend in East Riding of Yorkshire vacation rentals is listings accommodating 4 guests (41.2%). This suggests the primary traveler segment is likely small families or groups.
- Properties designed for 4 guests and 2 guests dominate the East Riding of Yorkshire STR market, accounting for 68.7% of listings.
- 23.5% of properties accommodate 6+ guests, serving the market segment for larger families or group travel in East Riding of Yorkshire.
- On average, properties in East Riding of Yorkshire are equipped to host 4.1 guests.
East Riding of Yorkshire Airbnb Booking Patterns (2025): Available vs. Booked Days
Available Days Distribution
Booked Days Distribution
Booking Pattern Insights for East Riding of Yorkshire
- The most common availability pattern in East Riding of Yorkshire falls within the 271-366 days range, representing 52.9% of listings. This suggests many properties have significant open periods on their calendars.
- Approximately 78.4% of listings show high availability (181+ days open annually), indicating potential for increased bookings or specific owner usage patterns.
- For booked days, the 1-30 days range is most frequent in East Riding of Yorkshire (29.4%), reflecting common guest stay durations or potential owner blocking patterns.
- A notable 27.5% of properties secure long booking periods (181+ days booked per year), highlighting successful long-term rental strategies or significant owner usage.
East Riding of Yorkshire Airbnb Minimum Stay Requirements Analysis
Distribution of Listings by Minimum Night Requirement
1 Night
23 listings
50% of total
2 Nights
13 listings
28.3% of total
3 Nights
3 listings
6.5% of total
4-6 Nights
1 listings
2.2% of total
30+ Nights
6 listings
13% of total
Key Insights
- The most prevalent minimum stay requirement in East Riding of Yorkshire is 1 Night, adopted by 50% of listings. This highlights the market's preference for shorter, flexible bookings.
- A strong majority (78.3%) of the East Riding of Yorkshire Airbnb data shows acceptance of very short stays (1-2 nights), indicating a dynamic, high-turnover market.
- A significant segment (13%) caters to monthly stays (30+ nights) in East Riding of Yorkshire, pointing to opportunities in the extended-stay market.
Recommendations
- Align with the market by considering a 1 Night minimum stay, as 50% of East Riding of Yorkshire hosts use this setting.
- Explore offering discounts for stays of 30+ nights to attract the 13% of the market seeking extended stays.
- Adjust minimum nights based on seasonality – potentially shorter during low season and longer during peak demand periods in East Riding of Yorkshire.
East Riding of Yorkshire Airbnb Cancellation Policy Trends Analysis (2025)
Super Strict 60 Days
14 listings
42.4% of total
Flexible
6 listings
18.2% of total
Moderate
8 listings
24.2% of total
Firm
3 listings
9.1% of total
Strict
2 listings
6.1% of total
Cancellation Policy Insights for East Riding of Yorkshire
- The prevailing Airbnb cancellation policy trend in East Riding of Yorkshire is Super Strict 60 Days, used by 42.4% of listings.
- There's a relatively balanced mix between guest-friendly (42.4%) and stricter (15.2%) policies, offering choices for different guest needs.
- Strict cancellation policies are quite rare (6.1%), potentially making listings with this policy less competitive unless justified by high demand or property type.
Recommendations for Hosts
- Consider adopting a Super Strict 60 Days policy to align with the 42.4% market standard in East Riding of Yorkshire.
- Using a Strict policy might deter some guests, as only 6.1% of listings use it. Evaluate if potential revenue protection outweighs possible lower booking rates.
- Regularly review your cancellation policy against competitors and market demand shifts in East Riding of Yorkshire.
East Riding of Yorkshire STR Booking Lead Time Analysis (2025)
Average Booking Lead Time by Month
Booking Lead Time Insights for East Riding of Yorkshire
- The overall average booking lead time for vacation rentals in East Riding of Yorkshire is 66 days.
- Guests book furthest in advance for stays during May (average 102 days), likely coinciding with peak travel demand or local events.
- The shortest booking windows occur for stays in July (average 62 days), indicating more last-minute travel plans during this time.
- Seasonally, Fall (88 days avg.) sees the longest lead times, while Summer (70 days avg.) has the shortest, reflecting typical travel planning cycles.
Recommendations for Hosts
- Use the overall average lead time (66 days) as a baseline for your pricing and availability strategy in East Riding of Yorkshire.
- For May stays, consider implementing length-of-stay discounts or slightly higher rates for bookings made less than 102 days out to capitalize on advance planning.
- Target marketing efforts for the Fall season well in advance (at least 88 days) to capture early planners.
- Monitor your own booking lead times against these East Riding of Yorkshire averages to identify opportunities for dynamic pricing adjustments.
Popular & Essential Airbnb Amenities in East Riding of Yorkshire (2025)
Amenity Prevalence
Amenity Insights for East Riding of Yorkshire
- Essential amenities in East Riding of Yorkshire that guests expect include: Kitchen, Smoke alarm, Heating, TV, Free parking on premises, Wifi. Lacking these (any) could significantly impact bookings.
- Popular amenities like Refrigerator, Dishes and silverware, Cooking basics are common but not universal. Offering these can provide a competitive edge.
Recommendations for Hosts
- Ensure your listing includes all essential amenities for East Riding of Yorkshire: Kitchen, Smoke alarm, Heating, TV, Free parking on premises, Wifi.
- Prioritize adding missing essentials: Free parking on premises, Wifi.
- Consider adding popular differentiators like Refrigerator or Dishes and silverware to increase appeal.
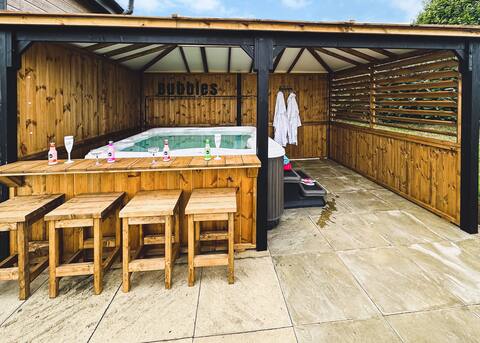
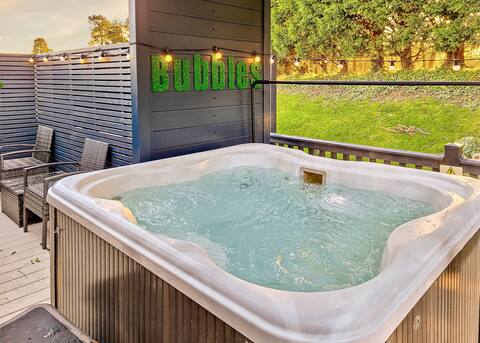
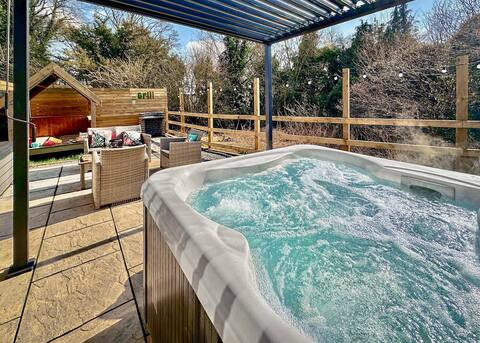
- Highlight unique or less common amenities you offer (e.g., hot tub, dedicated workspace, EV charger) in your listing description and photos.
- Regularly check competitor amenities in East Riding of Yorkshire to stay competitive.
East Riding of Yorkshire Airbnb Guest Demographics & Profile Analysis (2025)
Guest Profile Summary for East Riding of Yorkshire
- The typical guest profile for Airbnb in East Riding of Yorkshire consists of primarily domestic travelers (98%), often arriving from nearby England, typically belonging to the Post-2000s (Gen Z/Alpha) group (50%), primarily speaking English or German.
- Domestic travelers account for 97.5% of guests.
- Key international markets include United Kingdom (97.5%) and Canada (1%).
- Top languages spoken are English (89.7%) followed by German (4.4%).
- A significant demographic segment is the Post-2000s (Gen Z/Alpha) group, representing 50% of guests.
Recommendations for Hosts
- Target domestic marketing efforts towards travelers from England and Nottingham.
- Tailor amenities and listing descriptions to appeal to the dominant Post-2000s (Gen Z/Alpha) demographic (e.g., highlight fast WiFi, smart home features, local guides).
- Highlight unique local experiences or amenities relevant to the primary guest profile.
- Consider seasonal promotions aligned with peak travel times for key origin markets.
Nearby Short-Term Rental Market Comparison
How does the East Riding of Yorkshire Airbnb market stack up against its neighbors? Compare key performance metrics like average monthly revenue, ADR, and occupancy rates in surrounding areas to understand the broader regional STR landscape.
| Market | Active Properties | Monthly Revenue | Daily Rate | Avg. Occupancy |
|---|---|---|---|---|
| Grinton | 14 | $5,456 | $365.05 | 51% |
| Stamford Bridge | 11 | $4,669 | $410.14 | 38% |
| Appleby | 10 | $4,577 | $332.39 | 44% |
| Flore | 10 | $4,534 | $347.03 | 40% |
| Hayton | 13 | $4,333 | $239.53 | 60% |
| Bishop Monkton | 11 | $3,999 | $272.00 | 48% |
| Escrick | 10 | $3,849 | $322.07 | 44% |
| Southburn | 18 | $3,837 | $225.12 | 49% |
| Ravensworth | 10 | $3,717 | $203.76 | 57% |
| Blubberhouses | 11 | $3,457 | $361.37 | 41% |