East Lindsey Airbnb Market Analysis 2025: Short Term Rental Data & Vacation Rental Statistics in England, United Kingdom
Is Airbnb profitable in East Lindsey in 2025? Explore comprehensive Airbnb analytics for East Lindsey, England, United Kingdom to uncover income potential. This 2025 STR market report for East Lindsey, based on AirROI data from April 2024 to March 2025, reveals key trends in the bustling market of 1,140 active listings.
Whether you're considering an Airbnb investment in East Lindsey, optimizing your existing vacation rental, or exploring rental arbitrage opportunities, understanding the East Lindsey Airbnb data is crucial. Leveraging the low regulation environment is key to maximizing your short term rental income potential. Let's dive into the specifics.
Key East Lindsey Airbnb Performance Metrics Overview
Monthly Airbnb Revenue Variations & Income Potential in East Lindsey (2025)
Understanding the monthly revenue variations for Airbnb listings in East Lindsey is key to maximizing your short term rental income potential. Seasonality significantly impacts earnings. Our analysis, based on data from the past 12 months, shows that the peak revenue month for STRs in East Lindsey is typically August, while March often presents the lowest earnings, highlighting opportunities for strategic pricing adjustments during shoulder and low seasons. Explore the typical Airbnb income in East Lindsey across different performance tiers:
- Best-in-class properties (Top 10%) achieve $5,124+ monthly, often utilizing dynamic pricing and superior guest experiences.
- Strong performing properties (Top 25%) earn $3,023 or more, indicating effective management and desirable locations/amenities.
- Typical properties (Median) generate around $1,653 per month, representing the average market performance.
- Entry-level properties (Bottom 25%) see earnings around $793, often with potential for optimization.
Average Monthly Airbnb Earnings Trend in East Lindsey
East Lindsey Airbnb Occupancy Rate Trends (2025)
Maximize your bookings by understanding the East Lindsey STR occupancy trends. Seasonal demand shifts significantly influence how often properties are booked. Typically, Augustsees the highest demand (peak season occupancy), while March experiences the lowest (low season). Effective strategies, like adjusting minimum stays or offering promotions, can boost occupancy during slower periods. Here's how different property tiers perform in East Lindsey:
- Best-in-class properties (Top 10%) achieve 76%+ occupancy, indicating high desirability and potentially optimized availability.
- Strong performing properties (Top 25%) maintain 55% or higher occupancy, suggesting good market fit and guest satisfaction.
- Typical properties (Median) have an occupancy rate around 33%.
- Entry-level properties (Bottom 25%) average 16% occupancy, potentially facing higher vacancy.
Average Monthly Occupancy Rate Trend in East Lindsey
Average Daily Rate (ADR) Airbnb Trends in East Lindsey (2025)
Effective short term rental pricing strategy in East Lindsey involves understanding monthly ADR fluctuations. The Average Daily Rate (ADR) for Airbnb in East Lindsey typically peaks in August and dips lowest during March. Leveraging Airbnb dynamic pricing tools or strategies based on this seasonality can significantly boost revenue. Here's a look at the typical nightly rates achieved:
- Best-in-class properties (Top 10%) command rates of $331+ per night, often due to premium features or locations.
- Strong performing properties (Top 25%) achieve nightly rates of $217 or more.
- Typical properties (Median) charge around $140 per night.
- Entry-level properties (Bottom 25%) earn around $103 per night.
Average Daily Rate (ADR) Trend by Month in East Lindsey
Get Live East Lindsey Market Intelligence 👇

Explore Real-time Analytics
Airbnb Seasonality Analysis & Trends in East Lindsey (2025)
Peak Season (August, May, July)
- Revenue averages $3,041 per month
- Occupancy rates average 46.6%
- Daily rates average $211
Shoulder Season
- Revenue averages $2,366 per month
- Occupancy maintains around 36.4%
- Daily rates hold near $198
Low Season (January, March, November)
- Revenue drops to average $1,940 per month
- Occupancy decreases to average 31.4%
- Daily rates adjust to average $182
Seasonality Insights for East Lindsey
- The Airbnb seasonality in East Lindsey shows highly seasonal trends requiring careful strategy. While the sections above show seasonal averages, it's also insightful to look at the extremes:
- During the high season, the absolute peak month showcases East Lindsey's highest earning potential, with monthly revenues capable of climbing to $3,597, occupancy reaching a high of 58.7%, and ADRs peaking at $215.
- Conversely, the slowest single month of the year, typically falling within the low season, marks the market's lowest point. In this month, revenue might dip to $1,583, occupancy could drop to 26.4%, and ADRs may adjust down to $178.
- Understanding both the seasonal averages and these monthly peaks and troughs in revenue, occupancy, and ADR is crucial for maximizing your Airbnb profit potential in East Lindsey.
Seasonal Strategies for Maximizing Profit
- Peak Season: Maximize revenue through premium pricing and potentially longer minimum stays. Ensure high availability.
- Low Season: Offer competitive pricing, special promotions (e.g., extended stay discounts), and flexible cancellation policies. Target off-season travelers like remote workers or budget-conscious guests.
- Shoulder Seasons: Implement dynamic pricing that balances peak and low rates. Target weekend travelers or specific events. Offer slightly more flexible terms than peak season.
- Regularly analyze your own performance against these East Lindsey seasonality benchmarks and adjust your pricing and availability strategy accordingly.
Best Areas for Airbnb Investment in East Lindsey (2025)
Exploring the top neighborhoods for short-term rentals in East Lindsey? This section highlights key areas, outlining why they are attractive for hosts and guests, along with notable local attractions. Consider these locations based on your target guest profile and investment strategy.
| Neighborhood / Area | Why Host Here? (Target Guests & Appeal) | Key Attractions & Landmarks |
|---|---|---|
| Skegness | The most popular seaside resort in East Lindsey, known for its beaches and family-friendly attractions. Ideal for hosting tourists during the summer months. | Skegness Pier, Fantasy Island, Bottons Pleasure Beach, Skegness Natureland Seal Sanctuary, Skegness Beach |
| Louth | A historic market town with rich local culture, great shops, and restaurants. Attracts both tourists and business travelers. | Louth Town Centre, St. James' Church, The Hubbard's Hills, Louth Museum, Monks' Dyke Tennyson College |
| Mablethorpe | A quieter seaside resort with beautiful sandy beaches and a relaxed atmosphere. Popular for family holidays and weekend getaways. | Mablethorpe Beach, The Mermaid Centre, Mablethorpe Seal Sanctuary, Sand Train, Lakeside Leisure Park |
| Horncastle | Known for its antique shops and as a gateway to the Lincolnshire Wolds. Great for tourists interested in history and rural visits. | Horncastle Antique Centre, St Mary's Church, The Old Nick Theatre, The Lincolnshire Wolds, Lincolnshire Wildlife Park |
| Cromer | A charming seaside town famous for its crabs and traditional pier. Perfect for weekend breaks and summer vacations. | Cromer Pier, The Amazona Zoo, Cromer Beach, RNLI Henry Blogg Museum, Sheringham Park |
| Lincoln | A historic city featuring Lincoln Castle and the stunning cathedral. Attracts visitors all year round for heritage tourism. | Lincoln Cathedral, Lincoln Castle, The Brayford Waterfront, The Steep Hill, The Museum of Lincolnshire Life |
| Alford | Known for its historic buildings and the Alford Manor House. A peaceful location for those seeking a slower pace of life. | Alford Manor House, St Wilfrid's Church, The Alford Five Sailed Windmill, Alford Craft Market |
| Woodhall Spa | A picturesque spa town with a rich history and a well-known golf course. Attractive for those seeking relaxation and leisure. | The Dambusters Memorial, Woodhall Spa Cottage Museum, The National Golf Centre, Kinema in the Woods, Hollybush Spa |
Understanding Airbnb License Requirements & STR Laws in East Lindsey (2025)
While East Lindsey, England, United Kingdom currently shows low STR regulations, specific Airbnb license requirements might still exist or change. Always verify the latest short term rental regulations and Airbnb license requirements directly with local government authorities for East Lindsey to ensure full compliance before hosting.
(Source: AirROI data, 2025, based on 0% licensed listings)
Top Performing Airbnb Properties in East Lindsey (2025)
Benchmark your potential! Explore examples of top-performing Airbnb properties in East Lindseybased on Trailing Twelve Month (TTM) revenue. Analyze their characteristics, revenue, occupancy rate, and ADR to understand what drives success in this market.

Rent an Entire 16th Century Droving Inn
Entire Place • 6 bedrooms

Georgian house with indoor pool and games room
Entire Place • 12 bedrooms

Northolme Hall - Large Country Mansion with Pool
Entire Place • 10 bedrooms
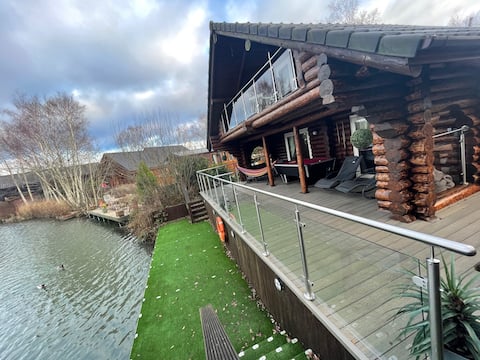
Woodpecker log cabin with fishing, pizza oven, hot
Entire Place • 3 bedrooms
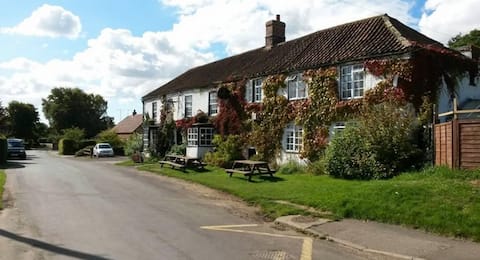
Run a pub as your own
Entire Place • 6 bedrooms

iLodge Ultra
Entire Place • 5 bedrooms
Note: Performance varies based on location, size, amenities, seasonality, and management quality. Data reflects the past 12 months.
Top Performing Airbnb Hosts in East Lindsey (2025)
Learn from the best! This table showcases top-performing Airbnb hosts in East Lindsey based on the number of properties managed and estimated total revenue over the past year. Analyze their scale and performance metrics.
| Host Name | Properties | Grossing Revenue | Stay Reviews | Avg Rating |
|---|---|---|---|---|
| Cottages | 190 | $4,827,822 | 769 | 2.57/5.0 |
| Rachel | 13 | $1,294,771 | 146 | 4.81/5.0 |
| Hoseasons | 56 | $561,657 | 83 | 0.79/5.0 |
| 2cHolidays | 48 | $540,880 | 370 | 3.67/5.0 |
| Richard | 2 | $493,119 | 96 | 4.90/5.0 |
| Claire | 15 | $377,740 | 404 | 4.49/5.0 |
| Rebecca | 13 | $301,370 | 80 | 3.67/5.0 |
| Elizabeth | 2 | $272,282 | 14 | 4.95/5.0 |
| Scott | 2 | $264,765 | 90 | 4.98/5.0 |
| Abigail | 4 | $243,205 | 33 | 4.86/5.0 |
Analyzing the strategies of top hosts, such as their property selection, pricing, and guest communication, can offer valuable lessons for optimizing your own Airbnb operations in East Lindsey.
Dive Deeper: Advanced East Lindsey STR Market Data (2025)
Ready to unlock more insights? AirROI provides access to advanced metrics and comprehensive Airbnb data for East Lindsey. Explore detailed analytics beyond this report to refine your investment strategy, optimize pricing, and maximize your vacation rental profits.
Explore Advanced MetricsEast Lindsey Short-Term Rental Market Composition (2025): Property & Room Types
Room Type Distribution
Property Type Distribution
Market Composition Insights for East Lindsey
- The East Lindsey Airbnb market composition is heavily skewed towards Entire Home/Apt listings, which make up 94.4% of the 1,140 active rentals. This indicates strong guest preference for privacy and space.
- Looking at the property type distribution in East Lindsey, House properties are the most common (49.3%), reflecting the local real estate landscape.
- Houses represent a significant 49.3% portion, catering likely to families or larger groups.
- Smaller segments like hotel/boutique, unique stays (combined 6.9%) offer potential for unique stay experiences.
East Lindsey Airbnb Room Capacity Analysis (2025): Bedroom Distribution
Distribution of Listings by Number of Bedrooms
Room Capacity Insights for East Lindsey
- The dominant room capacity in East Lindsey is 2 bedrooms listings, making up 38.2% of the market. This suggests a strong demand for properties suitable for couples or solo travelers.
- Together, 2 bedrooms and 3 bedrooms properties represent 68.3% of the active Airbnb listings in East Lindsey, indicating a high concentration in these sizes.
- A significant 36.8% of listings offer 3+ bedrooms, catering to larger groups and families seeking more space in East Lindsey.
East Lindsey Vacation Rental Guest Capacity Trends (2025)
Distribution of Listings by Guest Capacity
Guest Capacity Insights for East Lindsey
- The most common guest capacity trend in East Lindsey vacation rentals is listings accommodating 6 guests (26.7%). This suggests the primary traveler segment is likely larger groups.
- Properties designed for 6 guests and 4 guests dominate the East Lindsey STR market, accounting for 49.7% of listings.
- 49.3% of properties accommodate 6+ guests, serving the market segment for larger families or group travel in East Lindsey.
- On average, properties in East Lindsey are equipped to host 5.0 guests.
East Lindsey Airbnb Booking Patterns (2025): Available vs. Booked Days
Available Days Distribution
Booked Days Distribution
Booking Pattern Insights for East Lindsey
- The most common availability pattern in East Lindsey falls within the 271-366 days range, representing 49.4% of listings. This suggests many properties have significant open periods on their calendars.
- Approximately 80.6% of listings show high availability (181+ days open annually), indicating potential for increased bookings or specific owner usage patterns.
- For booked days, the 91-180 days range is most frequent in East Lindsey (31.1%), reflecting common guest stay durations or potential owner blocking patterns.
- A notable 20.8% of properties secure long booking periods (181+ days booked per year), highlighting successful long-term rental strategies or significant owner usage.
East Lindsey Airbnb Minimum Stay Requirements Analysis
Distribution of Listings by Minimum Night Requirement
1 Night
354 listings
33.7% of total
2 Nights
366 listings
34.9% of total
3 Nights
191 listings
18.2% of total
4-6 Nights
12 listings
1.1% of total
7-29 Nights
6 listings
0.6% of total
30+ Nights
121 listings
11.5% of total
Key Insights
- The most prevalent minimum stay requirement in East Lindsey is 2 Nights, adopted by 34.9% of listings. This highlights the market's preference for shorter, flexible bookings.
- A strong majority (68.6%) of the East Lindsey Airbnb data shows acceptance of very short stays (1-2 nights), indicating a dynamic, high-turnover market.
- A significant segment (11.5%) caters to monthly stays (30+ nights) in East Lindsey, pointing to opportunities in the extended-stay market.
Recommendations
- Align with the market by considering a 2 Nights minimum stay, as 34.9% of East Lindsey hosts use this setting.
- Explore offering discounts for stays of 30+ nights to attract the 11.5% of the market seeking extended stays.
- Adjust minimum nights based on seasonality – potentially shorter during low season and longer during peak demand periods in East Lindsey.
East Lindsey Airbnb Cancellation Policy Trends Analysis (2025)
Super Strict 60 Days
130 listings
14.8% of total
Non-refundable
5 listings
0.6% of total
Super Strict 30 Days
14 listings
1.6% of total
Refundable
3 listings
0.3% of total
Flexible
138 listings
15.7% of total
Moderate
166 listings
18.9% of total
Firm
199 listings
22.7% of total
Strict
222 listings
25.3% of total
Cancellation Policy Insights for East Lindsey
- The prevailing Airbnb cancellation policy trend in East Lindsey is Strict, used by 25.3% of listings.
- There's a relatively balanced mix between guest-friendly (34.6%) and stricter (48.0%) policies, offering choices for different guest needs.
Recommendations for Hosts
- Consider adopting a Strict policy to align with the 25.3% market standard in East Lindsey.
- Regularly review your cancellation policy against competitors and market demand shifts in East Lindsey.
East Lindsey STR Booking Lead Time Analysis (2025)
Average Booking Lead Time by Month
Booking Lead Time Insights for East Lindsey
- The overall average booking lead time for vacation rentals in East Lindsey is 60 days.
- Guests book furthest in advance for stays during May (average 105 days), likely coinciding with peak travel demand or local events.
- The shortest booking windows occur for stays in March (average 50 days), indicating more last-minute travel plans during this time.
- Seasonally, Summer (86 days avg.) sees the longest lead times, while Winter (61 days avg.) has the shortest, reflecting typical travel planning cycles.
Recommendations for Hosts
- Use the overall average lead time (60 days) as a baseline for your pricing and availability strategy in East Lindsey.
- For May stays, consider implementing length-of-stay discounts or slightly higher rates for bookings made less than 105 days out to capitalize on advance planning.
- Target marketing efforts for the Summer season well in advance (at least 86 days) to capture early planners.
- Monitor your own booking lead times against these East Lindsey averages to identify opportunities for dynamic pricing adjustments.
Popular & Essential Airbnb Amenities in East Lindsey (2025)
Amenity Prevalence
Amenity Insights for East Lindsey
- Essential amenities in East Lindsey that guests expect include: Smoke alarm, Heating. Lacking these (any) could significantly impact bookings.
- Popular amenities like TV, Kitchen, Free parking on premises are common but not universal. Offering these can provide a competitive edge.
- Warning: Wifi is not universally provided but is considered essential globally. Ensure reliable Wifi is offered.
Recommendations for Hosts
- Ensure your listing includes all essential amenities for East Lindsey: Smoke alarm, Heating.
- Prioritize adding missing essentials: Smoke alarm, Heating.
- Consider adding popular differentiators like TV or Kitchen to increase appeal.
- Highlight unique or less common amenities you offer (e.g., hot tub, dedicated workspace, EV charger) in your listing description and photos.
- Regularly check competitor amenities in East Lindsey to stay competitive.
East Lindsey Airbnb Guest Demographics & Profile Analysis (2025)
Guest Profile Summary for East Lindsey
- The typical guest profile for Airbnb in East Lindsey consists of primarily domestic travelers (96%), often arriving from nearby England, typically belonging to the Post-2000s (Gen Z/Alpha) group (50%), primarily speaking English or French.
- Domestic travelers account for 96.4% of guests.
- Key international markets include United Kingdom (96.4%) and United States (1%).
- Top languages spoken are English (80.1%) followed by French (4.4%).
- A significant demographic segment is the Post-2000s (Gen Z/Alpha) group, representing 50% of guests.
Recommendations for Hosts
- Target domestic marketing efforts towards travelers from England and Nottingham.
- Tailor amenities and listing descriptions to appeal to the dominant Post-2000s (Gen Z/Alpha) demographic (e.g., highlight fast WiFi, smart home features, local guides).
- Highlight unique local experiences or amenities relevant to the primary guest profile.
- Consider seasonal promotions aligned with peak travel times for key origin markets.
Nearby Short-Term Rental Market Comparison
How does the East Lindsey Airbnb market stack up against its neighbors? Compare key performance metrics like average monthly revenue, ADR, and occupancy rates in surrounding areas to understand the broader regional STR landscape.
| Market | Active Properties | Monthly Revenue | Daily Rate | Avg. Occupancy |
|---|---|---|---|---|
| Stamford Bridge | 11 | $4,669 | $410.14 | 38% |
| Appleby | 10 | $4,577 | $332.39 | 44% |
| Southburn | 18 | $3,837 | $225.12 | 49% |
| Lythe | 33 | $3,401 | $304.10 | 44% |
| Cliffe | 12 | $3,159 | $220.16 | 45% |
| Robin Hood's Bay | 64 | $3,125 | $252.70 | 46% |
| Goathland | 27 | $3,092 | $266.10 | 49% |
| Westerdale | 11 | $3,030 | $270.46 | 45% |
| Reighton | 22 | $3,004 | $239.35 | 48% |
| Aldbrough | 14 | $2,977 | $311.46 | 34% |