Dunster Airbnb Market Analysis 2025: Short Term Rental Data & Vacation Rental Statistics in England, United Kingdom
Is Airbnb profitable in Dunster in 2025? Explore comprehensive Airbnb analytics for Dunster, England, United Kingdom to uncover income potential. This 2025 STR market report for Dunster, based on AirROI data from April 2024 to March 2025, reveals key trends in the niche market of 24 active listings.
Whether you're considering an Airbnb investment in Dunster, optimizing your existing vacation rental, or exploring rental arbitrage opportunities, understanding the Dunster Airbnb data is crucial. Leveraging the low regulation environment is key to maximizing your short term rental income potential. Let's dive into the specifics.
Key Dunster Airbnb Performance Metrics Overview
Monthly Airbnb Revenue Variations & Income Potential in Dunster (2025)
Understanding the monthly revenue variations for Airbnb listings in Dunster is key to maximizing your short term rental income potential. Seasonality significantly impacts earnings. Our analysis, based on data from the past 12 months, shows that the peak revenue month for STRs in Dunster is typically April, while November often presents the lowest earnings, highlighting opportunities for strategic pricing adjustments during shoulder and low seasons. Explore the typical Airbnb income in Dunster across different performance tiers:
- Best-in-class properties (Top 10%) achieve $8,403+ monthly, often utilizing dynamic pricing and superior guest experiences.
- Strong performing properties (Top 25%) earn $5,091 or more, indicating effective management and desirable locations/amenities.
- Typical properties (Median) generate around $2,595 per month, representing the average market performance.
- Entry-level properties (Bottom 25%) see earnings around $1,253, often with potential for optimization.
Average Monthly Airbnb Earnings Trend in Dunster
Dunster Airbnb Occupancy Rate Trends (2025)
Maximize your bookings by understanding the Dunster STR occupancy trends. Seasonal demand shifts significantly influence how often properties are booked. Typically, Augustsees the highest demand (peak season occupancy), while April experiences the lowest (low season). Effective strategies, like adjusting minimum stays or offering promotions, can boost occupancy during slower periods. Here's how different property tiers perform in Dunster:
- Best-in-class properties (Top 10%) achieve 82%+ occupancy, indicating high desirability and potentially optimized availability.
- Strong performing properties (Top 25%) maintain 63% or higher occupancy, suggesting good market fit and guest satisfaction.
- Typical properties (Median) have an occupancy rate around 42%.
- Entry-level properties (Bottom 25%) average 21% occupancy, potentially facing higher vacancy.
Average Monthly Occupancy Rate Trend in Dunster
Average Daily Rate (ADR) Airbnb Trends in Dunster (2025)
Effective short term rental pricing strategy in Dunster involves understanding monthly ADR fluctuations. The Average Daily Rate (ADR) for Airbnb in Dunster typically peaks in August and dips lowest during November. Leveraging Airbnb dynamic pricing tools or strategies based on this seasonality can significantly boost revenue. Here's a look at the typical nightly rates achieved:
- Best-in-class properties (Top 10%) command rates of $456+ per night, often due to premium features or locations.
- Strong performing properties (Top 25%) achieve nightly rates of $294 or more.
- Typical properties (Median) charge around $174 per night.
- Entry-level properties (Bottom 25%) earn around $133 per night.
Average Daily Rate (ADR) Trend by Month in Dunster
Get Live Dunster Market Intelligence 👇

Explore Real-time Analytics
Airbnb Seasonality Analysis & Trends in Dunster (2025)
Peak Season (April, June, August)
- Revenue averages $5,014 per month
- Occupancy rates average 45.3%
- Daily rates average $309
Shoulder Season
- Revenue averages $3,472 per month
- Occupancy maintains around 45.3%
- Daily rates hold near $294
Low Season (January, February, November)
- Revenue drops to average $2,330 per month
- Occupancy decreases to average 43.2%
- Daily rates adjust to average $233
Seasonality Insights for Dunster
- The Airbnb seasonality in Dunster shows highly seasonal trends requiring careful strategy. While the sections above show seasonal averages, it's also insightful to look at the extremes:
- During the high season, the absolute peak month showcases Dunster's highest earning potential, with monthly revenues capable of climbing to $5,174, occupancy reaching a high of 60.1%, and ADRs peaking at $312.
- Conversely, the slowest single month of the year, typically falling within the low season, marks the market's lowest point. In this month, revenue might dip to $2,066, occupancy could drop to 35.7%, and ADRs may adjust down to $188.
- Understanding both the seasonal averages and these monthly peaks and troughs in revenue, occupancy, and ADR is crucial for maximizing your Airbnb profit potential in Dunster.
Seasonal Strategies for Maximizing Profit
- Peak Season: Maximize revenue through premium pricing and potentially longer minimum stays. Ensure high availability.
- Low Season: Offer competitive pricing, special promotions (e.g., extended stay discounts), and flexible cancellation policies. Target off-season travelers like remote workers or budget-conscious guests.
- Shoulder Seasons: Implement dynamic pricing that balances peak and low rates. Target weekend travelers or specific events. Offer slightly more flexible terms than peak season.
- Regularly analyze your own performance against these Dunster seasonality benchmarks and adjust your pricing and availability strategy accordingly.
Best Areas for Airbnb Investment in Dunster (2025)
Exploring the top neighborhoods for short-term rentals in Dunster? This section highlights key areas, outlining why they are attractive for hosts and guests, along with notable local attractions. Consider these locations based on your target guest profile and investment strategy.
| Neighborhood / Area | Why Host Here? (Target Guests & Appeal) | Key Attractions & Landmarks |
|---|---|---|
| Dunster Castle | An iconic historic site and medieval castle surrounded by beautiful gardens and stunning views, attracting tourists interested in history and heritage. | Dunster Castle, Dunster Dolls Museum, The Old Yarn Market, St. George's Church, Dunster Working Watermill |
| Dunster Beach | A scenic coastline area that offers beach-related activities and beautiful views, perfect for families and beach lovers. | Dunster Beach, West Somerset Railway, Dunster Sand Dunes, Stuart's Field, Dunster Beach Cafe |
| The High Street | Dunster's charming high street filled with unique shops and local eateries, ideal for tourists who want to experience local culture. | Local shops, Tea rooms, Dunster Market, The Yarn Market, Dunster Castle Gardens |
| Exmoor National Park | A national park offering stunning landscapes and outdoor activities, appealing to nature lovers and adventure seekers. | Exmoor Ponies, Lynmouth Bay, Bossington Beach, Heddon's Mouth, Dunkery Beacon |
| Tiverton | A nearby historic town with significant attractions and amenities, making it a convenient stop for visitors exploring the area. | Tiverton Castle, Grand Western Canal, Tiverton Museum, Bampton Heritage & Visitor Centre, Knightshayes Court |
| Minehead | A popular seaside resort town close to Dunster, known for its sandy beaches and family-friendly attractions. | Minehead Beach, Butlins Minehead, The West Somerset Railway, Minehead Harbour, The Exmoor Owl and Wildlife Park |
| Porlock | A picturesque village located near Dunster, offering quaint shops and beautiful coastal views, charming for day trips. | Porlock Weir, Porlock Marsh, Holnicote Estate, St. Dubricius Church, The Olde Chapel |
| Bridgwater Bay | An area known for its natural beauty and biodiversity, attracting visitors interested in wildlife and scenic walks. | Bridgwater Bay Nature Reserve, Burnham-on-Sea, The Quantock Hills, Westonzoyland Pumping Station, Sandy Glade Holiday Park |
Understanding Airbnb License Requirements & STR Laws in Dunster (2025)
While Dunster, England, United Kingdom currently shows low STR regulations, specific Airbnb license requirements might still exist or change. Always verify the latest short term rental regulations and Airbnb license requirements directly with local government authorities for Dunster to ensure full compliance before hosting.
(Source: AirROI data, 2025, finding no licensed listings among those analyzed)
Top Performing Airbnb Properties in Dunster (2025)
Benchmark your potential! Explore examples of top-performing Airbnb properties in Dunsterbased on Trailing Twelve Month (TTM) revenue. Analyze their characteristics, revenue, occupancy rate, and ADR to understand what drives success in this market.
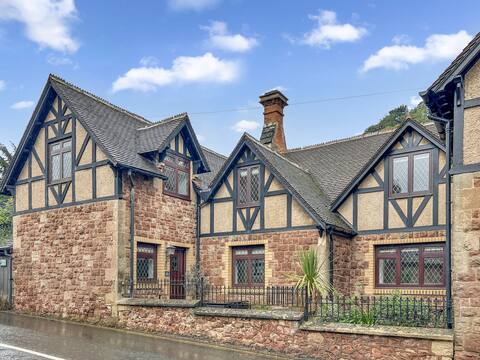
One Grooms Cottage, Dunster
Entire Place • 3 bedrooms
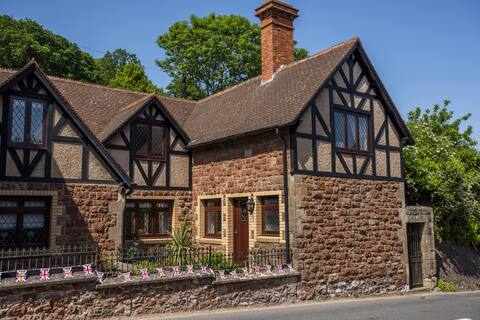
Two Grooms Cottage, Dunster
Entire Place • 3 bedrooms

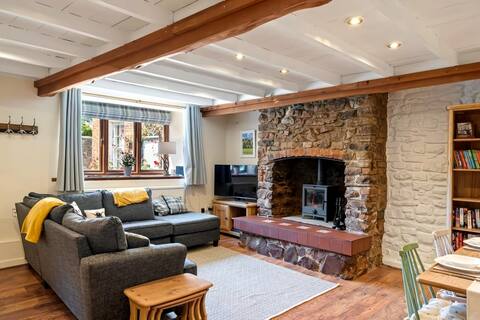
Grist Mill, Dunster
Entire Place • 4 bedrooms
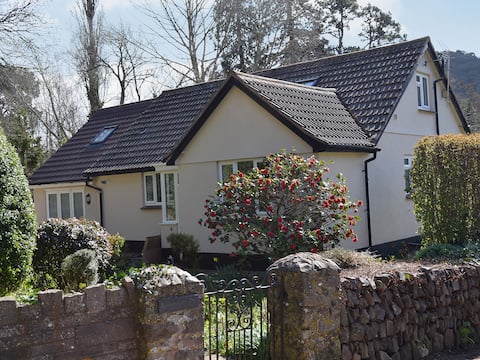
Beautiful Cottage w/ Parking, Central Dunster
Entire Place • 2 bedrooms
Mill Haven
Entire Place • 4 bedrooms
Ruffles Cottage, Dunster
Entire Place • 2 bedrooms
Note: Performance varies based on location, size, amenities, seasonality, and management quality. Data reflects the past 12 months.
Top Performing Airbnb Hosts in Dunster (2025)
Learn from the best! This table showcases top-performing Airbnb hosts in Dunster based on the number of properties managed and estimated total revenue over the past year. Analyze their scale and performance metrics.
| Host Name | Properties | Grossing Revenue | Stay Reviews | Avg Rating |
|---|---|---|---|---|
| Chris | 5 | $351,043 | 29 | 3.80/5.0 |
| William | 2 | $82,573 | 76 | 4.74/5.0 |
| Cottages | 3 | $77,438 | 15 | 1.60/5.0 |
| Clare | 1 | $37,840 | 75 | 4.96/5.0 |
| Janet | 1 | $33,670 | 237 | 4.95/5.0 |
| Linda | 1 | $27,915 | 93 | 4.96/5.0 |
| Lucy | 1 | $27,519 | 10 | 5.00/5.0 |
| Catherine | 1 | $22,970 | 258 | 4.78/5.0 |
| Helen | 1 | $22,934 | 128 | 4.75/5.0 |
| Host #3858229 | 1 | $17,830 | 6 | 5.00/5.0 |
Analyzing the strategies of top hosts, such as their property selection, pricing, and guest communication, can offer valuable lessons for optimizing your own Airbnb operations in Dunster.
Dive Deeper: Advanced Dunster STR Market Data (2025)
Ready to unlock more insights? AirROI provides access to advanced metrics and comprehensive Airbnb data for Dunster. Explore detailed analytics beyond this report to refine your investment strategy, optimize pricing, and maximize your vacation rental profits.
Explore Advanced MetricsDunster Short-Term Rental Market Composition (2025): Property & Room Types
Room Type Distribution
Property Type Distribution
Market Composition Insights for Dunster
- The Dunster Airbnb market composition is heavily skewed towards Entire Home/Apt listings, which make up 91.7% of the 24 active rentals. This indicates strong guest preference for privacy and space.
- Looking at the property type distribution in Dunster, House properties are the most common (79.2%), reflecting the local real estate landscape.
- Houses represent a significant 79.2% portion, catering likely to families or larger groups.
- Smaller segments like others (combined 4.2%) offer potential for unique stay experiences.
Dunster Airbnb Room Capacity Analysis (2025): Bedroom Distribution
Distribution of Listings by Number of Bedrooms
Room Capacity Insights for Dunster
- The dominant room capacity in Dunster is 3 bedrooms listings, making up 37.5% of the market. This suggests a strong demand for properties suitable for families or small groups.
- Together, 3 bedrooms and 1 bedroom properties represent 62.5% of the active Airbnb listings in Dunster, indicating a high concentration in these sizes.
- A significant 45.8% of listings offer 3+ bedrooms, catering to larger groups and families seeking more space in Dunster.
Dunster Vacation Rental Guest Capacity Trends (2025)
Distribution of Listings by Guest Capacity
Guest Capacity Insights for Dunster
- The most common guest capacity trend in Dunster vacation rentals is listings accommodating 6 guests (33.3%). This suggests the primary traveler segment is likely larger groups.
- Properties designed for 6 guests and 2 guests dominate the Dunster STR market, accounting for 58.3% of listings.
- 41.6% of properties accommodate 6+ guests, serving the market segment for larger families or group travel in Dunster.
- On average, properties in Dunster are equipped to host 4.4 guests.
Dunster Airbnb Booking Patterns (2025): Available vs. Booked Days
Available Days Distribution
Booked Days Distribution
Booking Pattern Insights for Dunster
- The most common availability pattern in Dunster falls within the 181-270 days range, representing 41.7% of listings. This suggests many properties have significant open periods on their calendars.
- Approximately 70.9% of listings show high availability (181+ days open annually), indicating potential for increased bookings or specific owner usage patterns.
- For booked days, the 91-180 days range is most frequent in Dunster (45.8%), reflecting common guest stay durations or potential owner blocking patterns.
- A notable 29.1% of properties secure long booking periods (181+ days booked per year), highlighting successful long-term rental strategies or significant owner usage.
Dunster Airbnb Minimum Stay Requirements Analysis
Distribution of Listings by Minimum Night Requirement
1 Night
9 listings
39.1% of total
2 Nights
2 listings
8.7% of total
3 Nights
6 listings
26.1% of total
4-6 Nights
1 listings
4.3% of total
30+ Nights
5 listings
21.7% of total
Key Insights
- The most prevalent minimum stay requirement in Dunster is 1 Night, adopted by 39.1% of listings. This highlights the market's preference for shorter, flexible bookings.
- A significant segment (21.7%) caters to monthly stays (30+ nights) in Dunster, pointing to opportunities in the extended-stay market.
Recommendations
- Align with the market by considering a 1 Night minimum stay, as 39.1% of Dunster hosts use this setting.
- Explore offering discounts for stays of 30+ nights to attract the 21.7% of the market seeking extended stays.
- Adjust minimum nights based on seasonality – potentially shorter during low season and longer during peak demand periods in Dunster.
Dunster Airbnb Cancellation Policy Trends Analysis (2025)
Super Strict 60 Days
1 listings
5.3% of total
Flexible
4 listings
21.1% of total
Moderate
3 listings
15.8% of total
Firm
11 listings
57.9% of total
Cancellation Policy Insights for Dunster
- The prevailing Airbnb cancellation policy trend in Dunster is Firm, used by 57.9% of listings.
- A majority (57.9%) of hosts in Dunster utilize Firm or Strict policies, indicating a market where hosts prioritize booking security.
Recommendations for Hosts
- Consider adopting a Firm policy to align with the 57.9% market standard in Dunster.
- Regularly review your cancellation policy against competitors and market demand shifts in Dunster.
Dunster STR Booking Lead Time Analysis (2025)
Average Booking Lead Time by Month
Booking Lead Time Insights for Dunster
- The overall average booking lead time for vacation rentals in Dunster is 51 days.
- Guests book furthest in advance for stays during May (average 104 days), likely coinciding with peak travel demand or local events.
- The shortest booking windows occur for stays in February (average 32 days), indicating more last-minute travel plans during this time.
- Seasonally, Spring (81 days avg.) sees the longest lead times, while Winter (47 days avg.) has the shortest, reflecting typical travel planning cycles.
Recommendations for Hosts
- Use the overall average lead time (51 days) as a baseline for your pricing and availability strategy in Dunster.
- For May stays, consider implementing length-of-stay discounts or slightly higher rates for bookings made less than 104 days out to capitalize on advance planning.
- Target marketing efforts for the Spring season well in advance (at least 81 days) to capture early planners.
- Monitor your own booking lead times against these Dunster averages to identify opportunities for dynamic pricing adjustments.
Popular & Essential Airbnb Amenities in Dunster (2025)
Amenity Prevalence
Amenity Insights for Dunster
- Essential amenities in Dunster that guests expect include: Heating, Bed linens. Lacking these (any) could significantly impact bookings.
- Popular amenities like TV, Wifi, Kitchen are common but not universal. Offering these can provide a competitive edge.
- Warning: Wifi is not universally provided but is considered essential globally. Ensure reliable Wifi is offered.
Recommendations for Hosts
- Ensure your listing includes all essential amenities for Dunster: Heating, Bed linens.
- Prioritize adding missing essentials: Heating, Bed linens.
- Consider adding popular differentiators like TV or Wifi to increase appeal.
- Highlight unique or less common amenities you offer (e.g., hot tub, dedicated workspace, EV charger) in your listing description and photos.
- Regularly check competitor amenities in Dunster to stay competitive.
Dunster Airbnb Guest Demographics & Profile Analysis (2025)
Guest Profile Summary for Dunster
- The typical guest profile for Airbnb in Dunster consists of primarily domestic travelers (91%), often arriving from nearby England, typically belonging to the Post-2000s (Gen Z/Alpha) group (50%), primarily speaking English or French.
- Domestic travelers account for 90.7% of guests.
- Key international markets include United Kingdom (90.7%) and Ireland (1.4%).
- Top languages spoken are English (73.2%) followed by French (11.3%).
- A significant demographic segment is the Post-2000s (Gen Z/Alpha) group, representing 50% of guests.
Recommendations for Hosts
- Target domestic marketing efforts towards travelers from England and London.
- Tailor amenities and listing descriptions to appeal to the dominant Post-2000s (Gen Z/Alpha) demographic (e.g., highlight fast WiFi, smart home features, local guides).
- Highlight unique local experiences or amenities relevant to the primary guest profile.
- Consider seasonal promotions aligned with peak travel times for key origin markets.
Nearby Short-Term Rental Market Comparison
How does the Dunster Airbnb market stack up against its neighbors? Compare key performance metrics like average monthly revenue, ADR, and occupancy rates in surrounding areas to understand the broader regional STR landscape.
| Market | Active Properties | Monthly Revenue | Daily Rate | Avg. Occupancy |
|---|---|---|---|---|
| Englishcombe | 13 | $8,558 | $573.69 | 49% |
| Chew Magna | 14 | $6,649 | $399.59 | 46% |
| Long Sutton | 17 | $5,726 | $383.88 | 46% |
| Stoke St. Michael | 10 | $5,277 | $424.04 | 42% |
| Winsham | 10 | $5,154 | $484.22 | 52% |
| Oldland Common | 13 | $5,093 | $355.47 | 43% |
| Llanrhidian | 15 | $4,842 | $386.18 | 53% |
| Crai | 20 | $4,799 | $371.85 | 46% |
| Limpley Stoke | 10 | $4,598 | $523.47 | 52% |
| Abbeycwmhir | 10 | $4,502 | $259.18 | 49% |