Dorchester Airbnb Market Analysis 2025: Short Term Rental Data & Vacation Rental Statistics in England, United Kingdom
Is Airbnb profitable in Dorchester in 2025? Explore comprehensive Airbnb analytics for Dorchester, England, United Kingdom to uncover income potential. This 2025 STR market report for Dorchester, based on AirROI data from April 2024 to March 2025, reveals key trends in the niche market of 43 active listings.
Whether you're considering an Airbnb investment in Dorchester, optimizing your existing vacation rental, or exploring rental arbitrage opportunities, understanding the Dorchester Airbnb data is crucial. Leveraging the low regulation environment is key to maximizing your short term rental income potential. Let's dive into the specifics.
Key Dorchester Airbnb Performance Metrics Overview
Monthly Airbnb Revenue Variations & Income Potential in Dorchester (2025)
Understanding the monthly revenue variations for Airbnb listings in Dorchester is key to maximizing your short term rental income potential. Seasonality significantly impacts earnings. Our analysis, based on data from the past 12 months, shows that the peak revenue month for STRs in Dorchester is typically June, while March often presents the lowest earnings, highlighting opportunities for strategic pricing adjustments during shoulder and low seasons. Explore the typical Airbnb income in Dorchester across different performance tiers:
- Best-in-class properties (Top 10%) achieve $4,307+ monthly, often utilizing dynamic pricing and superior guest experiences.
- Strong performing properties (Top 25%) earn $2,792 or more, indicating effective management and desirable locations/amenities.
- Typical properties (Median) generate around $1,766 per month, representing the average market performance.
- Entry-level properties (Bottom 25%) see earnings around $917, often with potential for optimization.
Average Monthly Airbnb Earnings Trend in Dorchester
Dorchester Airbnb Occupancy Rate Trends (2025)
Maximize your bookings by understanding the Dorchester STR occupancy trends. Seasonal demand shifts significantly influence how often properties are booked. Typically, Julysees the highest demand (peak season occupancy), while January experiences the lowest (low season). Effective strategies, like adjusting minimum stays or offering promotions, can boost occupancy during slower periods. Here's how different property tiers perform in Dorchester:
- Best-in-class properties (Top 10%) achieve 87%+ occupancy, indicating high desirability and potentially optimized availability.
- Strong performing properties (Top 25%) maintain 72% or higher occupancy, suggesting good market fit and guest satisfaction.
- Typical properties (Median) have an occupancy rate around 47%.
- Entry-level properties (Bottom 25%) average 27% occupancy, potentially facing higher vacancy.
Average Monthly Occupancy Rate Trend in Dorchester
Average Daily Rate (ADR) Airbnb Trends in Dorchester (2025)
Effective short term rental pricing strategy in Dorchester involves understanding monthly ADR fluctuations. The Average Daily Rate (ADR) for Airbnb in Dorchester typically peaks in August and dips lowest during March. Leveraging Airbnb dynamic pricing tools or strategies based on this seasonality can significantly boost revenue. Here's a look at the typical nightly rates achieved:
- Best-in-class properties (Top 10%) command rates of $264+ per night, often due to premium features or locations.
- Strong performing properties (Top 25%) achieve nightly rates of $173 or more.
- Typical properties (Median) charge around $111 per night.
- Entry-level properties (Bottom 25%) earn around $71 per night.
Average Daily Rate (ADR) Trend by Month in Dorchester
Get Live Dorchester Market Intelligence 👇

Explore Real-time Analytics
Airbnb Seasonality Analysis & Trends in Dorchester (2025)
Peak Season (June, July, May)
- Revenue averages $2,790 per month
- Occupancy rates average 54.9%
- Daily rates average $147
Shoulder Season
- Revenue averages $2,133 per month
- Occupancy maintains around 51.0%
- Daily rates hold near $146
Low Season (January, February, March)
- Revenue drops to average $1,536 per month
- Occupancy decreases to average 42.3%
- Daily rates adjust to average $138
Seasonality Insights for Dorchester
- The Airbnb seasonality in Dorchester shows highly seasonal trends requiring careful strategy. While the sections above show seasonal averages, it's also insightful to look at the extremes:
- During the high season, the absolute peak month showcases Dorchester's highest earning potential, with monthly revenues capable of climbing to $3,143, occupancy reaching a high of 63.2%, and ADRs peaking at $149.
- Conversely, the slowest single month of the year, typically falling within the low season, marks the market's lowest point. In this month, revenue might dip to $1,483, occupancy could drop to 37.2%, and ADRs may adjust down to $135.
- Understanding both the seasonal averages and these monthly peaks and troughs in revenue, occupancy, and ADR is crucial for maximizing your Airbnb profit potential in Dorchester.
Seasonal Strategies for Maximizing Profit
- Peak Season: Maximize revenue through premium pricing and potentially longer minimum stays. Ensure high availability.
- Low Season: Offer competitive pricing, special promotions (e.g., extended stay discounts), and flexible cancellation policies. Target off-season travelers like remote workers or budget-conscious guests.
- Shoulder Seasons: Implement dynamic pricing that balances peak and low rates. Target weekend travelers or specific events. Offer slightly more flexible terms than peak season.
- Regularly analyze your own performance against these Dorchester seasonality benchmarks and adjust your pricing and availability strategy accordingly.
Best Areas for Airbnb Investment in Dorchester (2025)
Exploring the top neighborhoods for short-term rentals in Dorchester? This section highlights key areas, outlining why they are attractive for hosts and guests, along with notable local attractions. Consider these locations based on your target guest profile and investment strategy.
| Neighborhood / Area | Why Host Here? (Target Guests & Appeal) | Key Attractions & Landmarks |
|---|---|---|
| Dorchester Town Centre | The heart of Dorchester is rich in history and culture, offering visitors access to local shops, restaurants, and attractions. Ideal for tourists exploring the area. | Dorset County Museum, Max Gate, Maumbury Rings, The Keep Military Museum, Dorchester Market |
| Fordington | A picturesque village close to the town centre, known for its charming streets and historic buildings. Great for a quiet stay while still being near local attractions. | Fordington's historic architecture, The Fordington Green, Nearby nature trails, Local pubs and cafes |
| Poundbury | An innovative urban extension of Dorchester designed by the Prince of Wales, featuring unique architecture and community spaces. It's attractive for those interested in modern living. | Queen Mother Square, Poundbury Gardens, Local artisan shops, Poundbury café culture |
| Hardy’s Cottage | The birthplace of Thomas Hardy, a popular literary figure. It attracts literature enthusiasts and those interested in nature and walks. | Hardy’s Cottage, Thomas Hardy’s Birthplace, Nearby walks and nature reserves, Litton Cheney |
| Dorchester West | A residential area with easy access to the train station and local amenities, ideal for business travelers or those commuting. | Dorchester West Railway Station, Nearby parks, Local dining options |
| Thomas Hardy’s Dorchester | A neighborhood closely associated with the famous author, drawing visitors who want to explore the locations mentioned in his works. | Various sites linked to Hardy's novels, Dorset County Museum, Historic architecture |
| Crossways | A village located just outside of Dorchester, known for its peaceful environment, making it ideal for guests seeking a tranquil stay. | Nature walks, Local countryside, Nearby attractions of Dorchester |
| Charminster | This suburb of Dorchester has a friendly community feel and is known for its vibrant local scene. Offers easy access to the town's amenities and attractions. | Local shops and eateries, Nearby parks, Community events |
Understanding Airbnb License Requirements & STR Laws in Dorchester (2025)
While Dorchester, England, United Kingdom currently shows low STR regulations, specific Airbnb license requirements might still exist or change. Always verify the latest short term rental regulations and Airbnb license requirements directly with local government authorities for Dorchester to ensure full compliance before hosting.
(Source: AirROI data, 2025, finding no licensed listings among those analyzed)
Top Performing Airbnb Properties in Dorchester (2025)
Benchmark your potential! Explore examples of top-performing Airbnb properties in Dorchesterbased on Trailing Twelve Month (TTM) revenue. Analyze their characteristics, revenue, occupancy rate, and ADR to understand what drives success in this market.
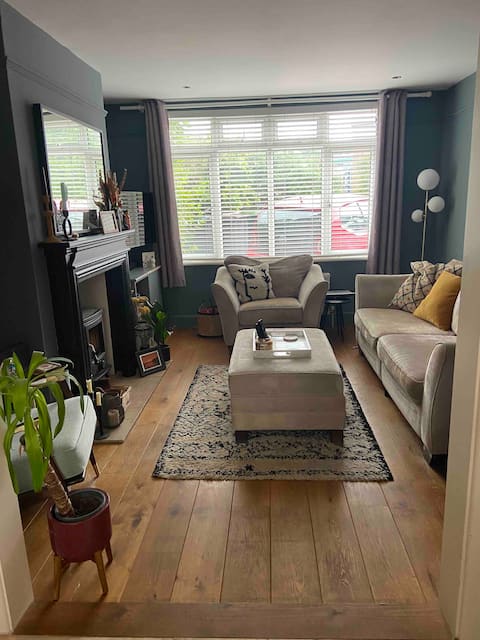
Unique & Cosy 2 Bedroom Home in Dorchester
Entire Place • 2 bedrooms
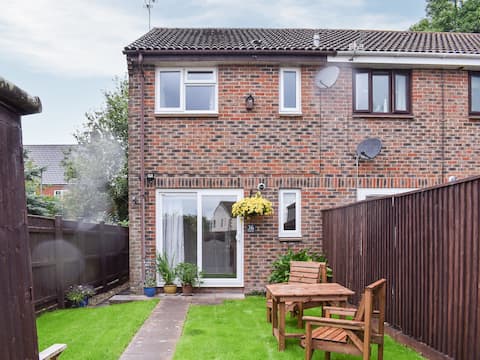
Woodlander
Entire Place • 2 bedrooms
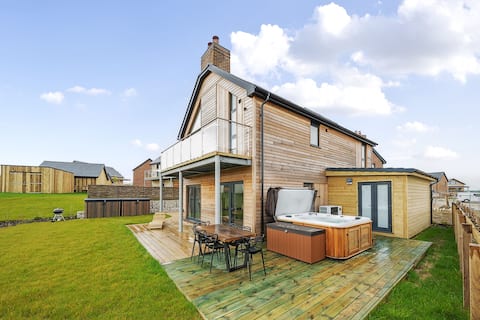
Acorn House
Entire Place • 4 bedrooms
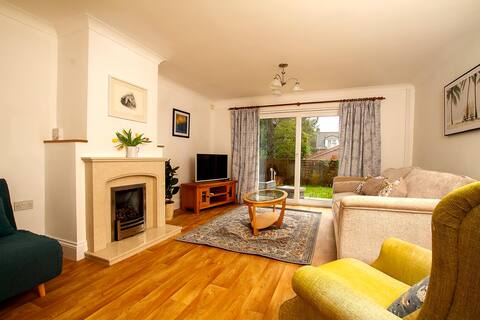
Welcome to Fox Corner
Entire Place • 1 bedroom
Large 2 bedroom town centre flat with free parking
Entire Place • 2 bedrooms

Dorchester, Dorset. Newly renovated cottage
Entire Place • 3 bedrooms
Note: Performance varies based on location, size, amenities, seasonality, and management quality. Data reflects the past 12 months.
Top Performing Airbnb Hosts in Dorchester (2025)
Learn from the best! This table showcases top-performing Airbnb hosts in Dorchester based on the number of properties managed and estimated total revenue over the past year. Analyze their scale and performance metrics.
| Host Name | Properties | Grossing Revenue | Stay Reviews | Avg Rating |
|---|---|---|---|---|
| Sally | 3 | $94,972 | 4 | 1.58/5.0 |
| Rachel | 2 | $86,440 | 177 | 4.84/5.0 |
| Claire | 2 | $63,319 | 206 | 4.96/5.0 |
| Cottages | 1 | $56,361 | 12 | 5.00/5.0 |
| Sykes Holiday Cottages | 2 | $49,951 | 5 | 2.38/5.0 |
| Santina And Steve | 1 | $40,498 | 53 | 5.00/5.0 |
| Rebecca | 1 | $39,230 | 27 | 5.00/5.0 |
| Ryan | 1 | $37,885 | 51 | 4.92/5.0 |
| Fiona | 1 | $33,361 | 29 | 5.00/5.0 |
| William | 1 | $32,027 | 73 | 4.99/5.0 |
Analyzing the strategies of top hosts, such as their property selection, pricing, and guest communication, can offer valuable lessons for optimizing your own Airbnb operations in Dorchester.
Dive Deeper: Advanced Dorchester STR Market Data (2025)
Ready to unlock more insights? AirROI provides access to advanced metrics and comprehensive Airbnb data for Dorchester. Explore detailed analytics beyond this report to refine your investment strategy, optimize pricing, and maximize your vacation rental profits.
Explore Advanced MetricsDorchester Short-Term Rental Market Composition (2025): Property & Room Types
Room Type Distribution
Property Type Distribution
Market Composition Insights for Dorchester
- The Dorchester Airbnb market composition is heavily skewed towards Entire Home/Apt listings, which make up 58.1% of the 43 active rentals. This indicates strong guest preference for privacy and space.
- However, a notable 41.9% share for Private Rooms suggests opportunities for budget-conscious travelers or hosts renting out spare rooms.
- Looking at the property type distribution in Dorchester, House properties are the most common (72.1%), reflecting the local real estate landscape.
- Houses represent a significant 72.1% portion, catering likely to families or larger groups.
- Smaller segments like hotel/boutique, others, outdoor/unique (combined 14.1%) offer potential for unique stay experiences.
Dorchester Airbnb Room Capacity Analysis (2025): Bedroom Distribution
Distribution of Listings by Number of Bedrooms
Room Capacity Insights for Dorchester
- The dominant room capacity in Dorchester is 1 bedroom listings, making up 41.9% of the market. This suggests a strong demand for properties suitable for couples or solo travelers.
- Together, 1 bedroom and 2 bedrooms properties represent 62.8% of the active Airbnb listings in Dorchester, indicating a high concentration in these sizes.
Dorchester Vacation Rental Guest Capacity Trends (2025)
Distribution of Listings by Guest Capacity
Guest Capacity Insights for Dorchester
- The most common guest capacity trend in Dorchester vacation rentals is listings accommodating 2 guests (30.2%). This suggests the primary traveler segment is likely couples or solo travelers.
- Properties designed for 2 guests and 3 guests dominate the Dorchester STR market, accounting for 44.2% of listings.
- On average, properties in Dorchester are equipped to host 2.2 guests.
Dorchester Airbnb Booking Patterns (2025): Available vs. Booked Days
Available Days Distribution
Booked Days Distribution
Booking Pattern Insights for Dorchester
- The most common availability pattern in Dorchester falls within the 271-366 days range, representing 37.2% of listings. This suggests many properties have significant open periods on their calendars.
- Approximately 62.8% of listings show high availability (181+ days open annually), indicating potential for increased bookings or specific owner usage patterns.
- For booked days, the 91-180 days range is most frequent in Dorchester (27.9%), reflecting common guest stay durations or potential owner blocking patterns.
- A notable 39.6% of properties secure long booking periods (181+ days booked per year), highlighting successful long-term rental strategies or significant owner usage.
Dorchester Airbnb Minimum Stay Requirements Analysis
Distribution of Listings by Minimum Night Requirement
1 Night
18 listings
46.2% of total
2 Nights
11 listings
28.2% of total
3 Nights
1 listings
2.6% of total
4-6 Nights
1 listings
2.6% of total
7-29 Nights
1 listings
2.6% of total
30+ Nights
7 listings
17.9% of total
Key Insights
- The most prevalent minimum stay requirement in Dorchester is 1 Night, adopted by 46.2% of listings. This highlights the market's preference for shorter, flexible bookings.
- A strong majority (74.4%) of the Dorchester Airbnb data shows acceptance of very short stays (1-2 nights), indicating a dynamic, high-turnover market.
- A significant segment (17.9%) caters to monthly stays (30+ nights) in Dorchester, pointing to opportunities in the extended-stay market.
Recommendations
- Align with the market by considering a 1 Night minimum stay, as 46.2% of Dorchester hosts use this setting.
- Explore offering discounts for stays of 30+ nights to attract the 17.9% of the market seeking extended stays.
- Adjust minimum nights based on seasonality – potentially shorter during low season and longer during peak demand periods in Dorchester.
Dorchester Airbnb Cancellation Policy Trends Analysis (2025)
Super Strict 60 Days
3 listings
9.4% of total
Flexible
9 listings
28.1% of total
Moderate
11 listings
34.4% of total
Firm
2 listings
6.3% of total
Strict
7 listings
21.9% of total
Cancellation Policy Insights for Dorchester
- The prevailing Airbnb cancellation policy trend in Dorchester is Moderate, used by 34.4% of listings.
- There's a relatively balanced mix between guest-friendly (62.5%) and stricter (28.2%) policies, offering choices for different guest needs.
Recommendations for Hosts
- Consider adopting a Moderate policy to align with the 34.4% market standard in Dorchester.
- Regularly review your cancellation policy against competitors and market demand shifts in Dorchester.
Dorchester STR Booking Lead Time Analysis (2025)
Average Booking Lead Time by Month
Booking Lead Time Insights for Dorchester
- The overall average booking lead time for vacation rentals in Dorchester is 40 days.
- Guests book furthest in advance for stays during July (average 66 days), likely coinciding with peak travel demand or local events.
- The shortest booking windows occur for stays in March (average 30 days), indicating more last-minute travel plans during this time.
- Seasonally, Summer (60 days avg.) sees the longest lead times, while Fall (43 days avg.) has the shortest, reflecting typical travel planning cycles.
Recommendations for Hosts
- Use the overall average lead time (40 days) as a baseline for your pricing and availability strategy in Dorchester.
- For July stays, consider implementing length-of-stay discounts or slightly higher rates for bookings made less than 66 days out to capitalize on advance planning.
- Target marketing efforts for the Summer season well in advance (at least 60 days) to capture early planners.
- Monitor your own booking lead times against these Dorchester averages to identify opportunities for dynamic pricing adjustments.
Popular & Essential Airbnb Amenities in Dorchester (2025)
Amenity Prevalence
Amenity Insights for Dorchester
- Essential amenities in Dorchester that guests expect include: Heating, Smoke alarm, Wifi. Lacking these (any) could significantly impact bookings.
- Popular amenities like Essentials, Hot water, Carbon monoxide alarm are common but not universal. Offering these can provide a competitive edge.
Recommendations for Hosts
- Ensure your listing includes all essential amenities for Dorchester: Heating, Smoke alarm, Wifi.
- Consider adding popular differentiators like Essentials or Hot water to increase appeal.
- Highlight unique or less common amenities you offer (e.g., hot tub, dedicated workspace, EV charger) in your listing description and photos.
- Regularly check competitor amenities in Dorchester to stay competitive.
Dorchester Airbnb Guest Demographics & Profile Analysis (2025)
Guest Profile Summary for Dorchester
- The typical guest profile for Airbnb in Dorchester consists of primarily domestic travelers (84%), often arriving from nearby England, typically belonging to the Post-2000s (Gen Z/Alpha) group (50%), primarily speaking English or French.
- Domestic travelers account for 83.8% of guests.
- Key international markets include United Kingdom (83.8%) and United States (2.7%).
- Top languages spoken are English (61.9%) followed by French (10.5%).
- A significant demographic segment is the Post-2000s (Gen Z/Alpha) group, representing 50% of guests.
Recommendations for Hosts
- Target domestic marketing efforts towards travelers from England and London.
- Tailor amenities and listing descriptions to appeal to the dominant Post-2000s (Gen Z/Alpha) demographic (e.g., highlight fast WiFi, smart home features, local guides).
- Highlight unique local experiences or amenities relevant to the primary guest profile.
- Consider seasonal promotions aligned with peak travel times for key origin markets.
Nearby Short-Term Rental Market Comparison
How does the Dorchester Airbnb market stack up against its neighbors? Compare key performance metrics like average monthly revenue, ADR, and occupancy rates in surrounding areas to understand the broader regional STR landscape.
| Market | Active Properties | Monthly Revenue | Daily Rate | Avg. Occupancy |
|---|---|---|---|---|
| Englishcombe | 13 | $8,558 | $573.69 | 49% |
| Chew Magna | 14 | $6,649 | $399.59 | 46% |
| Lambourn | 11 | $6,081 | $669.47 | 28% |
| Long Sutton | 17 | $5,726 | $383.88 | 46% |
| Stoke St. Michael | 10 | $5,277 | $424.04 | 42% |
| Winsham | 10 | $5,154 | $484.22 | 52% |
| Oldland Common | 13 | $5,093 | $355.47 | 43% |
| Crai | 20 | $4,799 | $371.85 | 46% |
| Dinton | 11 | $4,637 | $242.16 | 58% |
| Limpley Stoke | 10 | $4,598 | $523.47 | 52% |