Derbyshire Dales Airbnb Market Analysis 2025: Short Term Rental Data & Vacation Rental Statistics in England, United Kingdom
Is Airbnb profitable in Derbyshire Dales in 2025? Explore comprehensive Airbnb analytics for Derbyshire Dales, England, United Kingdom to uncover income potential. This 2025 STR market report for Derbyshire Dales, based on AirROI data from April 2024 to March 2025, reveals key trends in the bustling market of 1,466 active listings.
Whether you're considering an Airbnb investment in Derbyshire Dales, optimizing your existing vacation rental, or exploring rental arbitrage opportunities, understanding the Derbyshire Dales Airbnb data is crucial. Leveraging the low regulation environment is key to maximizing your short term rental income potential. Let's dive into the specifics.
Key Derbyshire Dales Airbnb Performance Metrics Overview
Monthly Airbnb Revenue Variations & Income Potential in Derbyshire Dales (2025)
Understanding the monthly revenue variations for Airbnb listings in Derbyshire Dales is key to maximizing your short term rental income potential. Seasonality significantly impacts earnings. Our analysis, based on data from the past 12 months, shows that the peak revenue month for STRs in Derbyshire Dales is typically August, while January often presents the lowest earnings, highlighting opportunities for strategic pricing adjustments during shoulder and low seasons. Explore the typical Airbnb income in Derbyshire Dales across different performance tiers:
- Best-in-class properties (Top 10%) achieve $6,942+ monthly, often utilizing dynamic pricing and superior guest experiences.
- Strong performing properties (Top 25%) earn $4,185 or more, indicating effective management and desirable locations/amenities.
- Typical properties (Median) generate around $2,700 per month, representing the average market performance.
- Entry-level properties (Bottom 25%) see earnings around $1,580, often with potential for optimization.
Average Monthly Airbnb Earnings Trend in Derbyshire Dales
Derbyshire Dales Airbnb Occupancy Rate Trends (2025)
Maximize your bookings by understanding the Derbyshire Dales STR occupancy trends. Seasonal demand shifts significantly influence how often properties are booked. Typically, Augustsees the highest demand (peak season occupancy), while January experiences the lowest (low season). Effective strategies, like adjusting minimum stays or offering promotions, can boost occupancy during slower periods. Here's how different property tiers perform in Derbyshire Dales:
- Best-in-class properties (Top 10%) achieve 84%+ occupancy, indicating high desirability and potentially optimized availability.
- Strong performing properties (Top 25%) maintain 70% or higher occupancy, suggesting good market fit and guest satisfaction.
- Typical properties (Median) have an occupancy rate around 50%.
- Entry-level properties (Bottom 25%) average 26% occupancy, potentially facing higher vacancy.
Average Monthly Occupancy Rate Trend in Derbyshire Dales
Average Daily Rate (ADR) Airbnb Trends in Derbyshire Dales (2025)
Effective short term rental pricing strategy in Derbyshire Dales involves understanding monthly ADR fluctuations. The Average Daily Rate (ADR) for Airbnb in Derbyshire Dales typically peaks in August and dips lowest during January. Leveraging Airbnb dynamic pricing tools or strategies based on this seasonality can significantly boost revenue. Here's a look at the typical nightly rates achieved:
- Best-in-class properties (Top 10%) command rates of $465+ per night, often due to premium features or locations.
- Strong performing properties (Top 25%) achieve nightly rates of $275 or more.
- Typical properties (Median) charge around $179 per night.
- Entry-level properties (Bottom 25%) earn around $127 per night.
Average Daily Rate (ADR) Trend by Month in Derbyshire Dales
Get Live Derbyshire Dales Market Intelligence 👇

Explore Real-time Analytics
Airbnb Seasonality Analysis & Trends in Derbyshire Dales (2025)
Peak Season (August, May, April)
- Revenue averages $4,390 per month
- Occupancy rates average 54.3%
- Daily rates average $271
Shoulder Season
- Revenue averages $3,743 per month
- Occupancy maintains around 50.6%
- Daily rates hold near $269
Low Season (January, February, March)
- Revenue drops to average $2,662 per month
- Occupancy decreases to average 38.5%
- Daily rates adjust to average $261
Seasonality Insights for Derbyshire Dales
- The Airbnb seasonality in Derbyshire Dales shows moderate seasonality with distinct peak and low periods. While the sections above show seasonal averages, it's also insightful to look at the extremes:
- During the high season, the absolute peak month showcases Derbyshire Dales's highest earning potential, with monthly revenues capable of climbing to $4,642, occupancy reaching a high of 61.2%, and ADRs peaking at $277.
- Conversely, the slowest single month of the year, typically falling within the low season, marks the market's lowest point. In this month, revenue might dip to $2,553, occupancy could drop to 34.8%, and ADRs may adjust down to $260.
- Understanding both the seasonal averages and these monthly peaks and troughs in revenue, occupancy, and ADR is crucial for maximizing your Airbnb profit potential in Derbyshire Dales.
Seasonal Strategies for Maximizing Profit
- Peak Season: Maximize revenue through premium pricing and potentially longer minimum stays. Ensure high availability.
- Low Season: Offer competitive pricing, special promotions (e.g., extended stay discounts), and flexible cancellation policies. Target off-season travelers like remote workers or budget-conscious guests.
- Shoulder Seasons: Implement dynamic pricing that balances peak and low rates. Target weekend travelers or specific events. Offer slightly more flexible terms than peak season.
- Regularly analyze your own performance against these Derbyshire Dales seasonality benchmarks and adjust your pricing and availability strategy accordingly.
Best Areas for Airbnb Investment in Derbyshire Dales (2025)
Exploring the top neighborhoods for short-term rentals in Derbyshire Dales? This section highlights key areas, outlining why they are attractive for hosts and guests, along with notable local attractions. Consider these locations based on your target guest profile and investment strategy.
| Neighborhood / Area | Why Host Here? (Target Guests & Appeal) | Key Attractions & Landmarks |
|---|---|---|
| Bakewell | Famous for its picturesque scenery and the Bakewell pudding, this charming town attracts tourists seeking a quaint English experience as well as hikers and outdoor enthusiasts. | Bakewell Pudding Shop, Derbyshire Dales National Park, Monsal Trail, Haddon Hall, Bakewell Market |
| Matlock Bath | A popular resort village known for its stunning views and historical attractions, making it a great destination for both families and couples. | Gulliver's Kingdom, Heights of Abraham, Matlock Bath Aquarium, Derwent Valley Mills, Riverside Walks |
| Ashbourne | Known as the gateway to the Peak District, Ashbourne is popular with visitors wanting to explore the national park and enjoy the quaint town atmosphere. | Ashbourne Market Place, St Oswald's Church, Tissington Trail, Peak District, Historic market town charm |
| Chatsworth | Home to the famous Chatsworth House, this area draws visitors interested in history, art, and beautiful gardens within a stunning landscape. | Chatsworth House, Chatsworth Garden, Peak District National Park, Farmyard and Adventure Playground, Gardener’s Cottage |
| Buxton | A historic spa town with stunning architecture and a vibrant arts scene, perfect for relaxation and cultural pursuits. | Buxton Opera House, Pavilion Gardens, St Ann's Well, Poole's Cavern, Buxton Museum and Art Gallery |
| Castleton | Known for its caves and dramatic landscapes, Castleton is a must-visit for outdoor enthusiasts and those interested in adventure tourism. | Peak Cavern, Hope Valley, Mam Tor, Castleton Castle, Speedwell Cavern |
| Darley Dale | A quaint village that serves as a peaceful retreat while being close to the attractions of the Peak District. | Derbyshire Stone Centre, Darley Dale Golf Club, Local walks and trails, Scenic views, Gardens |
| Crich | Home to the Crich Tramway Village and excellent walking routes, Crich offers visitors a unique slice of history and nature. | Crich Tramway Village, The National Tramway Museum, Crich Stand, Local Hiking Trails, Community Events |
Understanding Airbnb License Requirements & STR Laws in Derbyshire Dales (2025)
While Derbyshire Dales, England, United Kingdom currently shows low STR regulations, specific Airbnb license requirements might still exist or change. Always verify the latest short term rental regulations and Airbnb license requirements directly with local government authorities for Derbyshire Dales to ensure full compliance before hosting.
(Source: AirROI data, 2025, based on 0% licensed listings)
Top Performing Airbnb Properties in Derbyshire Dales (2025)
Benchmark your potential! Explore examples of top-performing Airbnb properties in Derbyshire Dalesbased on Trailing Twelve Month (TTM) revenue. Analyze their characteristics, revenue, occupancy rate, and ADR to understand what drives success in this market.
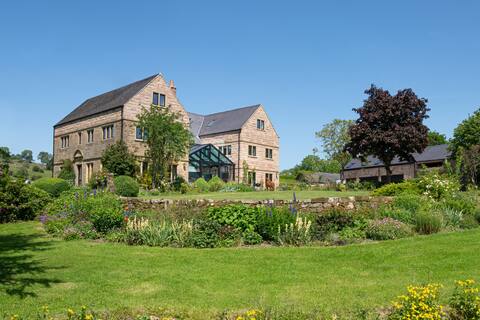
Large Country House in Derbyshire with a View
Entire Place • 10 bedrooms
Peak District Manor: Pool + Hot Tub + Fire Pit
Entire Place • 6 bedrooms
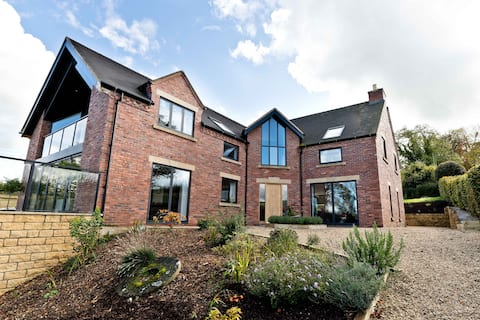
Sleeps 24 | Beautiful home near Carsington Water
Entire Place • 8 bedrooms
Big Quirky House, near 3 pubs + SPACE, sleeps 14
Entire Place • 5 bedrooms
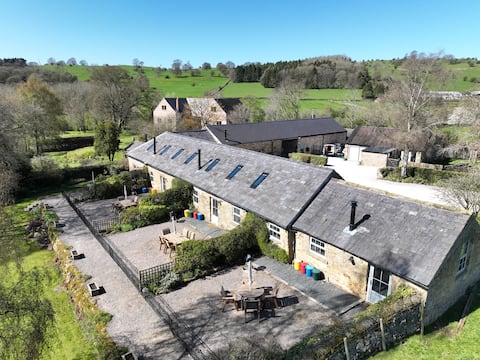
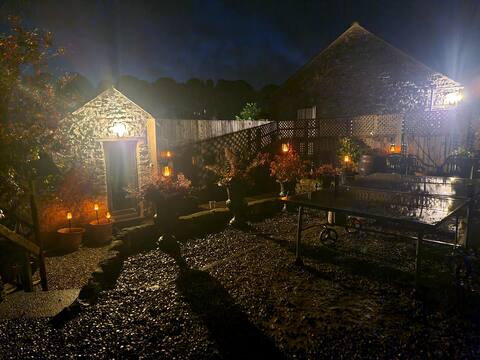
Stunning Barns for Large Groups
Entire Place • 12 bedrooms
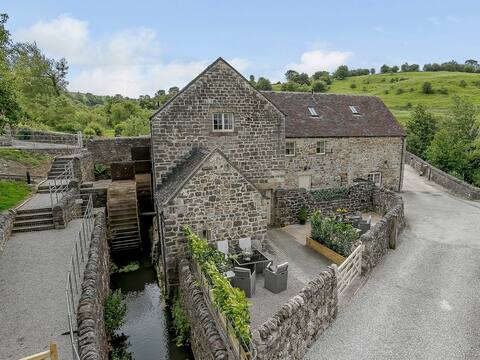
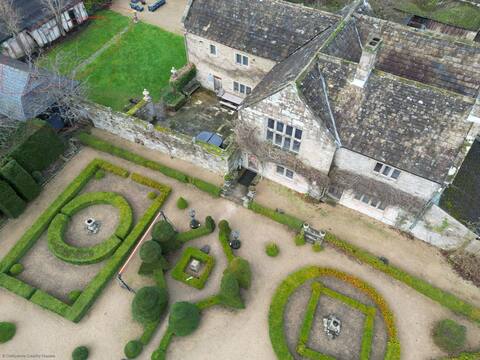
The Water Mill
Entire Place • 7 bedrooms
Note: Performance varies based on location, size, amenities, seasonality, and management quality. Data reflects the past 12 months.
Top Performing Airbnb Hosts in Derbyshire Dales (2025)
Learn from the best! This table showcases top-performing Airbnb hosts in Derbyshire Dales based on the number of properties managed and estimated total revenue over the past year. Analyze their scale and performance metrics.
| Host Name | Properties | Grossing Revenue | Stay Reviews | Avg Rating |
|---|---|---|---|---|
| Cottages | 139 | $6,891,016 | 1982 | 4.22/5.0 |
| Peak Venues | 43 | $2,539,110 | 1725 | 4.18/5.0 |
| Nicola | 14 | $1,252,305 | 1041 | 4.84/5.0 |
| Derbyshire Country Cottages | 40 | $1,173,791 | 149 | 2.15/5.0 |
| Mike | 22 | $980,444 | 1178 | 4.81/5.0 |
| Joanne | 6 | $767,229 | 146 | 4.95/5.0 |
| Staycation | 12 | $655,137 | 60 | 3.84/5.0 |
| Dale | 26 | $531,206 | 152 | 2.83/5.0 |
| James | 4 | $480,045 | 373 | 4.91/5.0 |
| Carla | 6 | $422,590 | 431 | 4.81/5.0 |
Analyzing the strategies of top hosts, such as their property selection, pricing, and guest communication, can offer valuable lessons for optimizing your own Airbnb operations in Derbyshire Dales.
Dive Deeper: Advanced Derbyshire Dales STR Market Data (2025)
Ready to unlock more insights? AirROI provides access to advanced metrics and comprehensive Airbnb data for Derbyshire Dales. Explore detailed analytics beyond this report to refine your investment strategy, optimize pricing, and maximize your vacation rental profits.
Explore Advanced MetricsDerbyshire Dales Short-Term Rental Market Composition (2025): Property & Room Types
Room Type Distribution
Property Type Distribution
Market Composition Insights for Derbyshire Dales
- The Derbyshire Dales Airbnb market composition is heavily skewed towards Entire Home/Apt listings, which make up 92% of the 1,466 active rentals. This indicates strong guest preference for privacy and space.
- Looking at the property type distribution in Derbyshire Dales, House properties are the most common (73.3%), reflecting the local real estate landscape.
- Houses represent a significant 73.3% portion, catering likely to families or larger groups.
- The presence of 5.7% Hotel/Boutique listings indicates integration with traditional hospitality.
- Smaller segments like outdoor/unique, others (combined 6.1%) offer potential for unique stay experiences.
Derbyshire Dales Airbnb Room Capacity Analysis (2025): Bedroom Distribution
Distribution of Listings by Number of Bedrooms
Room Capacity Insights for Derbyshire Dales
- The dominant room capacity in Derbyshire Dales is 2 bedrooms listings, making up 32.7% of the market. This suggests a strong demand for properties suitable for couples or solo travelers.
- Together, 2 bedrooms and 1 bedroom properties represent 62.9% of the active Airbnb listings in Derbyshire Dales, indicating a high concentration in these sizes.
- A significant 30.2% of listings offer 3+ bedrooms, catering to larger groups and families seeking more space in Derbyshire Dales.
Derbyshire Dales Vacation Rental Guest Capacity Trends (2025)
Distribution of Listings by Guest Capacity
Guest Capacity Insights for Derbyshire Dales
- The most common guest capacity trend in Derbyshire Dales vacation rentals is listings accommodating 4 guests (29.5%). This suggests the primary traveler segment is likely small families or groups.
- Properties designed for 4 guests and 2 guests dominate the Derbyshire Dales STR market, accounting for 57.0% of listings.
- 27.6% of properties accommodate 6+ guests, serving the market segment for larger families or group travel in Derbyshire Dales.
- On average, properties in Derbyshire Dales are equipped to host 4.1 guests.
Derbyshire Dales Airbnb Booking Patterns (2025): Available vs. Booked Days
Available Days Distribution
Booked Days Distribution
Booking Pattern Insights for Derbyshire Dales
- The most common availability pattern in Derbyshire Dales falls within the 91-180 days range, representing 30.7% of listings. This suggests many properties have significant open periods on their calendars.
- Approximately 57.8% of listings show high availability (181+ days open annually), indicating potential for increased bookings or specific owner usage patterns.
- For booked days, the 181-270 days range is most frequent in Derbyshire Dales (30.2%), reflecting common guest stay durations or potential owner blocking patterns.
- A notable 43.4% of properties secure long booking periods (181+ days booked per year), highlighting successful long-term rental strategies or significant owner usage.
Derbyshire Dales Airbnb Minimum Stay Requirements Analysis
Distribution of Listings by Minimum Night Requirement
1 Night
352 listings
24.9% of total
2 Nights
473 listings
33.5% of total
3 Nights
260 listings
18.4% of total
4-6 Nights
23 listings
1.6% of total
7-29 Nights
7 listings
0.5% of total
30+ Nights
296 listings
21% of total
Key Insights
- The most prevalent minimum stay requirement in Derbyshire Dales is 2 Nights, adopted by 33.5% of listings. This highlights the market's preference for shorter, flexible bookings.
- A significant segment (21%) caters to monthly stays (30+ nights) in Derbyshire Dales, pointing to opportunities in the extended-stay market.
Recommendations
- Align with the market by considering a 2 Nights minimum stay, as 33.5% of Derbyshire Dales hosts use this setting.
- If feasible, allowing 1-night stays, especially midweek or during low season, could capture last-minute bookings, as only 24.9% currently do.
- Explore offering discounts for stays of 30+ nights to attract the 21% of the market seeking extended stays.
- Adjust minimum nights based on seasonality – potentially shorter during low season and longer during peak demand periods in Derbyshire Dales.
Derbyshire Dales Airbnb Cancellation Policy Trends Analysis (2025)
Super Strict 60 Days
165 listings
12.3% of total
Refundable
3 listings
0.2% of total
Super Strict 30 Days
15 listings
1.1% of total
Non-refundable
2 listings
0.1% of total
Flexible
204 listings
15.2% of total
Moderate
315 listings
23.5% of total
Firm
274 listings
20.4% of total
Strict
363 listings
27.1% of total
Cancellation Policy Insights for Derbyshire Dales
- The prevailing Airbnb cancellation policy trend in Derbyshire Dales is Strict, used by 27.1% of listings.
- There's a relatively balanced mix between guest-friendly (38.7%) and stricter (47.5%) policies, offering choices for different guest needs.
Recommendations for Hosts
- Consider adopting a Strict policy to align with the 27.1% market standard in Derbyshire Dales.
- Regularly review your cancellation policy against competitors and market demand shifts in Derbyshire Dales.
Derbyshire Dales STR Booking Lead Time Analysis (2025)
Average Booking Lead Time by Month
Booking Lead Time Insights for Derbyshire Dales
- The overall average booking lead time for vacation rentals in Derbyshire Dales is 61 days.
- Guests book furthest in advance for stays during May (average 91 days), likely coinciding with peak travel demand or local events.
- The shortest booking windows occur for stays in February (average 45 days), indicating more last-minute travel plans during this time.
- Seasonally, Summer (82 days avg.) sees the longest lead times, while Winter (57 days avg.) has the shortest, reflecting typical travel planning cycles.
Recommendations for Hosts
- Use the overall average lead time (61 days) as a baseline for your pricing and availability strategy in Derbyshire Dales.
- For May stays, consider implementing length-of-stay discounts or slightly higher rates for bookings made less than 91 days out to capitalize on advance planning.
- Target marketing efforts for the Summer season well in advance (at least 82 days) to capture early planners.
- Monitor your own booking lead times against these Derbyshire Dales averages to identify opportunities for dynamic pricing adjustments.
Popular & Essential Airbnb Amenities in Derbyshire Dales (2025)
Amenity Prevalence
Amenity Insights for Derbyshire Dales
- Essential amenities in Derbyshire Dales that guests expect include: Smoke alarm, Heating, Wifi. Lacking these (any) could significantly impact bookings.
- Popular amenities like TV, Kitchen, Hangers are common but not universal. Offering these can provide a competitive edge.
Recommendations for Hosts
- Ensure your listing includes all essential amenities for Derbyshire Dales: Smoke alarm, Heating, Wifi.
- Prioritize adding missing essentials: Smoke alarm, Heating, Wifi.
- Consider adding popular differentiators like TV or Kitchen to increase appeal.
- Highlight unique or less common amenities you offer (e.g., hot tub, dedicated workspace, EV charger) in your listing description and photos.
- Regularly check competitor amenities in Derbyshire Dales to stay competitive.
Derbyshire Dales Airbnb Guest Demographics & Profile Analysis (2025)
Guest Profile Summary for Derbyshire Dales
- The typical guest profile for Airbnb in Derbyshire Dales consists of primarily domestic travelers (92%), often arriving from nearby England, typically belonging to the Post-2000s (Gen Z/Alpha) group (50%), primarily speaking English or French.
- Domestic travelers account for 92.2% of guests.
- Key international markets include United Kingdom (92.2%) and United States (2.4%).
- Top languages spoken are English (72.8%) followed by French (7.4%).
- A significant demographic segment is the Post-2000s (Gen Z/Alpha) group, representing 50% of guests.
Recommendations for Hosts
- Target domestic marketing efforts towards travelers from England and London.
- Tailor amenities and listing descriptions to appeal to the dominant Post-2000s (Gen Z/Alpha) demographic (e.g., highlight fast WiFi, smart home features, local guides).
- Highlight unique local experiences or amenities relevant to the primary guest profile.
- Consider seasonal promotions aligned with peak travel times for key origin markets.
Nearby Short-Term Rental Market Comparison
How does the Derbyshire Dales Airbnb market stack up against its neighbors? Compare key performance metrics like average monthly revenue, ADR, and occupancy rates in surrounding areas to understand the broader regional STR landscape.
| Market | Active Properties | Monthly Revenue | Daily Rate | Avg. Occupancy |
|---|---|---|---|---|
| Grinton | 14 | $5,456 | $365.05 | 51% |
| Cartmel Fell | 17 | $4,719 | $331.68 | 52% |
| Stamford Bridge | 11 | $4,669 | $410.14 | 38% |
| Casterton | 11 | $4,578 | $300.82 | 51% |
| Appleby | 10 | $4,577 | $332.39 | 44% |
| Cark | 11 | $4,540 | $885.21 | 31% |
| Flore | 10 | $4,534 | $347.03 | 40% |
| Craven Arms | 10 | $4,487 | $292.69 | 50% |
| Hayton | 13 | $4,333 | $239.53 | 60% |
| Watermillock | 16 | $4,281 | $274.03 | 50% |