Crossways Airbnb Market Analysis 2025: Short Term Rental Data & Vacation Rental Statistics in England, United Kingdom
Is Airbnb profitable in Crossways in 2025? Explore comprehensive Airbnb analytics for Crossways, England, United Kingdom to uncover income potential. This 2025 STR market report for Crossways, based on AirROI data from April 2024 to March 2025, reveals key trends in the niche market of 37 active listings.
Whether you're considering an Airbnb investment in Crossways, optimizing your existing vacation rental, or exploring rental arbitrage opportunities, understanding the Crossways Airbnb data is crucial. Leveraging the low regulation environment is key to maximizing your short term rental income potential. Let's dive into the specifics.
Key Crossways Airbnb Performance Metrics Overview
Monthly Airbnb Revenue Variations & Income Potential in Crossways (2025)
Understanding the monthly revenue variations for Airbnb listings in Crossways is key to maximizing your short term rental income potential. Seasonality significantly impacts earnings. Our analysis, based on data from the past 12 months, shows that the peak revenue month for STRs in Crossways is typically August, while November often presents the lowest earnings, highlighting opportunities for strategic pricing adjustments during shoulder and low seasons. Explore the typical Airbnb income in Crossways across different performance tiers:
- Best-in-class properties (Top 10%) achieve $10,242+ monthly, often utilizing dynamic pricing and superior guest experiences.
- Strong performing properties (Top 25%) earn $6,873 or more, indicating effective management and desirable locations/amenities.
- Typical properties (Median) generate around $3,851 per month, representing the average market performance.
- Entry-level properties (Bottom 25%) see earnings around $1,673, often with potential for optimization.
Average Monthly Airbnb Earnings Trend in Crossways
Crossways Airbnb Occupancy Rate Trends (2025)
Maximize your bookings by understanding the Crossways STR occupancy trends. Seasonal demand shifts significantly influence how often properties are booked. Typically, Augustsees the highest demand (peak season occupancy), while November experiences the lowest (low season). Effective strategies, like adjusting minimum stays or offering promotions, can boost occupancy during slower periods. Here's how different property tiers perform in Crossways:
- Best-in-class properties (Top 10%) achieve 65%+ occupancy, indicating high desirability and potentially optimized availability.
- Strong performing properties (Top 25%) maintain 43% or higher occupancy, suggesting good market fit and guest satisfaction.
- Typical properties (Median) have an occupancy rate around 27%.
- Entry-level properties (Bottom 25%) average 13% occupancy, potentially facing higher vacancy.
Average Monthly Occupancy Rate Trend in Crossways
Average Daily Rate (ADR) Airbnb Trends in Crossways (2025)
Effective short term rental pricing strategy in Crossways involves understanding monthly ADR fluctuations. The Average Daily Rate (ADR) for Airbnb in Crossways typically peaks in August and dips lowest during January. Leveraging Airbnb dynamic pricing tools or strategies based on this seasonality can significantly boost revenue. Here's a look at the typical nightly rates achieved:
- Best-in-class properties (Top 10%) command rates of $787+ per night, often due to premium features or locations.
- Strong performing properties (Top 25%) achieve nightly rates of $569 or more.
- Typical properties (Median) charge around $442 per night.
- Entry-level properties (Bottom 25%) earn around $325 per night.
Average Daily Rate (ADR) Trend by Month in Crossways
Get Live Crossways Market Intelligence 👇

Explore Real-time Analytics
Airbnb Seasonality Analysis & Trends in Crossways (2025)
Peak Season (August, July, May)
- Revenue averages $7,802 per month
- Occupancy rates average 47.2%
- Daily rates average $480
Shoulder Season
- Revenue averages $4,152 per month
- Occupancy maintains around 27.1%
- Daily rates hold near $446
Low Season (September, October, November)
- Revenue drops to average $2,970 per month
- Occupancy decreases to average 23.5%
- Daily rates adjust to average $437
Seasonality Insights for Crossways
- The Airbnb seasonality in Crossways shows highly seasonal trends requiring careful strategy. While the sections above show seasonal averages, it's also insightful to look at the extremes:
- During the high season, the absolute peak month showcases Crossways's highest earning potential, with monthly revenues capable of climbing to $9,466, occupancy reaching a high of 55.1%, and ADRs peaking at $531.
- Conversely, the slowest single month of the year, typically falling within the low season, marks the market's lowest point. In this month, revenue might dip to $2,319, occupancy could drop to 18.6%, and ADRs may adjust down to $416.
- Understanding both the seasonal averages and these monthly peaks and troughs in revenue, occupancy, and ADR is crucial for maximizing your Airbnb profit potential in Crossways.
Seasonal Strategies for Maximizing Profit
- Peak Season: Maximize revenue through premium pricing and potentially longer minimum stays. Ensure high availability.
- Low Season: Offer competitive pricing, special promotions (e.g., extended stay discounts), and flexible cancellation policies. Target off-season travelers like remote workers or budget-conscious guests.
- Shoulder Seasons: Implement dynamic pricing that balances peak and low rates. Target weekend travelers or specific events. Offer slightly more flexible terms than peak season.
- Regularly analyze your own performance against these Crossways seasonality benchmarks and adjust your pricing and availability strategy accordingly.
Best Areas for Airbnb Investment in Crossways (2025)
Exploring the top neighborhoods for short-term rentals in Crossways? This section highlights key areas, outlining why they are attractive for hosts and guests, along with notable local attractions. Consider these locations based on your target guest profile and investment strategy.
| Neighborhood / Area | Why Host Here? (Target Guests & Appeal) | Key Attractions & Landmarks |
|---|---|---|
| Bodmin | A picturesque town in Cornwall known for its stunning natural landscapes and proximity to the coast. Ideal for nature lovers and those seeking a peaceful retreat with a rich history. | Bodmin Moor, Bodmin Jail, Duchy of Cornwall's Bodmin, Cardinham Woods, Mount Folly, Lanhydrock House |
| Dartmoor National Park | A vast and dramatic national park with moorlands, granite tors, and scenic hiking trails. Attracts outdoor enthusiasts and those looking for an escape into nature. | Dartmoor Ponies, Haytor Rocks, Dartmoor Prison Museum, Griffin's Hill, Fingle Bridge, Dartmoor National Park |
| Plymouth | A vibrant maritime city with a rich naval history and lively waterfront. Perfect for tourists interested in history, dining, and cultural experiences. | Plymouth Hoe, National Marine Aquarium, Mayflower Steps, Royal William Yard, Mount Edgcumbe Country Park, The Box |
| Torquay | Known as the English Riviera, Torquay offers stunning beaches, a mild climate, and a vibrant tourism scene. Great for families and beach-goers. | Torquay Harbour, Kents Cavern, Babbacombe Model Village, Paignton Zoo, Cockington Country Park, Living Coasts |
| Exeter | A historic city with a vibrant cultural scene, excellent shopping, and a great location for exploring Devon. Popular among both leisure and business travelers. | Exeter Cathedral, Royal Albert Memorial Museum, Exeter Quayside, Nerdy Collectibles, Rougemont Castle, The Underground Passages |
| Cornwall Coastal Path | Offers breathtaking coastal views and a unique experience for hikers and nature lovers. It's an attractive destination for those appreciating outdoor lifestyles. | Land's End, St Ives, Porthcurno Beach, Sennen Cove, Tintagel Castle, Padstow |
| Newquay | A popular seaside resort town known for its surf culture and stunning beaches, attracting tourists seeking beach activities and nightlife. | Fistral Beach, Newquay Zoo, Blue Reef Aquarium, Lusty Glaze Beach, Crantock Beach, Trenance Gardens |
| Fowey | A charming coastal town with stunning views of the Fowey estuary, offering a quaint atmosphere and rich literary history. Ideal for those seeking a quieter getaway. | Fowey Harbour, Bodinnick Ferry, The Fowey Estuary, Fowey Museum, Readymoney Cove, The Hall Walk |
Understanding Airbnb License Requirements & STR Laws in Crossways (2025)
While Crossways, England, United Kingdom currently shows low STR regulations, specific Airbnb license requirements might still exist or change. Always verify the latest short term rental regulations and Airbnb license requirements directly with local government authorities for Crossways to ensure full compliance before hosting.
(Source: AirROI data, 2025, finding no licensed listings among those analyzed)
Top Performing Airbnb Properties in Crossways (2025)
Benchmark your potential! Explore examples of top-performing Airbnb properties in Crosswaysbased on Trailing Twelve Month (TTM) revenue. Analyze their characteristics, revenue, occupancy rate, and ADR to understand what drives success in this market.
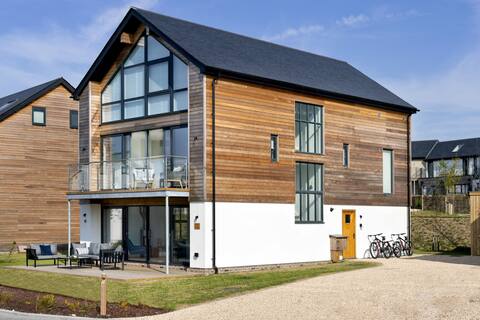
Kirrin Barn (BV26), Silverlake, Dorset
Entire Place • 5 bedrooms
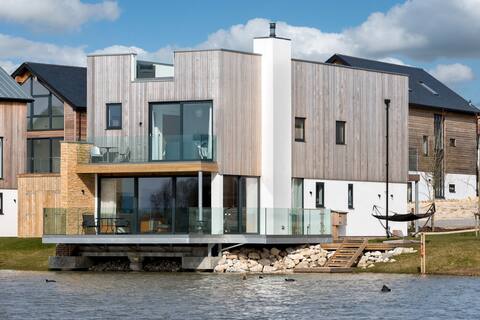
Driftwood (BV09), Silverlake, Dorset
Entire Place • 4 bedrooms
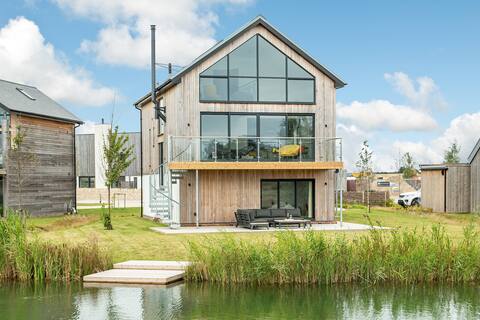
Wakeling Island 11 (WI11), Silverlake, Dorset
Entire Place • 5 bedrooms

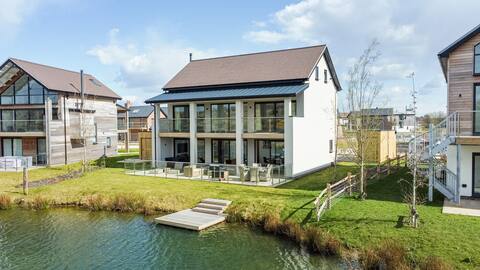
Stunning Home with Roof Terrace at Silverlake
Entire Place • 5 bedrooms

Lakeside, family friendly property (OI23)
Entire Place • 4 bedrooms
Overton Island 11 (OI11), Silverlake, Dorset
Entire Place • 5 bedrooms
Note: Performance varies based on location, size, amenities, seasonality, and management quality. Data reflects the past 12 months.
Top Performing Airbnb Hosts in Crossways (2025)
Learn from the best! This table showcases top-performing Airbnb hosts in Crossways based on the number of properties managed and estimated total revenue over the past year. Analyze their scale and performance metrics.
| Host Name | Properties | Grossing Revenue | Stay Reviews | Avg Rating |
|---|---|---|---|---|
| Harry | 24 | $1,300,436 | 155 | 4.02/5.0 |
| Host #184936338 | 2 | $98,409 | 1 | 0.00/5.0 |
| Rhian | 1 | $97,398 | 23 | 5.00/5.0 |
| Natasha | 1 | $45,979 | 81 | 4.99/5.0 |
| Alaister | 1 | $40,488 | 148 | 4.93/5.0 |
| Cottages | 1 | $36,074 | 14 | 4.79/5.0 |
| Sandra | 1 | $26,607 | 67 | 4.85/5.0 |
| Lisa | 1 | $23,031 | 18 | 5.00/5.0 |
| Host #284674085 | 1 | $18,725 | 2 | 0.00/5.0 |
| Host #126130874 | 1 | $17,070 | 10 | 4.90/5.0 |
Analyzing the strategies of top hosts, such as their property selection, pricing, and guest communication, can offer valuable lessons for optimizing your own Airbnb operations in Crossways.
Dive Deeper: Advanced Crossways STR Market Data (2025)
Ready to unlock more insights? AirROI provides access to advanced metrics and comprehensive Airbnb data for Crossways. Explore detailed analytics beyond this report to refine your investment strategy, optimize pricing, and maximize your vacation rental profits.
Explore Advanced MetricsCrossways Short-Term Rental Market Composition (2025): Property & Room Types
Room Type Distribution
Property Type Distribution
Market Composition Insights for Crossways
- The Crossways Airbnb market composition is heavily skewed towards Entire Home/Apt listings, which make up 97.3% of the 37 active rentals. This indicates strong guest preference for privacy and space.
- Looking at the property type distribution in Crossways, House properties are the most common (83.8%), reflecting the local real estate landscape.
- Houses represent a significant 83.8% portion, catering likely to families or larger groups.
- Smaller segments like hotel/boutique (combined 2.7%) offer potential for unique stay experiences.
Crossways Airbnb Room Capacity Analysis (2025): Bedroom Distribution
Distribution of Listings by Number of Bedrooms
Room Capacity Insights for Crossways
- The dominant room capacity in Crossways is 4 bedrooms listings, making up 35.1% of the market. This suggests a strong demand for properties suitable for families or small groups.
- Together, 4 bedrooms and 3 bedrooms properties represent 62.1% of the active Airbnb listings in Crossways, indicating a high concentration in these sizes.
- A significant 75.6% of listings offer 3+ bedrooms, catering to larger groups and families seeking more space in Crossways.
Crossways Vacation Rental Guest Capacity Trends (2025)
Distribution of Listings by Guest Capacity
Guest Capacity Insights for Crossways
- The most common guest capacity trend in Crossways vacation rentals is listings accommodating 8+ guests (48.6%). This suggests the primary traveler segment is likely larger groups.
- Properties designed for 8+ guests and 6 guests dominate the Crossways STR market, accounting for 72.9% of listings.
- 78.3% of properties accommodate 6+ guests, serving the market segment for larger families or group travel in Crossways.
- On average, properties in Crossways are equipped to host 6.3 guests.
Crossways Airbnb Booking Patterns (2025): Available vs. Booked Days
Available Days Distribution
Booked Days Distribution
Booking Pattern Insights for Crossways
- The most common availability pattern in Crossways falls within the 271-366 days range, representing 45.9% of listings. This suggests many properties have significant open periods on their calendars.
- Approximately 89.1% of listings show high availability (181+ days open annually), indicating potential for increased bookings or specific owner usage patterns.
- For booked days, the 91-180 days range is most frequent in Crossways (40.5%), reflecting common guest stay durations or potential owner blocking patterns.
- A notable 13.5% of properties secure long booking periods (181+ days booked per year), highlighting successful long-term rental strategies or significant owner usage.
Crossways Airbnb Minimum Stay Requirements Analysis
Distribution of Listings by Minimum Night Requirement
1 Night
5 listings
14.3% of total
2 Nights
25 listings
71.4% of total
3 Nights
1 listings
2.9% of total
4-6 Nights
1 listings
2.9% of total
30+ Nights
3 listings
8.6% of total
Key Insights
- The most prevalent minimum stay requirement in Crossways is 2 Nights, adopted by 71.4% of listings. This highlights the market's preference for shorter, flexible bookings.
- A strong majority (85.7%) of the Crossways Airbnb data shows acceptance of very short stays (1-2 nights), indicating a dynamic, high-turnover market.
Recommendations
- Align with the market by considering a 2 Nights minimum stay, as 71.4% of Crossways hosts use this setting.
- If feasible, allowing 1-night stays, especially midweek or during low season, could capture last-minute bookings, as only 14.3% currently do.
- A 2-night minimum appears standard (71.4%). Consider this for weekends or peak periods.
- Explore offering discounts for stays of 30+ nights to attract the 8.6% of the market seeking extended stays.
- Adjust minimum nights based on seasonality – potentially shorter during low season and longer during peak demand periods in Crossways.
Crossways Airbnb Cancellation Policy Trends Analysis (2025)
Super Strict 60 Days
2 listings
6.9% of total
Moderate
3 listings
10.3% of total
Firm
1 listings
3.4% of total
Strict
23 listings
79.3% of total
Cancellation Policy Insights for Crossways
- The prevailing Airbnb cancellation policy trend in Crossways is Strict, used by 79.3% of listings.
- A majority (82.7%) of hosts in Crossways utilize Firm or Strict policies, indicating a market where hosts prioritize booking security.
Recommendations for Hosts
- Consider adopting a Strict policy to align with the 79.3% market standard in Crossways.
- With 79.3% using Strict terms, this is a viable option in Crossways, particularly for high-value properties or during peak demand periods.
- Regularly review your cancellation policy against competitors and market demand shifts in Crossways.
Crossways STR Booking Lead Time Analysis (2025)
Average Booking Lead Time by Month
Booking Lead Time Insights for Crossways
- The overall average booking lead time for vacation rentals in Crossways is 85 days.
- Guests book furthest in advance for stays during May (average 156 days), likely coinciding with peak travel demand or local events.
- The shortest booking windows occur for stays in February (average 41 days), indicating more last-minute travel plans during this time.
- Seasonally, Summer (131 days avg.) sees the longest lead times, while Winter (56 days avg.) has the shortest, reflecting typical travel planning cycles.
Recommendations for Hosts
- Use the overall average lead time (85 days) as a baseline for your pricing and availability strategy in Crossways.
- For May stays, consider implementing length-of-stay discounts or slightly higher rates for bookings made less than 156 days out to capitalize on advance planning.
- Target marketing efforts for the Summer season well in advance (at least 131 days) to capture early planners.
- Monitor your own booking lead times against these Crossways averages to identify opportunities for dynamic pricing adjustments.
Popular & Essential Airbnb Amenities in Crossways (2025)
Amenity Prevalence
Amenity Insights for Crossways
- Essential amenities in Crossways that guests expect include: Heating, Smoke alarm, Bed linens. Lacking these (any) could significantly impact bookings.
- Popular amenities like Free parking on premises, Kitchen, Carbon monoxide alarm are common but not universal. Offering these can provide a competitive edge.
- Warning: Wifi is not universally provided but is considered essential globally. Ensure reliable Wifi is offered.
Recommendations for Hosts
- Ensure your listing includes all essential amenities for Crossways: Heating, Smoke alarm, Bed linens.
- Prioritize adding missing essentials: Bed linens.
- Consider adding popular differentiators like Free parking on premises or Kitchen to increase appeal.
- Highlight unique or less common amenities you offer (e.g., hot tub, dedicated workspace, EV charger) in your listing description and photos.
- Regularly check competitor amenities in Crossways to stay competitive.
Crossways Airbnb Guest Demographics & Profile Analysis (2025)
Guest Profile Summary for Crossways
- The typical guest profile for Airbnb in Crossways consists of primarily domestic travelers (95%), often arriving from nearby England, typically belonging to the Post-2000s (Gen Z/Alpha) group (50%), primarily speaking English or French.
- Domestic travelers account for 94.7% of guests.
- Key international markets include United Kingdom (94.7%) and France (0.6%).
- Top languages spoken are English (76.7%) followed by French (5%).
- A significant demographic segment is the Post-2000s (Gen Z/Alpha) group, representing 50% of guests.
Recommendations for Hosts
- Target domestic marketing efforts towards travelers from England and London.
- Tailor amenities and listing descriptions to appeal to the dominant Post-2000s (Gen Z/Alpha) demographic (e.g., highlight fast WiFi, smart home features, local guides).
- Highlight unique local experiences or amenities relevant to the primary guest profile.
- Consider seasonal promotions aligned with peak travel times for key origin markets.
Nearby Short-Term Rental Market Comparison
How does the Crossways Airbnb market stack up against its neighbors? Compare key performance metrics like average monthly revenue, ADR, and occupancy rates in surrounding areas to understand the broader regional STR landscape.
| Market | Active Properties | Monthly Revenue | Daily Rate | Avg. Occupancy |
|---|---|---|---|---|
| Englishcombe | 13 | $8,558 | $573.69 | 49% |
| Chew Magna | 14 | $6,649 | $399.59 | 46% |
| Lambourn | 11 | $6,081 | $669.47 | 28% |
| Long Sutton | 17 | $5,726 | $383.88 | 46% |
| Stoke St. Michael | 10 | $5,277 | $424.04 | 42% |
| Winsham | 10 | $5,154 | $484.22 | 52% |
| Oldland Common | 13 | $5,093 | $355.47 | 43% |
| Crai | 20 | $4,799 | $371.85 | 46% |
| Dinton | 11 | $4,637 | $242.16 | 58% |
| Limpley Stoke | 10 | $4,598 | $523.47 | 52% |