Corfe Castle Airbnb Market Analysis 2025: Short Term Rental Data & Vacation Rental Statistics in England, United Kingdom
Is Airbnb profitable in Corfe Castle in 2025? Explore comprehensive Airbnb analytics for Corfe Castle, England, United Kingdom to uncover income potential. This 2025 STR market report for Corfe Castle, based on AirROI data from April 2024 to March 2025, reveals key trends in the niche market of 76 active listings.
Whether you're considering an Airbnb investment in Corfe Castle, optimizing your existing vacation rental, or exploring rental arbitrage opportunities, understanding the Corfe Castle Airbnb data is crucial. Leveraging the low regulation environment is key to maximizing your short term rental income potential. Let's dive into the specifics.
Key Corfe Castle Airbnb Performance Metrics Overview
Monthly Airbnb Revenue Variations & Income Potential in Corfe Castle (2025)
Understanding the monthly revenue variations for Airbnb listings in Corfe Castle is key to maximizing your short term rental income potential. Seasonality significantly impacts earnings. Our analysis, based on data from the past 12 months, shows that the peak revenue month for STRs in Corfe Castle is typically August, while February often presents the lowest earnings, highlighting opportunities for strategic pricing adjustments during shoulder and low seasons. Explore the typical Airbnb income in Corfe Castle across different performance tiers:
- Best-in-class properties (Top 10%) achieve $5,960+ monthly, often utilizing dynamic pricing and superior guest experiences.
- Strong performing properties (Top 25%) earn $3,736 or more, indicating effective management and desirable locations/amenities.
- Typical properties (Median) generate around $2,396 per month, representing the average market performance.
- Entry-level properties (Bottom 25%) see earnings around $1,411, often with potential for optimization.
Average Monthly Airbnb Earnings Trend in Corfe Castle
Corfe Castle Airbnb Occupancy Rate Trends (2025)
Maximize your bookings by understanding the Corfe Castle STR occupancy trends. Seasonal demand shifts significantly influence how often properties are booked. Typically, Augustsees the highest demand (peak season occupancy), while January experiences the lowest (low season). Effective strategies, like adjusting minimum stays or offering promotions, can boost occupancy during slower periods. Here's how different property tiers perform in Corfe Castle:
- Best-in-class properties (Top 10%) achieve 75%+ occupancy, indicating high desirability and potentially optimized availability.
- Strong performing properties (Top 25%) maintain 58% or higher occupancy, suggesting good market fit and guest satisfaction.
- Typical properties (Median) have an occupancy rate around 41%.
- Entry-level properties (Bottom 25%) average 23% occupancy, potentially facing higher vacancy.
Average Monthly Occupancy Rate Trend in Corfe Castle
Average Daily Rate (ADR) Airbnb Trends in Corfe Castle (2025)
Effective short term rental pricing strategy in Corfe Castle involves understanding monthly ADR fluctuations. The Average Daily Rate (ADR) for Airbnb in Corfe Castle typically peaks in December and dips lowest during November. Leveraging Airbnb dynamic pricing tools or strategies based on this seasonality can significantly boost revenue. Here's a look at the typical nightly rates achieved:
- Best-in-class properties (Top 10%) command rates of $403+ per night, often due to premium features or locations.
- Strong performing properties (Top 25%) achieve nightly rates of $259 or more.
- Typical properties (Median) charge around $186 per night.
- Entry-level properties (Bottom 25%) earn around $133 per night.
Average Daily Rate (ADR) Trend by Month in Corfe Castle
Get Live Corfe Castle Market Intelligence 👇

Explore Real-time Analytics
Airbnb Seasonality Analysis & Trends in Corfe Castle (2025)
Peak Season (August, May, July)
- Revenue averages $4,716 per month
- Occupancy rates average 59.0%
- Daily rates average $254
Shoulder Season
- Revenue averages $3,074 per month
- Occupancy maintains around 42.2%
- Daily rates hold near $246
Low Season (January, February, March)
- Revenue drops to average $1,806 per month
- Occupancy decreases to average 25.5%
- Daily rates adjust to average $245
Seasonality Insights for Corfe Castle
- The Airbnb seasonality in Corfe Castle shows highly seasonal trends requiring careful strategy. While the sections above show seasonal averages, it's also insightful to look at the extremes:
- During the high season, the absolute peak month showcases Corfe Castle's highest earning potential, with monthly revenues capable of climbing to $5,141, occupancy reaching a high of 68.1%, and ADRs peaking at $256.
- Conversely, the slowest single month of the year, typically falling within the low season, marks the market's lowest point. In this month, revenue might dip to $1,562, occupancy could drop to 24.4%, and ADRs may adjust down to $236.
- Understanding both the seasonal averages and these monthly peaks and troughs in revenue, occupancy, and ADR is crucial for maximizing your Airbnb profit potential in Corfe Castle.
Seasonal Strategies for Maximizing Profit
- Peak Season: Maximize revenue through premium pricing and potentially longer minimum stays. Ensure high availability.
- Low Season: Offer competitive pricing, special promotions (e.g., extended stay discounts), and flexible cancellation policies. Target off-season travelers like remote workers or budget-conscious guests.
- Shoulder Seasons: Implement dynamic pricing that balances peak and low rates. Target weekend travelers or specific events. Offer slightly more flexible terms than peak season.
- Regularly analyze your own performance against these Corfe Castle seasonality benchmarks and adjust your pricing and availability strategy accordingly.
Best Areas for Airbnb Investment in Corfe Castle (2025)
Exploring the top neighborhoods for short-term rentals in Corfe Castle? This section highlights key areas, outlining why they are attractive for hosts and guests, along with notable local attractions. Consider these locations based on your target guest profile and investment strategy.
| Neighborhood / Area | Why Host Here? (Target Guests & Appeal) | Key Attractions & Landmarks |
|---|---|---|
| Corfe Castle Village | Charming village surrounding the historic ruins of Corfe Castle. Attracts tourists interested in history, stunning landscapes, and walking trails. | Corfe Castle, Purbeck Hills, Castle Viewpoint, Athelhampton House, The Greyhound Inn |
| Swanage | A picturesque coastal town with beautiful beaches and a vibrant pier. Great for families and beach lovers, making it a popular tourist destination. | Swanage Beach, Swanage Pier, Durlston Country Park, Swanage Railway, Old Harry Rocks |
| Studland Bay | Secluded beaches and natural beauty, perfect for those seeking relaxation and outdoor activities. Close to the famous Studland Nature Reserve. | Studland Beach, Studland Nature Reserve, Knoll Beach, Old Harry Rocks, Shell Bay |
| Wareham | Historic market town located near the River Frome, offering a taste of local life and access to the beautiful Purbeck countryside. | Wareham Town Museum, The River Frome, Wareham Forest, Corfe Castle, St. Mary's Church |
| Lulworth Cove | A stunning cove famous for its natural beauty and geological significance. Popular with nature lovers and those seeking outdoor adventures. | Lulworth Cove, Durdle Door, Lulworth Castle, Lulworth Cove Visitor Centre, The Fossil Forest |
| Poole Harbour | One of the largest natural harbours in the world, great for water sports and scenic cruises. Attracts both tourists and locals looking for waterfront activities. | Poole Harbour, Sandbanks Beach, Brownsea Island, Poole Quay, Old Town Poole |
| Bournemouth | Vibrant coastal town known for its beautiful beaches, nightlife, and cultural activities. Ideal for tourists looking for a mix of relaxation and entertainment. | Bournemouth Beach, Bournemouth Pier, The Bournemouth Eye, Russell-Cotes Art Gallery, Gardens and Parks |
| Dorset Countryside | The surrounding rural areas offer stunning landscapes and tranquility, attracting those interested in nature and outdoor sports such as hiking and cycling. | Purbeck Hills, The Jurassic Coast, Dorset Area of Outstanding Natural Beauty, Swanage Railway, Local walking trails |
Understanding Airbnb License Requirements & STR Laws in Corfe Castle (2025)
While Corfe Castle, England, United Kingdom currently shows low STR regulations, specific Airbnb license requirements might still exist or change. Always verify the latest short term rental regulations and Airbnb license requirements directly with local government authorities for Corfe Castle to ensure full compliance before hosting.
(Source: AirROI data, 2025, finding no licensed listings among those analyzed)
Top Performing Airbnb Properties in Corfe Castle (2025)
Benchmark your potential! Explore examples of top-performing Airbnb properties in Corfe Castlebased on Trailing Twelve Month (TTM) revenue. Analyze their characteristics, revenue, occupancy rate, and ADR to understand what drives success in this market.

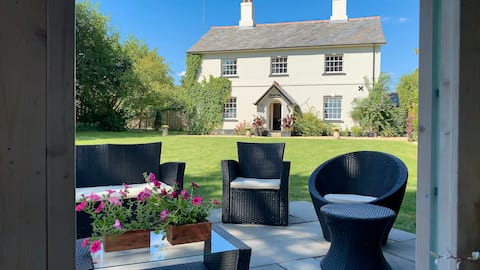
Rural Retreat Luxury Farmhouse with 3 Acre Gardens
Entire Place • 5 bedrooms
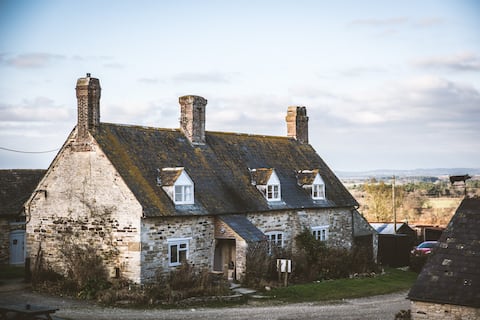
Georgian Farmhouse with private garden nr Wareham
Entire Place • 7 bedrooms
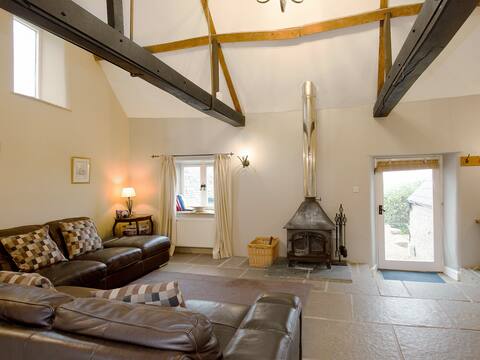
16th Century Farmhouse Bunkhouse near Corfe Castle
Entire Place • 5 bedrooms
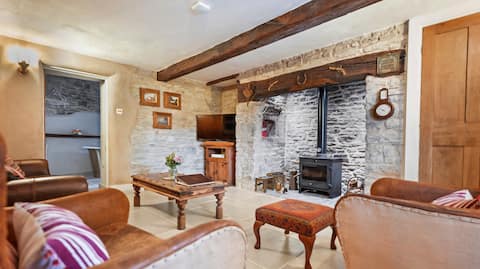
The Old Forge
Entire Place • 3 bedrooms
Enchanting Grade ll Listed Cottage.
Entire Place • 3 bedrooms
Waterfront 5 bedroom Cottage in Beautiful location
Entire Place • 5 bedrooms
Note: Performance varies based on location, size, amenities, seasonality, and management quality. Data reflects the past 12 months.
Top Performing Airbnb Hosts in Corfe Castle (2025)
Learn from the best! This table showcases top-performing Airbnb hosts in Corfe Castle based on the number of properties managed and estimated total revenue over the past year. Analyze their scale and performance metrics.
| Host Name | Properties | Grossing Revenue | Stay Reviews | Avg Rating |
|---|---|---|---|---|
| Sarah | 2 | $148,604 | 120 | 5.00/5.0 |
| Tony | 8 | $124,952 | 21 | 0.60/5.0 |
| Jo | 4 | $113,018 | 396 | 4.97/5.0 |
| Adam | 2 | $111,956 | 47 | 4.93/5.0 |
| Ben | 1 | $107,284 | 13 | 5.00/5.0 |
| Katrina | 3 | $91,614 | 126 | 4.95/5.0 |
| Blake | 5 | $82,750 | 83 | 3.84/5.0 |
| Brenscombe Outdoor | 1 | $82,208 | 49 | 4.78/5.0 |
| Tracy | 5 | $79,500 | 28 | 2.79/5.0 |
| Cottages | 1 | $73,999 | 20 | 4.65/5.0 |
Analyzing the strategies of top hosts, such as their property selection, pricing, and guest communication, can offer valuable lessons for optimizing your own Airbnb operations in Corfe Castle.
Dive Deeper: Advanced Corfe Castle STR Market Data (2025)
Ready to unlock more insights? AirROI provides access to advanced metrics and comprehensive Airbnb data for Corfe Castle. Explore detailed analytics beyond this report to refine your investment strategy, optimize pricing, and maximize your vacation rental profits.
Explore Advanced MetricsCorfe Castle Short-Term Rental Market Composition (2025): Property & Room Types
Room Type Distribution
Property Type Distribution
Market Composition Insights for Corfe Castle
- The Corfe Castle Airbnb market composition is heavily skewed towards Entire Home/Apt listings, which make up 76.3% of the 76 active rentals. This indicates strong guest preference for privacy and space.
- Looking at the property type distribution in Corfe Castle, House properties are the most common (50%), reflecting the local real estate landscape.
- Houses represent a significant 50% portion, catering likely to families or larger groups.
- The presence of 11.8% Hotel/Boutique listings indicates integration with traditional hospitality.
- Smaller segments like apartment/condo (combined 1.3%) offer potential for unique stay experiences.
Corfe Castle Airbnb Room Capacity Analysis (2025): Bedroom Distribution
Distribution of Listings by Number of Bedrooms
Room Capacity Insights for Corfe Castle
- The dominant room capacity in Corfe Castle is 1 bedroom listings, making up 43.4% of the market. This suggests a strong demand for properties suitable for couples or solo travelers.
- Together, 1 bedroom and 2 bedrooms properties represent 64.5% of the active Airbnb listings in Corfe Castle, indicating a high concentration in these sizes.
- A significant 27.6% of listings offer 3+ bedrooms, catering to larger groups and families seeking more space in Corfe Castle.
Corfe Castle Vacation Rental Guest Capacity Trends (2025)
Distribution of Listings by Guest Capacity
Guest Capacity Insights for Corfe Castle
- The most common guest capacity trend in Corfe Castle vacation rentals is listings accommodating 2 guests (34.2%). This suggests the primary traveler segment is likely couples or solo travelers.
- Properties designed for 2 guests and 4 guests dominate the Corfe Castle STR market, accounting for 52.6% of listings.
- 28.9% of properties accommodate 6+ guests, serving the market segment for larger families or group travel in Corfe Castle.
- On average, properties in Corfe Castle are equipped to host 3.9 guests.
Corfe Castle Airbnb Booking Patterns (2025): Available vs. Booked Days
Available Days Distribution
Booked Days Distribution
Booking Pattern Insights for Corfe Castle
- The most common availability pattern in Corfe Castle falls within the 271-366 days range, representing 42.1% of listings. This suggests many properties have significant open periods on their calendars.
- Approximately 78.9% of listings show high availability (181+ days open annually), indicating potential for increased bookings or specific owner usage patterns.
- For booked days, the 91-180 days range is most frequent in Corfe Castle (38.2%), reflecting common guest stay durations or potential owner blocking patterns.
- A notable 21.0% of properties secure long booking periods (181+ days booked per year), highlighting successful long-term rental strategies or significant owner usage.
Corfe Castle Airbnb Minimum Stay Requirements Analysis
Distribution of Listings by Minimum Night Requirement
1 Night
27 listings
35.5% of total
2 Nights
18 listings
23.7% of total
3 Nights
10 listings
13.2% of total
4-6 Nights
10 listings
13.2% of total
30+ Nights
11 listings
14.5% of total
Key Insights
- The most prevalent minimum stay requirement in Corfe Castle is 1 Night, adopted by 35.5% of listings. This highlights the market's preference for shorter, flexible bookings.
- A significant segment (14.5%) caters to monthly stays (30+ nights) in Corfe Castle, pointing to opportunities in the extended-stay market.
Recommendations
- Align with the market by considering a 1 Night minimum stay, as 35.5% of Corfe Castle hosts use this setting.
- Explore offering discounts for stays of 30+ nights to attract the 14.5% of the market seeking extended stays.
- Adjust minimum nights based on seasonality – potentially shorter during low season and longer during peak demand periods in Corfe Castle.
Corfe Castle Airbnb Cancellation Policy Trends Analysis (2025)
Refundable
1 listings
1.6% of total
Super Strict 60 Days
4 listings
6.6% of total
Flexible
2 listings
3.3% of total
Moderate
12 listings
19.7% of total
Firm
20 listings
32.8% of total
Strict
22 listings
36.1% of total
Cancellation Policy Insights for Corfe Castle
- The prevailing Airbnb cancellation policy trend in Corfe Castle is Strict, used by 36.1% of listings.
- A majority (68.9%) of hosts in Corfe Castle utilize Firm or Strict policies, indicating a market where hosts prioritize booking security.
Recommendations for Hosts
- Consider adopting a Strict policy to align with the 36.1% market standard in Corfe Castle.
- With 36.1% using Strict terms, this is a viable option in Corfe Castle, particularly for high-value properties or during peak demand periods.
- Regularly review your cancellation policy against competitors and market demand shifts in Corfe Castle.
Corfe Castle STR Booking Lead Time Analysis (2025)
Average Booking Lead Time by Month
Booking Lead Time Insights for Corfe Castle
- The overall average booking lead time for vacation rentals in Corfe Castle is 58 days.
- Guests book furthest in advance for stays during July (average 105 days), likely coinciding with peak travel demand or local events.
- The shortest booking windows occur for stays in March (average 33 days), indicating more last-minute travel plans during this time.
- Seasonally, Summer (98 days avg.) sees the longest lead times, while Fall (53 days avg.) has the shortest, reflecting typical travel planning cycles.
Recommendations for Hosts
- Use the overall average lead time (58 days) as a baseline for your pricing and availability strategy in Corfe Castle.
- For July stays, consider implementing length-of-stay discounts or slightly higher rates for bookings made less than 105 days out to capitalize on advance planning.
- Target marketing efforts for the Summer season well in advance (at least 98 days) to capture early planners.
- Monitor your own booking lead times against these Corfe Castle averages to identify opportunities for dynamic pricing adjustments.
Popular & Essential Airbnb Amenities in Corfe Castle (2025)
Amenity Prevalence
Amenity Insights for Corfe Castle
- Essential amenities in Corfe Castle that guests expect include: Smoke alarm. Lacking these (this) could significantly impact bookings.
- Popular amenities like Heating, Hot water, Free parking on premises are common but not universal. Offering these can provide a competitive edge.
- Warning: Wifi is not universally provided but is considered essential globally. Ensure reliable Wifi is offered.
Recommendations for Hosts
- Ensure your listing includes all essential amenities for Corfe Castle: Smoke alarm.
- Prioritize adding missing essentials: Smoke alarm.
- Consider adding popular differentiators like Heating or Hot water to increase appeal.
- Highlight unique or less common amenities you offer (e.g., hot tub, dedicated workspace, EV charger) in your listing description and photos.
- Regularly check competitor amenities in Corfe Castle to stay competitive.
Corfe Castle Airbnb Guest Demographics & Profile Analysis (2025)
Guest Profile Summary for Corfe Castle
- The typical guest profile for Airbnb in Corfe Castle consists of primarily domestic travelers (93%), often arriving from nearby England, typically belonging to the Post-2000s (Gen Z/Alpha) group (50%), primarily speaking English or French.
- Domestic travelers account for 93.2% of guests.
- Key international markets include United Kingdom (93.2%) and United States (2.2%).
- Top languages spoken are English (68.1%) followed by French (10.2%).
- A significant demographic segment is the Post-2000s (Gen Z/Alpha) group, representing 50% of guests.
Recommendations for Hosts
- Target domestic marketing efforts towards travelers from England and London.
- Tailor amenities and listing descriptions to appeal to the dominant Post-2000s (Gen Z/Alpha) demographic (e.g., highlight fast WiFi, smart home features, local guides).
- Highlight unique local experiences or amenities relevant to the primary guest profile.
- Consider seasonal promotions aligned with peak travel times for key origin markets.
Nearby Short-Term Rental Market Comparison
How does the Corfe Castle Airbnb market stack up against its neighbors? Compare key performance metrics like average monthly revenue, ADR, and occupancy rates in surrounding areas to understand the broader regional STR landscape.
| Market | Active Properties | Monthly Revenue | Daily Rate | Avg. Occupancy |
|---|---|---|---|---|
| Englishcombe | 13 | $8,558 | $573.69 | 49% |
| Chew Magna | 14 | $6,649 | $399.59 | 46% |
| Lambourn | 11 | $6,081 | $669.47 | 28% |
| Long Sutton | 17 | $5,726 | $383.88 | 46% |
| Stoke St. Michael | 10 | $5,277 | $424.04 | 42% |
| Winsham | 10 | $5,154 | $484.22 | 52% |
| Oldland Common | 13 | $5,093 | $355.47 | 43% |
| Crai | 20 | $4,799 | $371.85 | 46% |
| Dinton | 11 | $4,637 | $242.16 | 58% |
| Limpley Stoke | 10 | $4,598 | $523.47 | 52% |