Condover Airbnb Market Analysis 2025: Short Term Rental Data & Vacation Rental Statistics in England, United Kingdom
Is Airbnb profitable in Condover in 2025? Explore comprehensive Airbnb analytics for Condover, England, United Kingdom to uncover income potential. This 2025 STR market report for Condover, based on AirROI data from April 2024 to March 2025, reveals key trends in the niche market of 31 active listings.
Whether you're considering an Airbnb investment in Condover, optimizing your existing vacation rental, or exploring rental arbitrage opportunities, understanding the Condover Airbnb data is crucial. Leveraging the low regulation environment is key to maximizing your short term rental income potential. Let's dive into the specifics.
Key Condover Airbnb Performance Metrics Overview
Monthly Airbnb Revenue Variations & Income Potential in Condover (2025)
Understanding the monthly revenue variations for Airbnb listings in Condover is key to maximizing your short term rental income potential. Seasonality significantly impacts earnings. Our analysis, based on data from the past 12 months, shows that the peak revenue month for STRs in Condover is typically September, while June often presents the lowest earnings, highlighting opportunities for strategic pricing adjustments during shoulder and low seasons. Explore the typical Airbnb income in Condover across different performance tiers:
- Best-in-class properties (Top 10%) achieve $3,255+ monthly, often utilizing dynamic pricing and superior guest experiences.
- Strong performing properties (Top 25%) earn $2,716 or more, indicating effective management and desirable locations/amenities.
- Typical properties (Median) generate around $1,866 per month, representing the average market performance.
- Entry-level properties (Bottom 25%) see earnings around $1,042, often with potential for optimization.
Average Monthly Airbnb Earnings Trend in Condover
Condover Airbnb Occupancy Rate Trends (2025)
Maximize your bookings by understanding the Condover STR occupancy trends. Seasonal demand shifts significantly influence how often properties are booked. Typically, Maysees the highest demand (peak season occupancy), while January experiences the lowest (low season). Effective strategies, like adjusting minimum stays or offering promotions, can boost occupancy during slower periods. Here's how different property tiers perform in Condover:
- Best-in-class properties (Top 10%) achieve 66%+ occupancy, indicating high desirability and potentially optimized availability.
- Strong performing properties (Top 25%) maintain 40% or higher occupancy, suggesting good market fit and guest satisfaction.
- Typical properties (Median) have an occupancy rate around 27%.
- Entry-level properties (Bottom 25%) average 17% occupancy, potentially facing higher vacancy.
Average Monthly Occupancy Rate Trend in Condover
Average Daily Rate (ADR) Airbnb Trends in Condover (2025)
Effective short term rental pricing strategy in Condover involves understanding monthly ADR fluctuations. The Average Daily Rate (ADR) for Airbnb in Condover typically peaks in March and dips lowest during April. Leveraging Airbnb dynamic pricing tools or strategies based on this seasonality can significantly boost revenue. Here's a look at the typical nightly rates achieved:
- Best-in-class properties (Top 10%) command rates of $425+ per night, often due to premium features or locations.
- Strong performing properties (Top 25%) achieve nightly rates of $287 or more.
- Typical properties (Median) charge around $191 per night.
- Entry-level properties (Bottom 25%) earn around $93 per night.
Average Daily Rate (ADR) Trend by Month in Condover
Get Live Condover Market Intelligence 👇

Explore Real-time Analytics
Airbnb Seasonality Analysis & Trends in Condover (2025)
Peak Season (September, October, July)
- Revenue averages $2,823 per month
- Occupancy rates average 36.7%
- Daily rates average $234
Shoulder Season
- Revenue averages $2,441 per month
- Occupancy maintains around 32.6%
- Daily rates hold near $254
Low Season (January, March, June)
- Revenue drops to average $1,660 per month
- Occupancy decreases to average 25.6%
- Daily rates adjust to average $265
Seasonality Insights for Condover
- The Airbnb seasonality in Condover shows moderate seasonality with distinct peak and low periods. While the sections above show seasonal averages, it's also insightful to look at the extremes:
- During the high season, the absolute peak month showcases Condover's highest earning potential, with monthly revenues capable of climbing to $2,907, occupancy reaching a high of 41.5%, and ADRs peaking at $285.
- Conversely, the slowest single month of the year, typically falling within the low season, marks the market's lowest point. In this month, revenue might dip to $1,593, occupancy could drop to 20.4%, and ADRs may adjust down to $223.
- Understanding both the seasonal averages and these monthly peaks and troughs in revenue, occupancy, and ADR is crucial for maximizing your Airbnb profit potential in Condover.
Seasonal Strategies for Maximizing Profit
- Peak Season: Maximize revenue through premium pricing and potentially longer minimum stays. Ensure high availability.
- Low Season: Offer competitive pricing, special promotions (e.g., extended stay discounts), and flexible cancellation policies. Target off-season travelers like remote workers or budget-conscious guests.
- Shoulder Seasons: Implement dynamic pricing that balances peak and low rates. Target weekend travelers or specific events. Offer slightly more flexible terms than peak season.
- Regularly analyze your own performance against these Condover seasonality benchmarks and adjust your pricing and availability strategy accordingly.
Best Areas for Airbnb Investment in Condover (2025)
Exploring the top neighborhoods for short-term rentals in Condover? This section highlights key areas, outlining why they are attractive for hosts and guests, along with notable local attractions. Consider these locations based on your target guest profile and investment strategy.
| Neighborhood / Area | Why Host Here? (Target Guests & Appeal) | Key Attractions & Landmarks |
|---|---|---|
| Condover Village | A picturesque English village characterized by its charming architecture and historical significance. It's a tranquil location that attracts guests looking for a peaceful retreat close to nature. | St. Andrew's Church, Condover Hall, Local pubs and cafes, Countryside walks, Historical sites |
| Shrewsbury (nearby) | Just a short drive from Condover, Shrewsbury is a historic market town with a vibrant atmosphere, making it an ideal base for travelers interested in exploring the area. | Shrewsbury Castle, The Quarry Park, Shrewsbury Museum and Art Gallery, Darwin's House, River Severn |
| Attingham Park | A stunning estate just outside of Condover, popular for its gardens and historical significance, perfect for visitors interested in outdoor activities and heritage. | Attingham Park House, Victorian Walled Garden, Parkland walks, Wildlife watching, Picnicking areas |
| The Long Mynd (nearby) | A beautiful area of hills and heaths, ideal for hiking and exploring the great outdoors, attracting nature enthusiasts and adventure seekers. | Walking trails, Spectacular views, Wildlife, Mountain biking, Photography opportunities |
| Wem (nearby) | This quaint market town offers a taste of local life and history, with several attractions worth visiting for a more authentic experience. | Wem Town Hall, Shrewsbury and Wem Railway, Local shops and eateries, Cultural events, Historical buildings |
| Riding School (Condover) | Attracts horse riders and enthusiasts, with facilities for lessons and riding experiences, drawing visitors with an interest in equestrian activities. | Horse riding lessons, Scenic trails, Local stables, Equestrian events, Cafes nearby |
| Berrington Hall (nearby) | A National Trust property featuring beautiful gardens and intriguing architecture, making it a perfect location for history buffs and garden lovers. | Berrington Hall House, Gardens, Guided tours, Seasonal events, Countryside views |
| Church Stretton (nearby) | Known as the 'Gateway to the Long Mynd', it's a lovely market town that serves as a base for hiking and exploring the surrounding area, with a range of shops and eateries. | Historic town center, Church Stretton Railway Station, Walking routes, Local shops, Restaurants and cafes |
Understanding Airbnb License Requirements & STR Laws in Condover (2025)
While Condover, England, United Kingdom currently shows low STR regulations, specific Airbnb license requirements might still exist or change. Always verify the latest short term rental regulations and Airbnb license requirements directly with local government authorities for Condover to ensure full compliance before hosting.
(Source: AirROI data, 2025, finding no licensed listings among those analyzed)
Top Performing Airbnb Properties in Condover (2025)
Benchmark your potential! Explore examples of top-performing Airbnb properties in Condoverbased on Trailing Twelve Month (TTM) revenue. Analyze their characteristics, revenue, occupancy rate, and ADR to understand what drives success in this market.
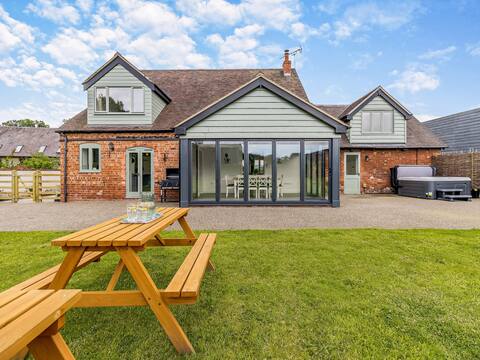
Orchard Barns
Entire Place • 5 bedrooms

Home Farm House
Entire Place • 6 bedrooms
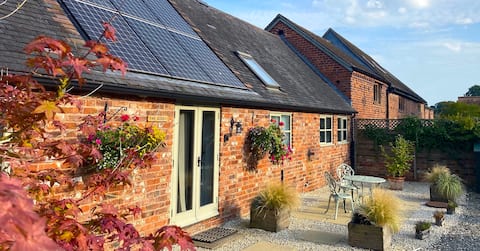
Dog friendly peaceful barn conversion for 2
Entire Place • 1 bedroom

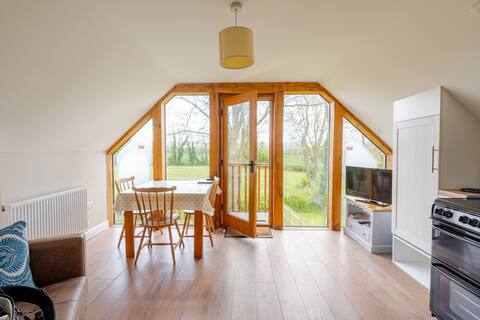
Beautiful Lake House near Shrewsbury, Shropshire
Entire Place • 1 bedroom

Scoflet Apartment - Picklescott holiday let
Entire Place • 1 bedroom
Rural retreat with beautiful views.
Entire Place • 1 bedroom
Note: Performance varies based on location, size, amenities, seasonality, and management quality. Data reflects the past 12 months.
Top Performing Airbnb Hosts in Condover (2025)
Learn from the best! This table showcases top-performing Airbnb hosts in Condover based on the number of properties managed and estimated total revenue over the past year. Analyze their scale and performance metrics.
| Host Name | Properties | Grossing Revenue | Stay Reviews | Avg Rating |
|---|---|---|---|---|
| Cottages | 3 | $202,873 | 18 | 4.96/5.0 |
| Host #230359175 | 11 | $164,752 | 0 | 0.00/5.0 |
| Julie | 1 | $31,409 | 44 | 4.95/5.0 |
| Julia Lynne | 1 | $29,324 | 413 | 4.99/5.0 |
| Emma | 4 | $27,063 | 53 | 3.71/5.0 |
| Lucinda | 1 | $25,072 | 86 | 4.79/5.0 |
| Sally | 1 | $22,738 | 258 | 4.94/5.0 |
| Rosalind | 1 | $19,366 | 57 | 4.96/5.0 |
| Helen | 2 | $17,874 | 21 | 4.91/5.0 |
| Jill And David | 1 | $11,159 | 231 | 4.98/5.0 |
Analyzing the strategies of top hosts, such as their property selection, pricing, and guest communication, can offer valuable lessons for optimizing your own Airbnb operations in Condover.
Dive Deeper: Advanced Condover STR Market Data (2025)
Ready to unlock more insights? AirROI provides access to advanced metrics and comprehensive Airbnb data for Condover. Explore detailed analytics beyond this report to refine your investment strategy, optimize pricing, and maximize your vacation rental profits.
Explore Advanced MetricsCondover Short-Term Rental Market Composition (2025): Property & Room Types
Room Type Distribution
Property Type Distribution
Market Composition Insights for Condover
- The Condover Airbnb market composition is heavily skewed towards Entire Home/Apt listings, which make up 100% of the 31 active rentals. This indicates strong guest preference for privacy and space.
- Looking at the property type distribution in Condover, House properties are the most common (77.4%), reflecting the local real estate landscape.
- Houses represent a significant 77.4% portion, catering likely to families or larger groups.
- The presence of 6.5% Hotel/Boutique listings indicates integration with traditional hospitality.
- Smaller segments like unique stays (combined 3.2%) offer potential for unique stay experiences.
Condover Airbnb Room Capacity Analysis (2025): Bedroom Distribution
Distribution of Listings by Number of Bedrooms
Room Capacity Insights for Condover
- The dominant room capacity in Condover is 1 bedroom listings, making up 48.4% of the market. This suggests a strong demand for properties suitable for couples or solo travelers.
- Together, 1 bedroom and 2 bedrooms properties represent 83.9% of the active Airbnb listings in Condover, indicating a high concentration in these sizes.
Condover Vacation Rental Guest Capacity Trends (2025)
Distribution of Listings by Guest Capacity
Guest Capacity Insights for Condover
- The most common guest capacity trend in Condover vacation rentals is listings accommodating 2 guests (41.9%). This suggests the primary traveler segment is likely couples or solo travelers.
- Properties designed for 2 guests and 4 guests dominate the Condover STR market, accounting for 80.6% of listings.
- A significant 41.9% of listings cater specifically to 1-2 guests, highlighting strong demand from couples and solo travelers in Condover.
- 16.1% of properties accommodate 6+ guests, serving the market segment for larger families or group travel in Condover.
- On average, properties in Condover are equipped to host 3.8 guests.
Condover Airbnb Booking Patterns (2025): Available vs. Booked Days
Available Days Distribution
Booked Days Distribution
Booking Pattern Insights for Condover
- The most common availability pattern in Condover falls within the 271-366 days range, representing 74.2% of listings. This suggests many properties have significant open periods on their calendars.
- Approximately 83.9% of listings show high availability (181+ days open annually), indicating potential for increased bookings or specific owner usage patterns.
- For booked days, the 31-90 days range is most frequent in Condover (51.6%), reflecting common guest stay durations or potential owner blocking patterns.
- A notable 16.1% of properties secure long booking periods (181+ days booked per year), highlighting successful long-term rental strategies or significant owner usage.
Condover Airbnb Minimum Stay Requirements Analysis
Distribution of Listings by Minimum Night Requirement
1 Night
14 listings
46.7% of total
2 Nights
10 listings
33.3% of total
3 Nights
2 listings
6.7% of total
7-29 Nights
3 listings
10% of total
30+ Nights
1 listings
3.3% of total
Key Insights
- The most prevalent minimum stay requirement in Condover is 1 Night, adopted by 46.7% of listings. This highlights the market's preference for shorter, flexible bookings.
- A strong majority (80.0%) of the Condover Airbnb data shows acceptance of very short stays (1-2 nights), indicating a dynamic, high-turnover market.
Recommendations
- Align with the market by considering a 1 Night minimum stay, as 46.7% of Condover hosts use this setting.
- Adjust minimum nights based on seasonality – potentially shorter during low season and longer during peak demand periods in Condover.
Condover Airbnb Cancellation Policy Trends Analysis (2025)
Super Strict 60 Days
6 listings
31.6% of total
Flexible
6 listings
31.6% of total
Moderate
5 listings
26.3% of total
Firm
1 listings
5.3% of total
Strict
1 listings
5.3% of total
Cancellation Policy Insights for Condover
- The prevailing Airbnb cancellation policy trend in Condover is Super Strict 60 Days, used by 31.6% of listings.
- There's a relatively balanced mix between guest-friendly (57.9%) and stricter (10.6%) policies, offering choices for different guest needs.
- Strict cancellation policies are quite rare (5.3%), potentially making listings with this policy less competitive unless justified by high demand or property type.
Recommendations for Hosts
- Consider adopting a Super Strict 60 Days policy to align with the 31.6% market standard in Condover.
- Using a Strict policy might deter some guests, as only 5.3% of listings use it. Evaluate if potential revenue protection outweighs possible lower booking rates.
- Regularly review your cancellation policy against competitors and market demand shifts in Condover.
Condover STR Booking Lead Time Analysis (2025)
Average Booking Lead Time by Month
Booking Lead Time Insights for Condover
- The overall average booking lead time for vacation rentals in Condover is 43 days.
- Guests book furthest in advance for stays during June (average 166 days), likely coinciding with peak travel demand or local events.
- The shortest booking windows occur for stays in March (average 31 days), indicating more last-minute travel plans during this time.
- Seasonally, Summer (129 days avg.) sees the longest lead times, while Winter (44 days avg.) has the shortest, reflecting typical travel planning cycles.
Recommendations for Hosts
- Use the overall average lead time (43 days) as a baseline for your pricing and availability strategy in Condover.
- For June stays, consider implementing length-of-stay discounts or slightly higher rates for bookings made less than 166 days out to capitalize on advance planning.
- Target marketing efforts for the Summer season well in advance (at least 129 days) to capture early planners.
- Monitor your own booking lead times against these Condover averages to identify opportunities for dynamic pricing adjustments.
Popular & Essential Airbnb Amenities in Condover (2025)
Amenity Prevalence
Amenity Insights for Condover
- Essential amenities in Condover that guests expect include: Heating, Smoke alarm, Wifi, Kitchen. Lacking these (any) could significantly impact bookings.
- Popular amenities like Cooking basics, TV, Hot water are common but not universal. Offering these can provide a competitive edge.
Recommendations for Hosts
- Ensure your listing includes all essential amenities for Condover: Heating, Smoke alarm, Wifi, Kitchen.
- Prioritize adding missing essentials: Wifi, Kitchen.
- Consider adding popular differentiators like Cooking basics or TV to increase appeal.
- Highlight unique or less common amenities you offer (e.g., hot tub, dedicated workspace, EV charger) in your listing description and photos.
- Regularly check competitor amenities in Condover to stay competitive.
Condover Airbnb Guest Demographics & Profile Analysis (2025)
Guest Profile Summary for Condover
- The typical guest profile for Airbnb in Condover consists of primarily domestic travelers (94%), often arriving from nearby England, typically belonging to the Post-2000s (Gen Z/Alpha) group (50%), primarily speaking English or German.
- Domestic travelers account for 93.6% of guests.
- Key international markets include United Kingdom (93.6%) and Australia (1.9%).
- Top languages spoken are English (75.8%) followed by German (8.1%).
- A significant demographic segment is the Post-2000s (Gen Z/Alpha) group, representing 50% of guests.
Recommendations for Hosts
- Target domestic marketing efforts towards travelers from England and London.
- Tailor amenities and listing descriptions to appeal to the dominant Post-2000s (Gen Z/Alpha) demographic (e.g., highlight fast WiFi, smart home features, local guides).
- Highlight unique local experiences or amenities relevant to the primary guest profile.
- Consider seasonal promotions aligned with peak travel times for key origin markets.
Nearby Short-Term Rental Market Comparison
How does the Condover Airbnb market stack up against its neighbors? Compare key performance metrics like average monthly revenue, ADR, and occupancy rates in surrounding areas to understand the broader regional STR landscape.
| Market | Active Properties | Monthly Revenue | Daily Rate | Avg. Occupancy |
|---|---|---|---|---|
| Englishcombe | 13 | $8,558 | $573.69 | 49% |
| Chew Magna | 14 | $6,649 | $399.59 | 46% |
| Lambourn | 11 | $6,081 | $669.47 | 28% |
| Long Sutton | 17 | $5,726 | $383.88 | 46% |
| Stoke St. Michael | 10 | $5,277 | $424.04 | 42% |
| Oldland Common | 13 | $5,093 | $355.47 | 43% |
| Crai | 20 | $4,799 | $371.85 | 46% |
| Dinton | 11 | $4,637 | $242.16 | 58% |
| Limpley Stoke | 10 | $4,598 | $523.47 | 52% |
| Flore | 10 | $4,534 | $347.03 | 40% |