Combe St Nicholas Airbnb Market Analysis 2025: Short Term Rental Data & Vacation Rental Statistics in England, United Kingdom
Is Airbnb profitable in Combe St Nicholas in 2025? Explore comprehensive Airbnb analytics for Combe St Nicholas, England, United Kingdom to uncover income potential. This 2025 STR market report for Combe St Nicholas, based on AirROI data from April 2024 to March 2025, reveals key trends in the niche market of 20 active listings.
Whether you're considering an Airbnb investment in Combe St Nicholas, optimizing your existing vacation rental, or exploring rental arbitrage opportunities, understanding the Combe St Nicholas Airbnb data is crucial. Leveraging the low regulation environment is key to maximizing your short term rental income potential. Let's dive into the specifics.
Key Combe St Nicholas Airbnb Performance Metrics Overview
Monthly Airbnb Revenue Variations & Income Potential in Combe St Nicholas (2025)
Understanding the monthly revenue variations for Airbnb listings in Combe St Nicholas is key to maximizing your short term rental income potential. Seasonality significantly impacts earnings. Our analysis, based on data from the past 12 months, shows that the peak revenue month for STRs in Combe St Nicholas is typically August, while January often presents the lowest earnings, highlighting opportunities for strategic pricing adjustments during shoulder and low seasons. Explore the typical Airbnb income in Combe St Nicholas across different performance tiers:
- Best-in-class properties (Top 10%) achieve $3,305+ monthly, often utilizing dynamic pricing and superior guest experiences.
- Strong performing properties (Top 25%) earn $2,519 or more, indicating effective management and desirable locations/amenities.
- Typical properties (Median) generate around $1,462 per month, representing the average market performance.
- Entry-level properties (Bottom 25%) see earnings around $756, often with potential for optimization.
Average Monthly Airbnb Earnings Trend in Combe St Nicholas
Combe St Nicholas Airbnb Occupancy Rate Trends (2025)
Maximize your bookings by understanding the Combe St Nicholas STR occupancy trends. Seasonal demand shifts significantly influence how often properties are booked. Typically, Augustsees the highest demand (peak season occupancy), while January experiences the lowest (low season). Effective strategies, like adjusting minimum stays or offering promotions, can boost occupancy during slower periods. Here's how different property tiers perform in Combe St Nicholas:
- Best-in-class properties (Top 10%) achieve 69%+ occupancy, indicating high desirability and potentially optimized availability.
- Strong performing properties (Top 25%) maintain 53% or higher occupancy, suggesting good market fit and guest satisfaction.
- Typical properties (Median) have an occupancy rate around 34%.
- Entry-level properties (Bottom 25%) average 18% occupancy, potentially facing higher vacancy.
Average Monthly Occupancy Rate Trend in Combe St Nicholas
Average Daily Rate (ADR) Airbnb Trends in Combe St Nicholas (2025)
Effective short term rental pricing strategy in Combe St Nicholas involves understanding monthly ADR fluctuations. The Average Daily Rate (ADR) for Airbnb in Combe St Nicholas typically peaks in December and dips lowest during April. Leveraging Airbnb dynamic pricing tools or strategies based on this seasonality can significantly boost revenue. Here's a look at the typical nightly rates achieved:
- Best-in-class properties (Top 10%) command rates of $295+ per night, often due to premium features or locations.
- Strong performing properties (Top 25%) achieve nightly rates of $183 or more.
- Typical properties (Median) charge around $138 per night.
- Entry-level properties (Bottom 25%) earn around $96 per night.
Average Daily Rate (ADR) Trend by Month in Combe St Nicholas
Get Live Combe St Nicholas Market Intelligence 👇

Explore Real-time Analytics
Airbnb Seasonality Analysis & Trends in Combe St Nicholas (2025)
Peak Season (August, July, October)
- Revenue averages $2,363 per month
- Occupancy rates average 50.8%
- Daily rates average $155
Shoulder Season
- Revenue averages $1,717 per month
- Occupancy maintains around 36.5%
- Daily rates hold near $165
Low Season (January, February, November)
- Revenue drops to average $1,090 per month
- Occupancy decreases to average 26.1%
- Daily rates adjust to average $177
Seasonality Insights for Combe St Nicholas
- The Airbnb seasonality in Combe St Nicholas shows highly seasonal trends requiring careful strategy. While the sections above show seasonal averages, it's also insightful to look at the extremes:
- During the high season, the absolute peak month showcases Combe St Nicholas's highest earning potential, with monthly revenues capable of climbing to $2,792, occupancy reaching a high of 64.3%, and ADRs peaking at $196.
- Conversely, the slowest single month of the year, typically falling within the low season, marks the market's lowest point. In this month, revenue might dip to $910, occupancy could drop to 17.9%, and ADRs may adjust down to $146.
- Understanding both the seasonal averages and these monthly peaks and troughs in revenue, occupancy, and ADR is crucial for maximizing your Airbnb profit potential in Combe St Nicholas.
Seasonal Strategies for Maximizing Profit
- Peak Season: Maximize revenue through premium pricing and potentially longer minimum stays. Ensure high availability.
- Low Season: Offer competitive pricing, special promotions (e.g., extended stay discounts), and flexible cancellation policies. Target off-season travelers like remote workers or budget-conscious guests.
- Shoulder Seasons: Implement dynamic pricing that balances peak and low rates. Target weekend travelers or specific events. Offer slightly more flexible terms than peak season.
- Regularly analyze your own performance against these Combe St Nicholas seasonality benchmarks and adjust your pricing and availability strategy accordingly.
Best Areas for Airbnb Investment in Combe St Nicholas (2025)
Exploring the top neighborhoods for short-term rentals in Combe St Nicholas? This section highlights key areas, outlining why they are attractive for hosts and guests, along with notable local attractions. Consider these locations based on your target guest profile and investment strategy.
| Neighborhood / Area | Why Host Here? (Target Guests & Appeal) | Key Attractions & Landmarks |
|---|---|---|
| Chard | Nearby historic market town with vibrant community and access to local amenities. Great for guests looking for a true English town experience, with options for shopping and dining. | Chard Museum, Blackdown Hills AONB, Holyrood Church, Chard Leisure Centre, Forde Abbey |
| Ilminster | Charming Somerset town known for its rich history and scenic surroundings. Ideal for visitors exploring the beautiful countryside of Somerset. | Ilminster Arts Centre, The Meeting House, Ilminster Heritage Centre, The River Isle, The Minster |
| Taunton | The county town of Somerset, offering a mix of historic sites and modern amenities. Attractive for business and leisure travelers alike, with easy transport links. | Taunton Castle, Museum of Somerset, Vivary Park, Torre Cidery, The Brewhouse Theatre |
| Watchet | Coastal town with rich maritime history and beautiful harbor views. Perfect for guests looking for seaside relaxation and local seafood cuisine. | Watchet Harbour, Lench's Trust Museum, The West Somerset Railway, Watchet Boat Museum, The Seagull |
| Bishops Lydeard | Gateway to the Quantock Hills, perfect for nature enthusiasts and walkers. Offers rural charm and access to stunning landscapes. | Quantock Hills AONB, Bishops Lydeard Mill, Somerset and Dorset Railway, St. Mary's Church, Local scenic walks |
| Dulverton | A picturesque town on the edge of Exmoor, ideal for exploring natural beauty and enjoying quiet countryside stays. | Exmoor National Park, The Tiverton Canal, Dulverton Heritage Centre, Bampton Heritage Centre, Exmoor Owl & Hawk Centre |
| Crewkerne | Traditional market town with historical significance and friendly local atmosphere. Provides a welcoming stopover for travelers. | Crewkerne Museum, The Choughs, East Lambrook Manor Gardens, South Somerset Railway, Local markets |
| Bridgwater | Historic town with a strong industrial heritage and vibrant local culture. Attractive for visitors interested in history and architecture. | Bridgwater Museum, The Blake Museum, Bridgwater Castle, St. Mary's Church, The Old Market |
Understanding Airbnb License Requirements & STR Laws in Combe St Nicholas (2025)
While Combe St Nicholas, England, United Kingdom currently shows low STR regulations, specific Airbnb license requirements might still exist or change. Always verify the latest short term rental regulations and Airbnb license requirements directly with local government authorities for Combe St Nicholas to ensure full compliance before hosting.
(Source: AirROI data, 2025, finding no licensed listings among those analyzed)
Top Performing Airbnb Properties in Combe St Nicholas (2025)
Benchmark your potential! Explore examples of top-performing Airbnb properties in Combe St Nicholasbased on Trailing Twelve Month (TTM) revenue. Analyze their characteristics, revenue, occupancy rate, and ADR to understand what drives success in this market.

Pretty chapel lovely hamlet, piano, pets welcome
Entire Place • 3 bedrooms
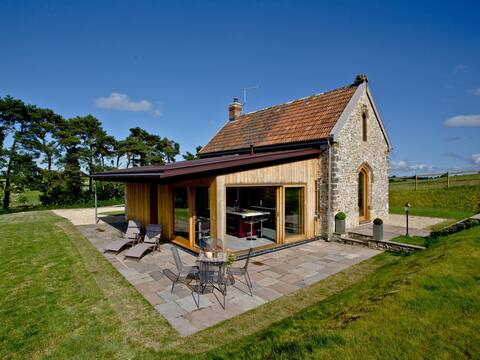
Stunning Barn Conversion-Jacuzzi & Pool
Entire Place • 2 bedrooms
Grey Heron
Entire Place • 2 bedrooms

Five Acres Lodges- Hidden Hot tub retreats
Entire Place • 1 bedroom
The Chapel - Chard (bcchap1)
Entire Place • 2 bedrooms

The Annex - Middle Payne Barn
Entire Place • N/A
Note: Performance varies based on location, size, amenities, seasonality, and management quality. Data reflects the past 12 months.
Top Performing Airbnb Hosts in Combe St Nicholas (2025)
Learn from the best! This table showcases top-performing Airbnb hosts in Combe St Nicholas based on the number of properties managed and estimated total revenue over the past year. Analyze their scale and performance metrics.
| Host Name | Properties | Grossing Revenue | Stay Reviews | Avg Rating |
|---|---|---|---|---|
| Cottages | 4 | $55,676 | 22 | 3.67/5.0 |
| Paul | 3 | $52,029 | 271 | 4.89/5.0 |
| Stephen | 1 | $32,634 | 106 | 4.75/5.0 |
| Maggie | 1 | $30,924 | 19 | 4.95/5.0 |
| Jon | 1 | $26,366 | 135 | 4.89/5.0 |
| Paula | 2 | $25,395 | 24 | 4.97/5.0 |
| Leigh | 2 | $21,517 | 126 | 5.00/5.0 |
| Mary | 1 | $19,086 | 165 | 4.99/5.0 |
| Rosie | 1 | $18,357 | 239 | 4.92/5.0 |
| Rural Retreats | 1 | $12,997 | 19 | 5.00/5.0 |
Analyzing the strategies of top hosts, such as their property selection, pricing, and guest communication, can offer valuable lessons for optimizing your own Airbnb operations in Combe St Nicholas.
Dive Deeper: Advanced Combe St Nicholas STR Market Data (2025)
Ready to unlock more insights? AirROI provides access to advanced metrics and comprehensive Airbnb data for Combe St Nicholas. Explore detailed analytics beyond this report to refine your investment strategy, optimize pricing, and maximize your vacation rental profits.
Explore Advanced MetricsCombe St Nicholas Short-Term Rental Market Composition (2025): Property & Room Types
Room Type Distribution
Property Type Distribution
Market Composition Insights for Combe St Nicholas
- The Combe St Nicholas Airbnb market composition is heavily skewed towards Entire Home/Apt listings, which make up 90% of the 20 active rentals. This indicates strong guest preference for privacy and space.
- Looking at the property type distribution in Combe St Nicholas, House properties are the most common (65%), reflecting the local real estate landscape.
- Houses represent a significant 65% portion, catering likely to families or larger groups.
Combe St Nicholas Airbnb Room Capacity Analysis (2025): Bedroom Distribution
Distribution of Listings by Number of Bedrooms
Room Capacity Insights for Combe St Nicholas
- The dominant room capacity in Combe St Nicholas is 1 bedroom listings, making up 40% of the market. This suggests a strong demand for properties suitable for couples or solo travelers.
- Together, 1 bedroom and 2 bedrooms properties represent 70.0% of the active Airbnb listings in Combe St Nicholas, indicating a high concentration in these sizes.
Combe St Nicholas Vacation Rental Guest Capacity Trends (2025)
Distribution of Listings by Guest Capacity
Guest Capacity Insights for Combe St Nicholas
- The most common guest capacity trend in Combe St Nicholas vacation rentals is listings accommodating 4 guests (40%). This suggests the primary traveler segment is likely small families or groups.
- Properties designed for 4 guests and 2 guests dominate the Combe St Nicholas STR market, accounting for 70.0% of listings.
- 25.0% of properties accommodate 6+ guests, serving the market segment for larger families or group travel in Combe St Nicholas.
- On average, properties in Combe St Nicholas are equipped to host 4.0 guests.
Combe St Nicholas Airbnb Booking Patterns (2025): Available vs. Booked Days
Available Days Distribution
Booked Days Distribution
Booking Pattern Insights for Combe St Nicholas
- The most common availability pattern in Combe St Nicholas falls within the 181-270 days range, representing 40% of listings. This suggests many properties have significant open periods on their calendars.
- Approximately 80.0% of listings show high availability (181+ days open annually), indicating potential for increased bookings or specific owner usage patterns.
- For booked days, the 91-180 days range is most frequent in Combe St Nicholas (40%), reflecting common guest stay durations or potential owner blocking patterns.
- A notable 20.0% of properties secure long booking periods (181+ days booked per year), highlighting successful long-term rental strategies or significant owner usage.
Combe St Nicholas Airbnb Minimum Stay Requirements Analysis
Distribution of Listings by Minimum Night Requirement
1 Night
5 listings
26.3% of total
2 Nights
11 listings
57.9% of total
30+ Nights
3 listings
15.8% of total
Key Insights
- The most prevalent minimum stay requirement in Combe St Nicholas is 2 Nights, adopted by 57.9% of listings. This highlights the market's preference for shorter, flexible bookings.
- A strong majority (84.2%) of the Combe St Nicholas Airbnb data shows acceptance of very short stays (1-2 nights), indicating a dynamic, high-turnover market.
- A significant segment (15.8%) caters to monthly stays (30+ nights) in Combe St Nicholas, pointing to opportunities in the extended-stay market.
Recommendations
- Align with the market by considering a 2 Nights minimum stay, as 57.9% of Combe St Nicholas hosts use this setting.
- If feasible, allowing 1-night stays, especially midweek or during low season, could capture last-minute bookings, as only 26.3% currently do.
- Explore offering discounts for stays of 30+ nights to attract the 15.8% of the market seeking extended stays.
- Adjust minimum nights based on seasonality – potentially shorter during low season and longer during peak demand periods in Combe St Nicholas.
Combe St Nicholas Airbnb Cancellation Policy Trends Analysis (2025)
Super Strict 60 Days
3 listings
16.7% of total
Flexible
3 listings
16.7% of total
Moderate
6 listings
33.3% of total
Firm
2 listings
11.1% of total
Strict
4 listings
22.2% of total
Cancellation Policy Insights for Combe St Nicholas
- The prevailing Airbnb cancellation policy trend in Combe St Nicholas is Moderate, used by 33.3% of listings.
- There's a relatively balanced mix between guest-friendly (50.0%) and stricter (33.3%) policies, offering choices for different guest needs.
Recommendations for Hosts
- Consider adopting a Moderate policy to align with the 33.3% market standard in Combe St Nicholas.
- Regularly review your cancellation policy against competitors and market demand shifts in Combe St Nicholas.
Combe St Nicholas STR Booking Lead Time Analysis (2025)
Average Booking Lead Time by Month
Booking Lead Time Insights for Combe St Nicholas
- The overall average booking lead time for vacation rentals in Combe St Nicholas is 75 days.
- Guests book furthest in advance for stays during June (average 137 days), likely coinciding with peak travel demand or local events.
- The shortest booking windows occur for stays in February (average 18 days), indicating more last-minute travel plans during this time.
- Seasonally, Summer (105 days avg.) sees the longest lead times, while Winter (54 days avg.) has the shortest, reflecting typical travel planning cycles.
Recommendations for Hosts
- Use the overall average lead time (75 days) as a baseline for your pricing and availability strategy in Combe St Nicholas.
- For June stays, consider implementing length-of-stay discounts or slightly higher rates for bookings made less than 137 days out to capitalize on advance planning.
- Target marketing efforts for the Summer season well in advance (at least 105 days) to capture early planners.
- Monitor your own booking lead times against these Combe St Nicholas averages to identify opportunities for dynamic pricing adjustments.
Popular & Essential Airbnb Amenities in Combe St Nicholas (2025)
Amenity Prevalence
Amenity Insights for Combe St Nicholas
- Essential amenities in Combe St Nicholas that guests expect include: Heating, Free parking on premises, TV. Lacking these (any) could significantly impact bookings.
- Popular amenities like Kitchen, Hangers, Smoke alarm are common but not universal. Offering these can provide a competitive edge.
- Warning: Wifi is not universally provided but is considered essential globally. Ensure reliable Wifi is offered.
Recommendations for Hosts
- Ensure your listing includes all essential amenities for Combe St Nicholas: Heating, Free parking on premises, TV.
- Prioritize adding missing essentials: TV.
- Consider adding popular differentiators like Kitchen or Hangers to increase appeal.
- Highlight unique or less common amenities you offer (e.g., hot tub, dedicated workspace, EV charger) in your listing description and photos.
- Regularly check competitor amenities in Combe St Nicholas to stay competitive.
Combe St Nicholas Airbnb Guest Demographics & Profile Analysis (2025)
Guest Profile Summary for Combe St Nicholas
- The typical guest profile for Airbnb in Combe St Nicholas consists of primarily domestic travelers (96%), often arriving from nearby England, typically belonging to the Post-2000s (Gen Z/Alpha) group (50%), primarily speaking English or Italian.
- Domestic travelers account for 96.1% of guests.
- Key international markets include United Kingdom (96.1%) and Australia (1.9%).
- Top languages spoken are English (74.5%) followed by Italian (5.5%).
- A significant demographic segment is the Post-2000s (Gen Z/Alpha) group, representing 50% of guests.
Recommendations for Hosts
- Target domestic marketing efforts towards travelers from England and London.
- Tailor amenities and listing descriptions to appeal to the dominant Post-2000s (Gen Z/Alpha) demographic (e.g., highlight fast WiFi, smart home features, local guides).
- Highlight unique local experiences or amenities relevant to the primary guest profile.
- Consider seasonal promotions aligned with peak travel times for key origin markets.
Nearby Short-Term Rental Market Comparison
How does the Combe St Nicholas Airbnb market stack up against its neighbors? Compare key performance metrics like average monthly revenue, ADR, and occupancy rates in surrounding areas to understand the broader regional STR landscape.
| Market | Active Properties | Monthly Revenue | Daily Rate | Avg. Occupancy |
|---|---|---|---|---|
| Englishcombe | 13 | $8,558 | $573.69 | 49% |
| Chew Magna | 14 | $6,649 | $399.59 | 46% |
| Lambourn | 11 | $6,081 | $669.47 | 28% |
| Long Sutton | 17 | $5,726 | $383.88 | 46% |
| Stoke St. Michael | 10 | $5,277 | $424.04 | 42% |
| Winsham | 10 | $5,154 | $484.22 | 52% |
| Oldland Common | 13 | $5,093 | $355.47 | 43% |
| Crai | 20 | $4,799 | $371.85 | 46% |
| Dinton | 11 | $4,637 | $242.16 | 58% |
| Limpley Stoke | 10 | $4,598 | $523.47 | 52% |