Colerne Airbnb Market Analysis 2025: Short Term Rental Data & Vacation Rental Statistics in England, United Kingdom
Is Airbnb profitable in Colerne in 2025? Explore comprehensive Airbnb analytics for Colerne, England, United Kingdom to uncover income potential. This 2025 STR market report for Colerne, based on AirROI data from April 2024 to March 2025, reveals key trends in the niche market of 19 active listings.
Whether you're considering an Airbnb investment in Colerne, optimizing your existing vacation rental, or exploring rental arbitrage opportunities, understanding the Colerne Airbnb data is crucial. Leveraging the low regulation environment is key to maximizing your short term rental income potential. Let's dive into the specifics.
Key Colerne Airbnb Performance Metrics Overview
Monthly Airbnb Revenue Variations & Income Potential in Colerne (2025)
Understanding the monthly revenue variations for Airbnb listings in Colerne is key to maximizing your short term rental income potential. Seasonality significantly impacts earnings. Our analysis, based on data from the past 12 months, shows that the peak revenue month for STRs in Colerne is typically August, while March often presents the lowest earnings, highlighting opportunities for strategic pricing adjustments during shoulder and low seasons. Explore the typical Airbnb income in Colerne across different performance tiers:
- Best-in-class properties (Top 10%) achieve $7,673+ monthly, often utilizing dynamic pricing and superior guest experiences.
- Strong performing properties (Top 25%) earn $4,739 or more, indicating effective management and desirable locations/amenities.
- Typical properties (Median) generate around $2,985 per month, representing the average market performance.
- Entry-level properties (Bottom 25%) see earnings around $2,155, often with potential for optimization.
Average Monthly Airbnb Earnings Trend in Colerne
Colerne Airbnb Occupancy Rate Trends (2025)
Maximize your bookings by understanding the Colerne STR occupancy trends. Seasonal demand shifts significantly influence how often properties are booked. Typically, Augustsees the highest demand (peak season occupancy), while March experiences the lowest (low season). Effective strategies, like adjusting minimum stays or offering promotions, can boost occupancy during slower periods. Here's how different property tiers perform in Colerne:
- Best-in-class properties (Top 10%) achieve 84%+ occupancy, indicating high desirability and potentially optimized availability.
- Strong performing properties (Top 25%) maintain 71% or higher occupancy, suggesting good market fit and guest satisfaction.
- Typical properties (Median) have an occupancy rate around 51%.
- Entry-level properties (Bottom 25%) average 30% occupancy, potentially facing higher vacancy.
Average Monthly Occupancy Rate Trend in Colerne
Average Daily Rate (ADR) Airbnb Trends in Colerne (2025)
Effective short term rental pricing strategy in Colerne involves understanding monthly ADR fluctuations. The Average Daily Rate (ADR) for Airbnb in Colerne typically peaks in December and dips lowest during April. Leveraging Airbnb dynamic pricing tools or strategies based on this seasonality can significantly boost revenue. Here's a look at the typical nightly rates achieved:
- Best-in-class properties (Top 10%) command rates of $542+ per night, often due to premium features or locations.
- Strong performing properties (Top 25%) achieve nightly rates of $366 or more.
- Typical properties (Median) charge around $198 per night.
- Entry-level properties (Bottom 25%) earn around $149 per night.
Average Daily Rate (ADR) Trend by Month in Colerne
Get Live Colerne Market Intelligence 👇

Explore Real-time Analytics
Airbnb Seasonality Analysis & Trends in Colerne (2025)
Peak Season (August, July, June)
- Revenue averages $5,124 per month
- Occupancy rates average 59.7%
- Daily rates average $259
Shoulder Season
- Revenue averages $3,959 per month
- Occupancy maintains around 53.0%
- Daily rates hold near $262
Low Season (February, March, November)
- Revenue drops to average $2,672 per month
- Occupancy decreases to average 40.2%
- Daily rates adjust to average $267
Seasonality Insights for Colerne
- The Airbnb seasonality in Colerne shows highly seasonal trends requiring careful strategy. While the sections above show seasonal averages, it's also insightful to look at the extremes:
- During the high season, the absolute peak month showcases Colerne's highest earning potential, with monthly revenues capable of climbing to $5,374, occupancy reaching a high of 69.5%, and ADRs peaking at $284.
- Conversely, the slowest single month of the year, typically falling within the low season, marks the market's lowest point. In this month, revenue might dip to $2,159, occupancy could drop to 31.3%, and ADRs may adjust down to $254.
- Understanding both the seasonal averages and these monthly peaks and troughs in revenue, occupancy, and ADR is crucial for maximizing your Airbnb profit potential in Colerne.
Seasonal Strategies for Maximizing Profit
- Peak Season: Maximize revenue through premium pricing and potentially longer minimum stays. Ensure high availability.
- Low Season: Offer competitive pricing, special promotions (e.g., extended stay discounts), and flexible cancellation policies. Target off-season travelers like remote workers or budget-conscious guests.
- Shoulder Seasons: Implement dynamic pricing that balances peak and low rates. Target weekend travelers or specific events. Offer slightly more flexible terms than peak season.
- Regularly analyze your own performance against these Colerne seasonality benchmarks and adjust your pricing and availability strategy accordingly.
Best Areas for Airbnb Investment in Colerne (2025)
Exploring the top neighborhoods for short-term rentals in Colerne? This section highlights key areas, outlining why they are attractive for hosts and guests, along with notable local attractions. Consider these locations based on your target guest profile and investment strategy.
| Neighborhood / Area | Why Host Here? (Target Guests & Appeal) | Key Attractions & Landmarks |
|---|---|---|
| Colerne Village | Charming English village with historical architecture and a quintessential countryside experience. Attracts visitors looking for a peaceful retreat near Bath. | Colerne Windmill, St. John the Baptist Church, Corsham Court, Lacock Abbey, National Trust Land |
| Bath | Historic city famous for its Roman baths and Georgian architecture. A major tourist destination with a vibrant cultural scene, ideal for short-term rentals. | The Roman Baths, Bath Abbey, Royal Crescent, Jane Austen Centre, Thermae Bath Spa |
| Chippenham | Market town offering a range of amenities with good transport links. Popular for visitors exploring the Cotswolds and surrounding countryside. | Chippenham Museum, Lacock Village, Bowood House and Gardens, John Coles Park, River Avon |
| Corsham | Picturesque town known for its historic buildings and proximity to Bath. Offers a quiet, rural atmosphere with attractions nearby. | Corsham Court, Cotswold Area of Outstanding Natural Beauty, The Pound Arts Centre, Garden of Corsham, Box Woods |
| Box | A charming village located in the Cotswolds, offering stunning landscapes and walking trails. Great for nature lovers and families. | Box Hill, Royal Oak Pub, Box Church, The Cotswold Way, Nature reserves |
| Bradford on Avon | Historic town with a beautiful river running through it. Attracts visitors looking for scenic views and a historical experience. | Bradford on Avon Museum, Timber-framed buildings, River Avon, Barge Inn, Claverton Pumping Station |
| Melksham | Market town with a blend of history and modern convenience, providing good access to attractions in Wiltshire and nearby areas. | Melksham Assembly Hall, King George V Park, St. Michael's Church, The Melksham Town Trail, Nearby historical sites |
| Salisbury | Iconic city known for its cathedral and historical significance. A popular location for history buffs and tourists exploring southern England. | Salisbury Cathedral, Stonehenge nearby, Old Sarum, The Market Place, The Salisbury Museum |
Understanding Airbnb License Requirements & STR Laws in Colerne (2025)
While Colerne, England, United Kingdom currently shows low STR regulations, specific Airbnb license requirements might still exist or change. Always verify the latest short term rental regulations and Airbnb license requirements directly with local government authorities for Colerne to ensure full compliance before hosting.
(Source: AirROI data, 2025, finding no licensed listings among those analyzed)
Top Performing Airbnb Properties in Colerne (2025)
Benchmark your potential! Explore examples of top-performing Airbnb properties in Colernebased on Trailing Twelve Month (TTM) revenue. Analyze their characteristics, revenue, occupancy rate, and ADR to understand what drives success in this market.
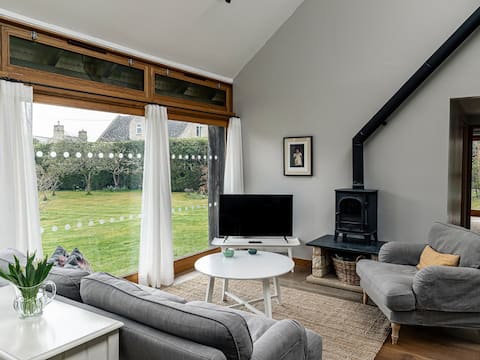
Country House with awesome views
Entire Place • 4 bedrooms
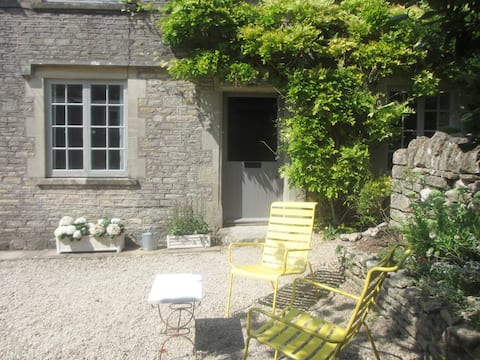
The Stables at Daubeneys
Entire Place • 1 bedroom
The Barn at Daubeneys
Entire Place • 2 bedrooms
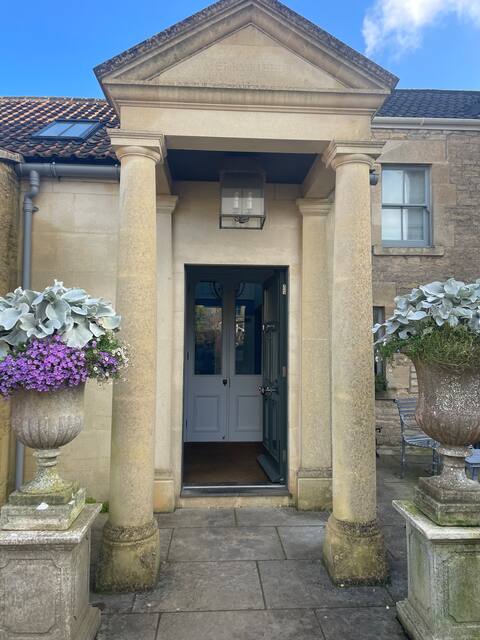
Spacious property in Colerne Village near Bath
Entire Place • 4 bedrooms
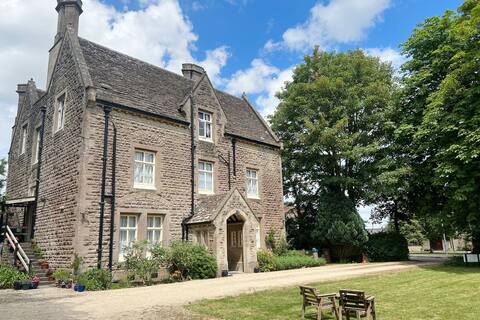
Cotswold Village House near Bath
Entire Place • 4 bedrooms

Grade ll listed Georgian townhouse near Bath
Entire Place • 3 bedrooms
Note: Performance varies based on location, size, amenities, seasonality, and management quality. Data reflects the past 12 months.
Top Performing Airbnb Hosts in Colerne (2025)
Learn from the best! This table showcases top-performing Airbnb hosts in Colerne based on the number of properties managed and estimated total revenue over the past year. Analyze their scale and performance metrics.
| Host Name | Properties | Grossing Revenue | Stay Reviews | Avg Rating |
|---|---|---|---|---|
| Cottages | 2 | $156,143 | 36 | 4.97/5.0 |
| John | 2 | $127,532 | 150 | 4.89/5.0 |
| Susan | 1 | $60,463 | 72 | 4.96/5.0 |
| Sally Joanne | 1 | $55,659 | 33 | 4.94/5.0 |
| Annette | 1 | $43,202 | 94 | 4.91/5.0 |
| Justine | 1 | $42,628 | 46 | 4.98/5.0 |
| Maggie | 1 | $35,535 | 381 | 4.98/5.0 |
| Alex | 1 | $33,395 | 53 | 4.85/5.0 |
| Camilla | 1 | $30,021 | 96 | 4.91/5.0 |
| Jess | 1 | $26,521 | 46 | 4.91/5.0 |
Analyzing the strategies of top hosts, such as their property selection, pricing, and guest communication, can offer valuable lessons for optimizing your own Airbnb operations in Colerne.
Dive Deeper: Advanced Colerne STR Market Data (2025)
Ready to unlock more insights? AirROI provides access to advanced metrics and comprehensive Airbnb data for Colerne. Explore detailed analytics beyond this report to refine your investment strategy, optimize pricing, and maximize your vacation rental profits.
Explore Advanced MetricsColerne Short-Term Rental Market Composition (2025): Property & Room Types
Room Type Distribution
Property Type Distribution
Market Composition Insights for Colerne
- The Colerne Airbnb market composition is heavily skewed towards Entire Home/Apt listings, which make up 100% of the 19 active rentals. This indicates strong guest preference for privacy and space.
- Looking at the property type distribution in Colerne, House properties are the most common (68.4%), reflecting the local real estate landscape.
- Houses represent a significant 68.4% portion, catering likely to families or larger groups.
Colerne Airbnb Room Capacity Analysis (2025): Bedroom Distribution
Distribution of Listings by Number of Bedrooms
Room Capacity Insights for Colerne
- The dominant room capacity in Colerne is 1 bedroom listings, making up 47.4% of the market. This suggests a strong demand for properties suitable for couples or solo travelers.
- Together, 1 bedroom and 2 bedrooms properties represent 68.5% of the active Airbnb listings in Colerne, indicating a high concentration in these sizes.
- A significant 26.4% of listings offer 3+ bedrooms, catering to larger groups and families seeking more space in Colerne.
Colerne Vacation Rental Guest Capacity Trends (2025)
Distribution of Listings by Guest Capacity
Guest Capacity Insights for Colerne
- The most common guest capacity trend in Colerne vacation rentals is listings accommodating 2 guests (47.4%). This suggests the primary traveler segment is likely couples or solo travelers.
- Properties designed for 2 guests and 4 guests dominate the Colerne STR market, accounting for 73.7% of listings.
- A significant 47.4% of listings cater specifically to 1-2 guests, highlighting strong demand from couples and solo travelers in Colerne.
- 26.3% of properties accommodate 6+ guests, serving the market segment for larger families or group travel in Colerne.
- On average, properties in Colerne are equipped to host 3.8 guests.
Colerne Airbnb Booking Patterns (2025): Available vs. Booked Days
Available Days Distribution
Booked Days Distribution
Booking Pattern Insights for Colerne
- The most common availability pattern in Colerne falls within the 181-270 days range, representing 42.1% of listings. This suggests many properties have significant open periods on their calendars.
- Approximately 68.4% of listings show high availability (181+ days open annually), indicating potential for increased bookings or specific owner usage patterns.
- For booked days, the 91-180 days range is most frequent in Colerne (47.4%), reflecting common guest stay durations or potential owner blocking patterns.
- A notable 31.6% of properties secure long booking periods (181+ days booked per year), highlighting successful long-term rental strategies or significant owner usage.
Colerne Airbnb Minimum Stay Requirements Analysis
Distribution of Listings by Minimum Night Requirement
1 Night
5 listings
29.4% of total
2 Nights
7 listings
41.2% of total
3 Nights
3 listings
17.6% of total
30+ Nights
2 listings
11.8% of total
Key Insights
- The most prevalent minimum stay requirement in Colerne is 2 Nights, adopted by 41.2% of listings. This highlights the market's preference for shorter, flexible bookings.
- A strong majority (70.6%) of the Colerne Airbnb data shows acceptance of very short stays (1-2 nights), indicating a dynamic, high-turnover market.
- A significant segment (11.8%) caters to monthly stays (30+ nights) in Colerne, pointing to opportunities in the extended-stay market.
Recommendations
- Align with the market by considering a 2 Nights minimum stay, as 41.2% of Colerne hosts use this setting.
- If feasible, allowing 1-night stays, especially midweek or during low season, could capture last-minute bookings, as only 29.4% currently do.
- Explore offering discounts for stays of 30+ nights to attract the 11.8% of the market seeking extended stays.
- Adjust minimum nights based on seasonality – potentially shorter during low season and longer during peak demand periods in Colerne.
Colerne Airbnb Cancellation Policy Trends Analysis (2025)
Super Strict 60 Days
2 listings
11.1% of total
Flexible
2 listings
11.1% of total
Moderate
6 listings
33.3% of total
Firm
2 listings
11.1% of total
Strict
6 listings
33.3% of total
Cancellation Policy Insights for Colerne
- The prevailing Airbnb cancellation policy trend in Colerne is Moderate, used by 33.3% of listings.
- There's a relatively balanced mix between guest-friendly (44.4%) and stricter (44.4%) policies, offering choices for different guest needs.
Recommendations for Hosts
- Consider adopting a Moderate policy to align with the 33.3% market standard in Colerne.
- With 33.3% using Strict terms, this is a viable option in Colerne, particularly for high-value properties or during peak demand periods.
- Regularly review your cancellation policy against competitors and market demand shifts in Colerne.
Colerne STR Booking Lead Time Analysis (2025)
Average Booking Lead Time by Month
Booking Lead Time Insights for Colerne
- The overall average booking lead time for vacation rentals in Colerne is 54 days.
- Guests book furthest in advance for stays during July (average 90 days), likely coinciding with peak travel demand or local events.
- The shortest booking windows occur for stays in February (average 25 days), indicating more last-minute travel plans during this time.
- Seasonally, Summer (70 days avg.) sees the longest lead times, while Winter (37 days avg.) has the shortest, reflecting typical travel planning cycles.
Recommendations for Hosts
- Use the overall average lead time (54 days) as a baseline for your pricing and availability strategy in Colerne.
- For July stays, consider implementing length-of-stay discounts or slightly higher rates for bookings made less than 90 days out to capitalize on advance planning.
- Target marketing efforts for the Summer season well in advance (at least 70 days) to capture early planners.
- Monitor your own booking lead times against these Colerne averages to identify opportunities for dynamic pricing adjustments.
Popular & Essential Airbnb Amenities in Colerne (2025)
Amenity Prevalence
Amenity Insights for Colerne
- Essential amenities in Colerne that guests expect include: Heating, Smoke alarm. Lacking these (any) could significantly impact bookings.
- Popular amenities like Cooking basics, Hangers, Private entrance are common but not universal. Offering these can provide a competitive edge.
- Warning: Wifi is not universally provided but is considered essential globally. Ensure reliable Wifi is offered.
Recommendations for Hosts
- Ensure your listing includes all essential amenities for Colerne: Heating, Smoke alarm.
- Consider adding popular differentiators like Cooking basics or Hangers to increase appeal.
- Highlight unique or less common amenities you offer (e.g., hot tub, dedicated workspace, EV charger) in your listing description and photos.
- Regularly check competitor amenities in Colerne to stay competitive.
Colerne Airbnb Guest Demographics & Profile Analysis (2025)
Guest Profile Summary for Colerne
- The typical guest profile for Airbnb in Colerne consists of primarily domestic travelers (84%), often arriving from nearby Fen Drayton, typically belonging to the Post-2000s (Gen Z/Alpha) group (50%), primarily speaking English or French.
- Domestic travelers account for 83.8% of guests.
- Key international markets include United Kingdom (83.8%) and United States (6%).
- Top languages spoken are English (66.3%) followed by French (10.8%).
- A significant demographic segment is the Post-2000s (Gen Z/Alpha) group, representing 50% of guests.
Recommendations for Hosts
- Target domestic marketing efforts towards travelers from Fen Drayton and England.
- Tailor amenities and listing descriptions to appeal to the dominant Post-2000s (Gen Z/Alpha) demographic (e.g., highlight fast WiFi, smart home features, local guides).
- Highlight unique local experiences or amenities relevant to the primary guest profile.
- Consider seasonal promotions aligned with peak travel times for key origin markets.
Nearby Short-Term Rental Market Comparison
How does the Colerne Airbnb market stack up against its neighbors? Compare key performance metrics like average monthly revenue, ADR, and occupancy rates in surrounding areas to understand the broader regional STR landscape.
| Market | Active Properties | Monthly Revenue | Daily Rate | Avg. Occupancy |
|---|---|---|---|---|
| Englishcombe | 13 | $8,558 | $573.69 | 49% |
| Chew Magna | 14 | $6,649 | $399.59 | 46% |
| Lambourn | 11 | $6,081 | $669.47 | 28% |
| Long Sutton | 17 | $5,726 | $383.88 | 46% |
| Stoke St. Michael | 10 | $5,277 | $424.04 | 42% |
| Winsham | 10 | $5,154 | $484.22 | 52% |
| Oldland Common | 13 | $5,093 | $355.47 | 43% |
| Crai | 20 | $4,799 | $371.85 | 46% |
| Dinton | 11 | $4,637 | $242.16 | 58% |
| Limpley Stoke | 10 | $4,598 | $523.47 | 52% |