Clifford Airbnb Market Analysis 2025: Short Term Rental Data & Vacation Rental Statistics in England, United Kingdom
Is Airbnb profitable in Clifford in 2025? Explore comprehensive Airbnb analytics for Clifford, England, United Kingdom to uncover income potential. This 2025 STR market report for Clifford, based on AirROI data from April 2024 to March 2025, reveals key trends in the niche market of 22 active listings.
Whether you're considering an Airbnb investment in Clifford, optimizing your existing vacation rental, or exploring rental arbitrage opportunities, understanding the Clifford Airbnb data is crucial. Leveraging the low regulation environment is key to maximizing your short term rental income potential. Let's dive into the specifics.
Key Clifford Airbnb Performance Metrics Overview
Monthly Airbnb Revenue Variations & Income Potential in Clifford (2025)
Understanding the monthly revenue variations for Airbnb listings in Clifford is key to maximizing your short term rental income potential. Seasonality significantly impacts earnings. Our analysis, based on data from the past 12 months, shows that the peak revenue month for STRs in Clifford is typically April, while March often presents the lowest earnings, highlighting opportunities for strategic pricing adjustments during shoulder and low seasons. Explore the typical Airbnb income in Clifford across different performance tiers:
- Best-in-class properties (Top 10%) achieve $12,590+ monthly, often utilizing dynamic pricing and superior guest experiences.
- Strong performing properties (Top 25%) earn $5,677 or more, indicating effective management and desirable locations/amenities.
- Typical properties (Median) generate around $2,401 per month, representing the average market performance.
- Entry-level properties (Bottom 25%) see earnings around $1,356, often with potential for optimization.
Average Monthly Airbnb Earnings Trend in Clifford
Clifford Airbnb Occupancy Rate Trends (2025)
Maximize your bookings by understanding the Clifford STR occupancy trends. Seasonal demand shifts significantly influence how often properties are booked. Typically, Augustsees the highest demand (peak season occupancy), while March experiences the lowest (low season). Effective strategies, like adjusting minimum stays or offering promotions, can boost occupancy during slower periods. Here's how different property tiers perform in Clifford:
- Best-in-class properties (Top 10%) achieve 78%+ occupancy, indicating high desirability and potentially optimized availability.
- Strong performing properties (Top 25%) maintain 60% or higher occupancy, suggesting good market fit and guest satisfaction.
- Typical properties (Median) have an occupancy rate around 34%.
- Entry-level properties (Bottom 25%) average 20% occupancy, potentially facing higher vacancy.
Average Monthly Occupancy Rate Trend in Clifford
Average Daily Rate (ADR) Airbnb Trends in Clifford (2025)
Effective short term rental pricing strategy in Clifford involves understanding monthly ADR fluctuations. The Average Daily Rate (ADR) for Airbnb in Clifford typically peaks in November and dips lowest during September. Leveraging Airbnb dynamic pricing tools or strategies based on this seasonality can significantly boost revenue. Here's a look at the typical nightly rates achieved:
- Best-in-class properties (Top 10%) command rates of $522+ per night, often due to premium features or locations.
- Strong performing properties (Top 25%) achieve nightly rates of $302 or more.
- Typical properties (Median) charge around $195 per night.
- Entry-level properties (Bottom 25%) earn around $134 per night.
Average Daily Rate (ADR) Trend by Month in Clifford
Get Live Clifford Market Intelligence 👇

Explore Real-time Analytics
Airbnb Seasonality Analysis & Trends in Clifford (2025)
Peak Season (April, December, August)
- Revenue averages $6,190 per month
- Occupancy rates average 48.5%
- Daily rates average $348
Shoulder Season
- Revenue averages $4,603 per month
- Occupancy maintains around 39.0%
- Daily rates hold near $352
Low Season (February, March, September)
- Revenue drops to average $2,912 per month
- Occupancy decreases to average 35.6%
- Daily rates adjust to average $369
Seasonality Insights for Clifford
- The Airbnb seasonality in Clifford shows highly seasonal trends requiring careful strategy. While the sections above show seasonal averages, it's also insightful to look at the extremes:
- During the high season, the absolute peak month showcases Clifford's highest earning potential, with monthly revenues capable of climbing to $7,836, occupancy reaching a high of 53.6%, and ADRs peaking at $429.
- Conversely, the slowest single month of the year, typically falling within the low season, marks the market's lowest point. In this month, revenue might dip to $1,976, occupancy could drop to 30.6%, and ADRs may adjust down to $308.
- Understanding both the seasonal averages and these monthly peaks and troughs in revenue, occupancy, and ADR is crucial for maximizing your Airbnb profit potential in Clifford.
Seasonal Strategies for Maximizing Profit
- Peak Season: Maximize revenue through premium pricing and potentially longer minimum stays. Ensure high availability.
- Low Season: Offer competitive pricing, special promotions (e.g., extended stay discounts), and flexible cancellation policies. Target off-season travelers like remote workers or budget-conscious guests.
- Shoulder Seasons: Implement dynamic pricing that balances peak and low rates. Target weekend travelers or specific events. Offer slightly more flexible terms than peak season.
- Regularly analyze your own performance against these Clifford seasonality benchmarks and adjust your pricing and availability strategy accordingly.
Best Areas for Airbnb Investment in Clifford (2025)
Exploring the top neighborhoods for short-term rentals in Clifford? This section highlights key areas, outlining why they are attractive for hosts and guests, along with notable local attractions. Consider these locations based on your target guest profile and investment strategy.
| Neighborhood / Area | Why Host Here? (Target Guests & Appeal) | Key Attractions & Landmarks |
|---|---|---|
| Clifford Village | A charming village nestled in the countryside, offering a peaceful retreat for guests looking to escape the hustle and bustle of city life. Ideal for nature lovers and those seeking tranquility. | Clifford Castle, River Wharfe, Yorkshire Dales National Park, Local walking trails, Dining at the local pub |
| Knaresborough | Historic market town known for its stunning viaduct and scenic riverside walks. Popular destination for family visits and couples looking for a romantic weekend getaway. | Knaresborough Castle, Mother Shipton's Cave, Knaresborough Market, Nidderdale Greenway, Walking along the River Nidd |
| Harrogate | Famous spa town with beautiful gardens and Victorian architecture. Attracts tourists for wellness retreats and cultural festivals throughout the year. | Royal Pump Room Museum, Valley Gardens, Harrogate Turkish Baths, Harrogate Festival, Studley Royal Park |
| Wetherby | A historic town with a picturesque high street, offering a taste of Yorkshire's market town charm. Great for visiting families and those exploring local history. | Wetherby Bridge, Wetherby Racecourse, The Old Market Place, Local shops and cafes, River Wharfe walks |
| York | A vibrant city steeped in history, with attractions that cater to all ages. A must-visit for anyone looking to experience the rich culture of England's past. | York Minster, The Shambles, York Castle Museum, National Railway Museum, Walking tours of historic sites |
| Leeds | A bustling city with a mix of entertainment, culture, and shopping. Popular with business travelers and those looking for urban experiences. | Royal Armouries Museum, Leeds City Museum, Kirkgate Market, Leeds Art Gallery, The Light shopping and entertainment venue |
| Ripon | A small cathedral city known for its historical significance and beautiful architecture. Offers a quiet setting ideal for guests interested in history and culture. | Ripon Cathedral, Fountains Abbey, Lightwater Valley Theme Park, Ripon Market Place |
| Otley | Picturesque market town surrounded by beautiful countryside. Perfect for guests wanting to enjoy outdoor activities such as hiking and cycling, as well as local food and drink. | Otley Chevin Forest Park, Otley Market, Wharfliffe Mount, Local breweries, River Wharfe pathways |
Understanding Airbnb License Requirements & STR Laws in Clifford (2025)
While Clifford, England, United Kingdom currently shows low STR regulations, specific Airbnb license requirements might still exist or change. Always verify the latest short term rental regulations and Airbnb license requirements directly with local government authorities for Clifford to ensure full compliance before hosting.
(Source: AirROI data, 2025, finding no licensed listings among those analyzed)
Top Performing Airbnb Properties in Clifford (2025)
Benchmark your potential! Explore examples of top-performing Airbnb properties in Cliffordbased on Trailing Twelve Month (TTM) revenue. Analyze their characteristics, revenue, occupancy rate, and ADR to understand what drives success in this market.
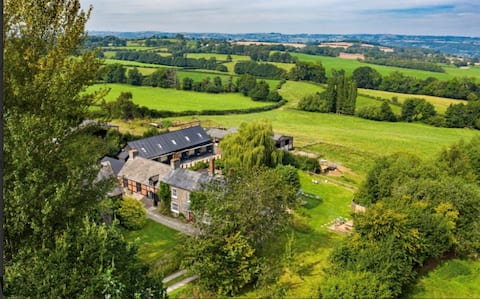
Westbrook Court nr Hay on Wye (21 adults + 5 kids)
Entire Place • 9 bedrooms
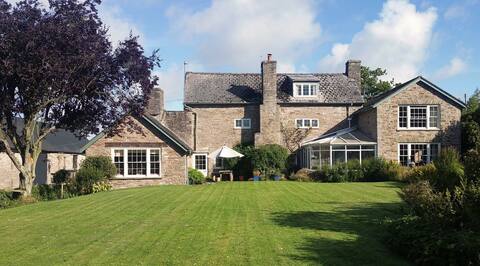
Farmhouse nr Hay-on-Wye &Brecon Beacons sleeps 12
Entire Place • 5 bedrooms
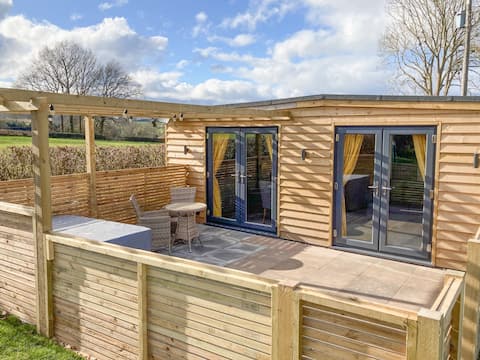
Swallow Lodge - UK42540
Entire Place • 1 bedroom
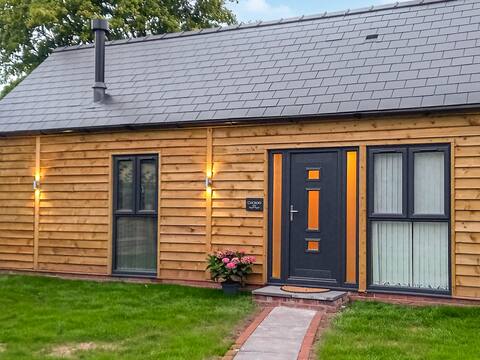
Cuckoo Lodge - uk42541
Entire Place • 1 bedroom
Newton Court
Entire Place • 9 bedrooms

Cynefin Retreats Lodge with Hot Tub
Entire Place • 2 bedrooms
Note: Performance varies based on location, size, amenities, seasonality, and management quality. Data reflects the past 12 months.
Top Performing Airbnb Hosts in Clifford (2025)
Learn from the best! This table showcases top-performing Airbnb hosts in Clifford based on the number of properties managed and estimated total revenue over the past year. Analyze their scale and performance metrics.
| Host Name | Properties | Grossing Revenue | Stay Reviews | Avg Rating |
|---|---|---|---|---|
| Cottages | 4 | $243,308 | 45 | 3.75/5.0 |
| Kari | 1 | $179,913 | 3 | 5.00/5.0 |
| Louise | 1 | $146,206 | 28 | 4.96/5.0 |
| Host #442905678 | 1 | $76,334 | 0 | 0.00/5.0 |
| Lorna | 1 | $61,476 | 19 | 4.95/5.0 |
| Kesri | 4 | $57,232 | 36 | 4.92/5.0 |
| Val And Nancy | 1 | $41,012 | 123 | 4.93/5.0 |
| Mary | 2 | $36,115 | 72 | 2.47/5.0 |
| Sharon | 1 | $31,306 | 235 | 4.99/5.0 |
| Pat & Catherine | 1 | $30,625 | 279 | 4.94/5.0 |
Analyzing the strategies of top hosts, such as their property selection, pricing, and guest communication, can offer valuable lessons for optimizing your own Airbnb operations in Clifford.
Dive Deeper: Advanced Clifford STR Market Data (2025)
Ready to unlock more insights? AirROI provides access to advanced metrics and comprehensive Airbnb data for Clifford. Explore detailed analytics beyond this report to refine your investment strategy, optimize pricing, and maximize your vacation rental profits.
Explore Advanced MetricsClifford Short-Term Rental Market Composition (2025): Property & Room Types
Room Type Distribution
Property Type Distribution
Market Composition Insights for Clifford
- The Clifford Airbnb market composition is heavily skewed towards Entire Home/Apt listings, which make up 100% of the 22 active rentals. This indicates strong guest preference for privacy and space.
- Looking at the property type distribution in Clifford, House properties are the most common (72.7%), reflecting the local real estate landscape.
- Houses represent a significant 72.7% portion, catering likely to families or larger groups.
Clifford Airbnb Room Capacity Analysis (2025): Bedroom Distribution
Distribution of Listings by Number of Bedrooms
Room Capacity Insights for Clifford
- The dominant room capacity in Clifford is 2 bedrooms listings, making up 36.4% of the market. This suggests a strong demand for properties suitable for couples or solo travelers.
- Together, 2 bedrooms and 1 bedroom properties represent 72.8% of the active Airbnb listings in Clifford, indicating a high concentration in these sizes.
- A significant 27.3% of listings offer 3+ bedrooms, catering to larger groups and families seeking more space in Clifford.
Clifford Vacation Rental Guest Capacity Trends (2025)
Distribution of Listings by Guest Capacity
Guest Capacity Insights for Clifford
- The most common guest capacity trend in Clifford vacation rentals is listings accommodating 4 guests (40.9%). This suggests the primary traveler segment is likely small families or groups.
- Properties designed for 4 guests and 2 guests dominate the Clifford STR market, accounting for 68.2% of listings.
- 22.7% of properties accommodate 6+ guests, serving the market segment for larger families or group travel in Clifford.
- On average, properties in Clifford are equipped to host 4.3 guests.
Clifford Airbnb Booking Patterns (2025): Available vs. Booked Days
Available Days Distribution
Booked Days Distribution
Booking Pattern Insights for Clifford
- The most common availability pattern in Clifford falls within the 271-366 days range, representing 59.1% of listings. This suggests many properties have significant open periods on their calendars.
- Approximately 63.6% of listings show high availability (181+ days open annually), indicating potential for increased bookings or specific owner usage patterns.
- For booked days, the 31-90 days range is most frequent in Clifford (50%), reflecting common guest stay durations or potential owner blocking patterns.
- A notable 36.3% of properties secure long booking periods (181+ days booked per year), highlighting successful long-term rental strategies or significant owner usage.
Clifford Airbnb Minimum Stay Requirements Analysis
Distribution of Listings by Minimum Night Requirement
1 Night
7 listings
35% of total
2 Nights
6 listings
30% of total
3 Nights
2 listings
10% of total
4-6 Nights
1 listings
5% of total
30+ Nights
4 listings
20% of total
Key Insights
- The most prevalent minimum stay requirement in Clifford is 1 Night, adopted by 35% of listings. This highlights the market's preference for shorter, flexible bookings.
- A strong majority (65.0%) of the Clifford Airbnb data shows acceptance of very short stays (1-2 nights), indicating a dynamic, high-turnover market.
- A significant segment (20%) caters to monthly stays (30+ nights) in Clifford, pointing to opportunities in the extended-stay market.
Recommendations
- Align with the market by considering a 1 Night minimum stay, as 35% of Clifford hosts use this setting.
- Explore offering discounts for stays of 30+ nights to attract the 20% of the market seeking extended stays.
- Adjust minimum nights based on seasonality – potentially shorter during low season and longer during peak demand periods in Clifford.
Clifford Airbnb Cancellation Policy Trends Analysis (2025)
Super Strict 60 Days
3 listings
17.6% of total
Flexible
1 listings
5.9% of total
Moderate
2 listings
11.8% of total
Firm
3 listings
17.6% of total
Strict
8 listings
47.1% of total
Cancellation Policy Insights for Clifford
- The prevailing Airbnb cancellation policy trend in Clifford is Strict, used by 47.1% of listings.
- A majority (64.7%) of hosts in Clifford utilize Firm or Strict policies, indicating a market where hosts prioritize booking security.
Recommendations for Hosts
- Consider adopting a Strict policy to align with the 47.1% market standard in Clifford.
- With 47.1% using Strict terms, this is a viable option in Clifford, particularly for high-value properties or during peak demand periods.
- Regularly review your cancellation policy against competitors and market demand shifts in Clifford.
Clifford STR Booking Lead Time Analysis (2025)
Average Booking Lead Time by Month
Booking Lead Time Insights for Clifford
- The overall average booking lead time for vacation rentals in Clifford is 59 days.
- Guests book furthest in advance for stays during May (average 165 days), likely coinciding with peak travel demand or local events.
- The shortest booking windows occur for stays in November (average 41 days), indicating more last-minute travel plans during this time.
- Seasonally, Spring (94 days avg.) sees the longest lead times, while Fall (56 days avg.) has the shortest, reflecting typical travel planning cycles.
Recommendations for Hosts
- Use the overall average lead time (59 days) as a baseline for your pricing and availability strategy in Clifford.
- For May stays, consider implementing length-of-stay discounts or slightly higher rates for bookings made less than 165 days out to capitalize on advance planning.
- Target marketing efforts for the Spring season well in advance (at least 94 days) to capture early planners.
- Monitor your own booking lead times against these Clifford averages to identify opportunities for dynamic pricing adjustments.
Popular & Essential Airbnb Amenities in Clifford (2025)
Amenity Prevalence
Amenity Insights for Clifford
- Essential amenities in Clifford that guests expect include: Free parking on premises, Heating, Wifi. Lacking these (any) could significantly impact bookings.
- Popular amenities like Smoke alarm, Cooking basics, Essentials are common but not universal. Offering these can provide a competitive edge.
Recommendations for Hosts
- Ensure your listing includes all essential amenities for Clifford: Free parking on premises, Heating, Wifi.
- Prioritize adding missing essentials: Free parking on premises, Heating, Wifi.
- Consider adding popular differentiators like Smoke alarm or Cooking basics to increase appeal.
- Highlight unique or less common amenities you offer (e.g., hot tub, dedicated workspace, EV charger) in your listing description and photos.
- Regularly check competitor amenities in Clifford to stay competitive.
Clifford Airbnb Guest Demographics & Profile Analysis (2025)
Guest Profile Summary for Clifford
- The typical guest profile for Airbnb in Clifford consists of primarily domestic travelers (93%), often arriving from nearby England, typically belonging to the Post-2000s (Gen Z/Alpha) group (50%), primarily speaking English or French.
- Domestic travelers account for 93.4% of guests.
- Key international markets include United Kingdom (93.4%) and United States (1.6%).
- Top languages spoken are English (75%) followed by French (11%).
- A significant demographic segment is the Post-2000s (Gen Z/Alpha) group, representing 50% of guests.
Recommendations for Hosts
- Target domestic marketing efforts towards travelers from England and London.
- Tailor amenities and listing descriptions to appeal to the dominant Post-2000s (Gen Z/Alpha) demographic (e.g., highlight fast WiFi, smart home features, local guides).
- Highlight unique local experiences or amenities relevant to the primary guest profile.
- Consider seasonal promotions aligned with peak travel times for key origin markets.
Nearby Short-Term Rental Market Comparison
How does the Clifford Airbnb market stack up against its neighbors? Compare key performance metrics like average monthly revenue, ADR, and occupancy rates in surrounding areas to understand the broader regional STR landscape.
| Market | Active Properties | Monthly Revenue | Daily Rate | Avg. Occupancy |
|---|---|---|---|---|
| Englishcombe | 13 | $8,558 | $573.69 | 49% |
| Chew Magna | 14 | $6,649 | $399.59 | 46% |
| Long Sutton | 17 | $5,726 | $383.88 | 46% |
| Stoke St. Michael | 10 | $5,277 | $424.04 | 42% |
| Oldland Common | 13 | $5,093 | $355.47 | 43% |
| Llanrhidian | 15 | $4,842 | $386.18 | 53% |
| Crai | 20 | $4,799 | $371.85 | 46% |
| Limpley Stoke | 10 | $4,598 | $523.47 | 52% |
| Abbeycwmhir | 10 | $4,502 | $259.19 | 49% |
| Ashley | 16 | $4,496 | $321.11 | 52% |